SOXS Options Price a ±$5.97 Move Into September 18 — the Chart Model Sees $43.20
The options market is pricing SOXS between $38.17 and $50.11 into the September 18 expiration, while the 5-day chart model projects a far tighter band around $43.20. Here is what the positioning data actually shows, the levels that matter, and three defined-risk ways to trade a neutral read.

The options market implies a $38.17–$50.11 range into the September 18 expiration; here's what's driving it and three defined-risk ways to trade it.
Published Sunday, September 13, 2026 · Data as of Friday, September 11 close
Explore the live SOXS options data in the Detailed Options Analyzer →
Quick answer
| Item | Answer |
|---|---|
| Market bias | Neutral |
| Options-implied range (into September 18) | $38.17 – $50.11 (±13.53%) |
| Major support | $40.00 — the September 18 expiration's put wall |
| Major resistance | $50.00 — the whole chain's heaviest call strike (the September 18 expiration's own call wall sits far out at $80.00) |
| Max pain (September 18) | $44.00 |
| Dealer gamma regime (estimate) | Positive — hedging tends to dampen moves; flip level ≈ $45.00 |
| Volatility condition | Falling — IV rank 21.73/100 · premium rich: options priced about 8 vol points above delivered movement |
| Technical check | Mixed (bullish 3-day model, bearish 5-day model) |
| Best-fitting strategy | September 18 iron condor, $40/$38 put side and $50/$52 call side |
| Analysis invalidated if | SOXS closes below $40.00 |
1 · What matters today
SOXS closed Friday, September 11 at $44.14 after a brutal five-session slide of 14.5%. The options market is pricing a move of roughly $5.97 either way — about 13.5% — through the September 18 expiration, which puts the rails at $38.17 and $50.11. That is an enormous band, and it is why our read comes out flat rather than directional: the signals genuinely disagree. Short-dated flow has turned call-heavy, put open interest has been piling up across the rest of the curve, and price momentum is sharply negative — they cancel out. The anchor for the next four sessions is max pain at $44.00 (the price where the most option value would expire worthless), with $40.00 and $50.00 as the walls. A close below $40.00 kills this read. The chart models split too: one leans up over two days, the other down into the 18th.
2 · What the options market is pricing
What changed this week
The last five sessions have been violent. SOXS fell 14.46% over that stretch, yet it is still up 10.32% over the past twenty sessions — the past week's slide runs directly against the bigger trend, and our short- and long-term trend reads are pointing different ways. That divergence is the single most useful framing for the week ahead: nothing here has resolved.
Implied volatility — the market's estimate of how much SOXS will move, baked into option prices — kept bleeding out even as the stock fell. At-the-money IV finished at 107.8%, down 6.4% on the day, up just 2.1% over five sessions, and down 41.8% over the past thirty. It now sits 20.8% below its own 30-day average of 136.2% and far under the 90-day average of 161.5%. IV rank landed at 21.73 against a 7-day average of 25.97 and a 14-day average of 28.53 — drifting toward the cheap end of its own year.
Positioning told a two-sided story. Put open interest built steadily: the ratio of puts to calls held open went from 0.46 to 0.62 over five sessions (+33%), against a 14-day average of 0.54 — for every call contract held open there are now 0.62 puts, up sharply from a week ago. But Friday's flow flipped the other way: call open interest grew by 6,617 contracts against just 412 on the put side, and call volume ran nearly two-to-one over puts (26,353 versus 14,238, a put/call volume ratio of 0.54 against a 60-day median of 0.47). Total option volume ran 1.73× its 20-day average. Forward-looking, the biggest builds sat in the September 18 $47.50 calls (+579 contracts, to 611) and the $46.50 calls (+533). Into Friday's expiration, the settled $46 calls added 1,547 contracts of open interest — history now, but it shows where the day's chase was aimed.
Expected move
The expected move — the move the options market is pricing in, derived from what straddles cost — is ±13.53%, or about $5.97, through September 18. Here is the ladder across the next few expirations, all built off Friday's $44.14 close:
| Expiration | Implied move | Range around $44.14 |
|---|---|---|
| September 18 (7 DTE) | ±13.53% | $38.17 – $50.11 |
| September 25 (14 DTE) | ±18.93% | $35.78 – $52.50 |
| October 2 (21 DTE) | ±24.42% | $33.36 – $54.92 |
| October 9 (28 DTE) | ±29.84% | $30.97 – $57.31 |
The rungs step up almost exactly with the square root of time, which means the chain is not pricing any single dated event inside the window — just the ordinary compounding of a very high baseline volatility. The September 18 rung's own at-the-money IV reads 97.7%, slightly below the chain-wide 107.8% figure.
Volatility
IV rank of 21.73/100 means today's implied volatility is cheaper than roughly 78% of the past year's readings for this name; the percentile measure agrees at 30.6. The direction is down — off 6.4% in a day and 41.8% over a month — and IV sits below both its 30-day and 90-day averages. The front-month read is unavailable today because Friday was an expiry day, so the term-structure comparison (option prices across different expiration dates) has to wait for the next session. For context, this symbol's own implied volatility has tracked the broad volatility index closely (a 0.73 correlation over the past sixty observations), and that index is sitting at just 13/100 on its own 52-week scale — calm in the wider market is part of why SOXS options are priced where they are.
Against its own norm, SOXS has not been calm at all. Twenty-day realized volatility — how much the stock has actually been moving — is running at 99.7% annualized, and the 5-day-versus-20-day ratio sits at 1.09, meaningfully above this symbol's recent baseline: movement is accelerating, not settling.
Premium rich or cheap. The volatility risk premium is the gap between how much movement options are priced for and how much SOXS has actually delivered — when it is positive, option sellers have been collecting more than realized movement cost them. That gap currently stands at about 8 vol points (107.8% implied against 99.7% delivered), and it sits at the 70th percentile of this stock's own recent readings — richer than about 70% of them. That is the odd combination this week: IV rank says options are cheap versus the past year, while the premium-over-delivered gauge says sellers are being paid better than usual versus the past quarter. The path matters too — the gap was deeply negative through late August, flipped positive on September 1, peaked near 28 vol points on September 8, and has collapsed back to 8 points as realized movement caught up. Richness is fading fast. On balance the combination still tilts toward collecting premium rather than owning it, but with a shrinking edge and a strong preference for defined-risk structures.
Skew and sentiment
Puts and calls the same distance from the stock price don't cost the same — when puts are pricier, traders are paying up for protection against a drop. Here, 25-delta puts are marked at 112.0% implied volatility against 107.4% for 25-delta calls: puts are running 4.6 vol points over calls. That sounds mild until you compare it with this symbol's own baseline, where the 60-day median is negative 20.8 vol points — calls normally carry the premium in this name. So relative to its own history, downside protection is about 25 vol points richer than usual. That is the most stretched single reading on the board, and it is the main reason our composite doesn't lean bullish despite the call-side flow.
Two things soften it. First, the skew has been flattening fast: the 14-day average sits at 18.3 vol points and the 3-day average at 6.4, so put demand has been bleeding off session by session. Second, near-dated sentiment has turned. Our read of flow in options expiring within a week came in strongly positive at +70 on the back of call open interest building 4,042 contracts against a 549-contract drop on the put side; the 7-to-30-day bucket reads a mild +7, while the 30-to-60-day bucket sits at −18. The overall regime label is Mixed — no single lean dominates. One more "vs its own norm" note: the tally of put-side sweeps clearing the peer-relative unusual bar was unusually one-sided for this name on Friday, even as bulk volume skewed to calls.
The key levels map
| Level | Price | Why it matters |
|---|---|---|
| Call wall, September 18 | $80.00 | The expiration's heaviest call open interest (2,556 contracts) — but a long-shot strike, not a working ceiling |
| Upper rail of implied range | $50.11 | Top of the ±13.53% band the options market is pricing into September 18 |
| Chain's heaviest call strike | $50.00 | 5,223 calls held open across all expirations; 2,277 contracts traded here Friday — the practical overhead magnet |
| Swing resistance | $48.20 | Heuristic pivot cluster from recent price structure |
| 50-day moving average | $47.52 | Price sits 7.1% below it |
| Large gamma strike | $47.00 | Fourth-largest gamma pile chain-wide |
| 20-day moving average | $46.74 | Price sits 5.6% below it |
| Gamma flip level (estimate) | $45.00 | One rough estimate puts the hedging pivot here; also the single largest gamma strike on the board |
| Swing resistance | $44.71 | Nearest overhead pivot from price structure |
| Spot | $44.14 | Friday's close |
| Max pain, September 18 | $44.00 | Where the most option value would expire worthless — expirations sometimes gravitate toward it |
| Swing support | $43.12 | Nearest pivot below spot |
| Put wall, September 18 | $40.00 | 1,585 puts held open at this strike for the target expiration — and 4,839 across the whole chain, the biggest put pile anywhere on the board |
| Lower rail of implied range | $38.17 | Bottom of the ±13.53% band into September 18 |
| Swing support | $37.50 | Next structural shelf below the put wall |
Worth naming the disagreement plainly: the September 18 expiration's own call wall is at $80.00, a strike so far out of the money that it behaves like a lottery ticket rather than a ceiling. The whole chain's heaviest call strike — $50.00 — is the level that actually sits in the path of a rally. Both walls agree on the downside: $40.00 is the put wall for the target expiration and for the chain as a whole.
Positioning and unusual flow
Market makers hedge the options they've sold, and in a positive-gamma regime that hedging tends to lean against moves rather than amplify them. One rough estimate puts net dealer gamma positive both chain-wide and for the September 18 expiration specifically — but the same estimate places the pivot at $45.00, just above Friday's close. Spot is sitting about 1.9% below that pivot, unusually close to it for this name, which means the cushioning the estimate implies is not clearly in force at current prices. Treat it as a rough map, not a fact.
Three flow items stood out among contracts that are still live:
- September 18 $50 calls — 2,277 contracts traded against 1,725 held open, roughly $143,000 of premium changing hands. That is the busiest line on the board, and it sits exactly at the chain's heaviest call strike.
- September 18 $38 and $36 puts — both brand-new strikes. The $38s printed 687 contracts and built 503 of open interest from zero; the $36s printed 342 and built 261. Somebody paid up for cheap tail protection right at and below the lower rail of the implied range.
- October 16 $42 puts — 262 traded against just 10 held open, a 26× turnover ratio and about $121,000 of premium. Well outside this article's window, but it is the largest genuine turnover spike on the non-expired board and it leans the same way as the fresh September tails.
3 · Technical check
The two chart models disagree with each other, which is itself the story. The 3-day model, anchored to a $44.165 reference price, reads bullish with a target of $44.85 and a projected range of $43.20 to $45.55 through September 16. It leans on a fresh short-term moving-average cross, a money-flow reading that swung from distribution to accumulation intraday, and a directional-index cross in favor of buyers — while conceding the overall trend strength reads weak. Against the options-implied band it confirms in the loose sense: the target sits comfortably inside $38.17–$50.11, close to max pain at $44.00.
The 5-day model, which targets our exact expiration date, reads bearish: $43.20 with a projected range of $41.90 to $44.70. Its case is structural — price below both its short-term exponential averages and the 50-day at $47.52, with money flow negative across its entire lookback window. Its dominant scenario invalidates on a sustained close above $44.50; its downside trigger is a close below $43.00.
Both projections sit entirely inside the options-implied band, and they point in opposite directions over a two-day gap. That is a textbook argument for a neutral book rather than a directional one, and it is why the structures below use short strikes at $40 and $50 rather than shading either way. Neither model's range came anywhere near the rails.
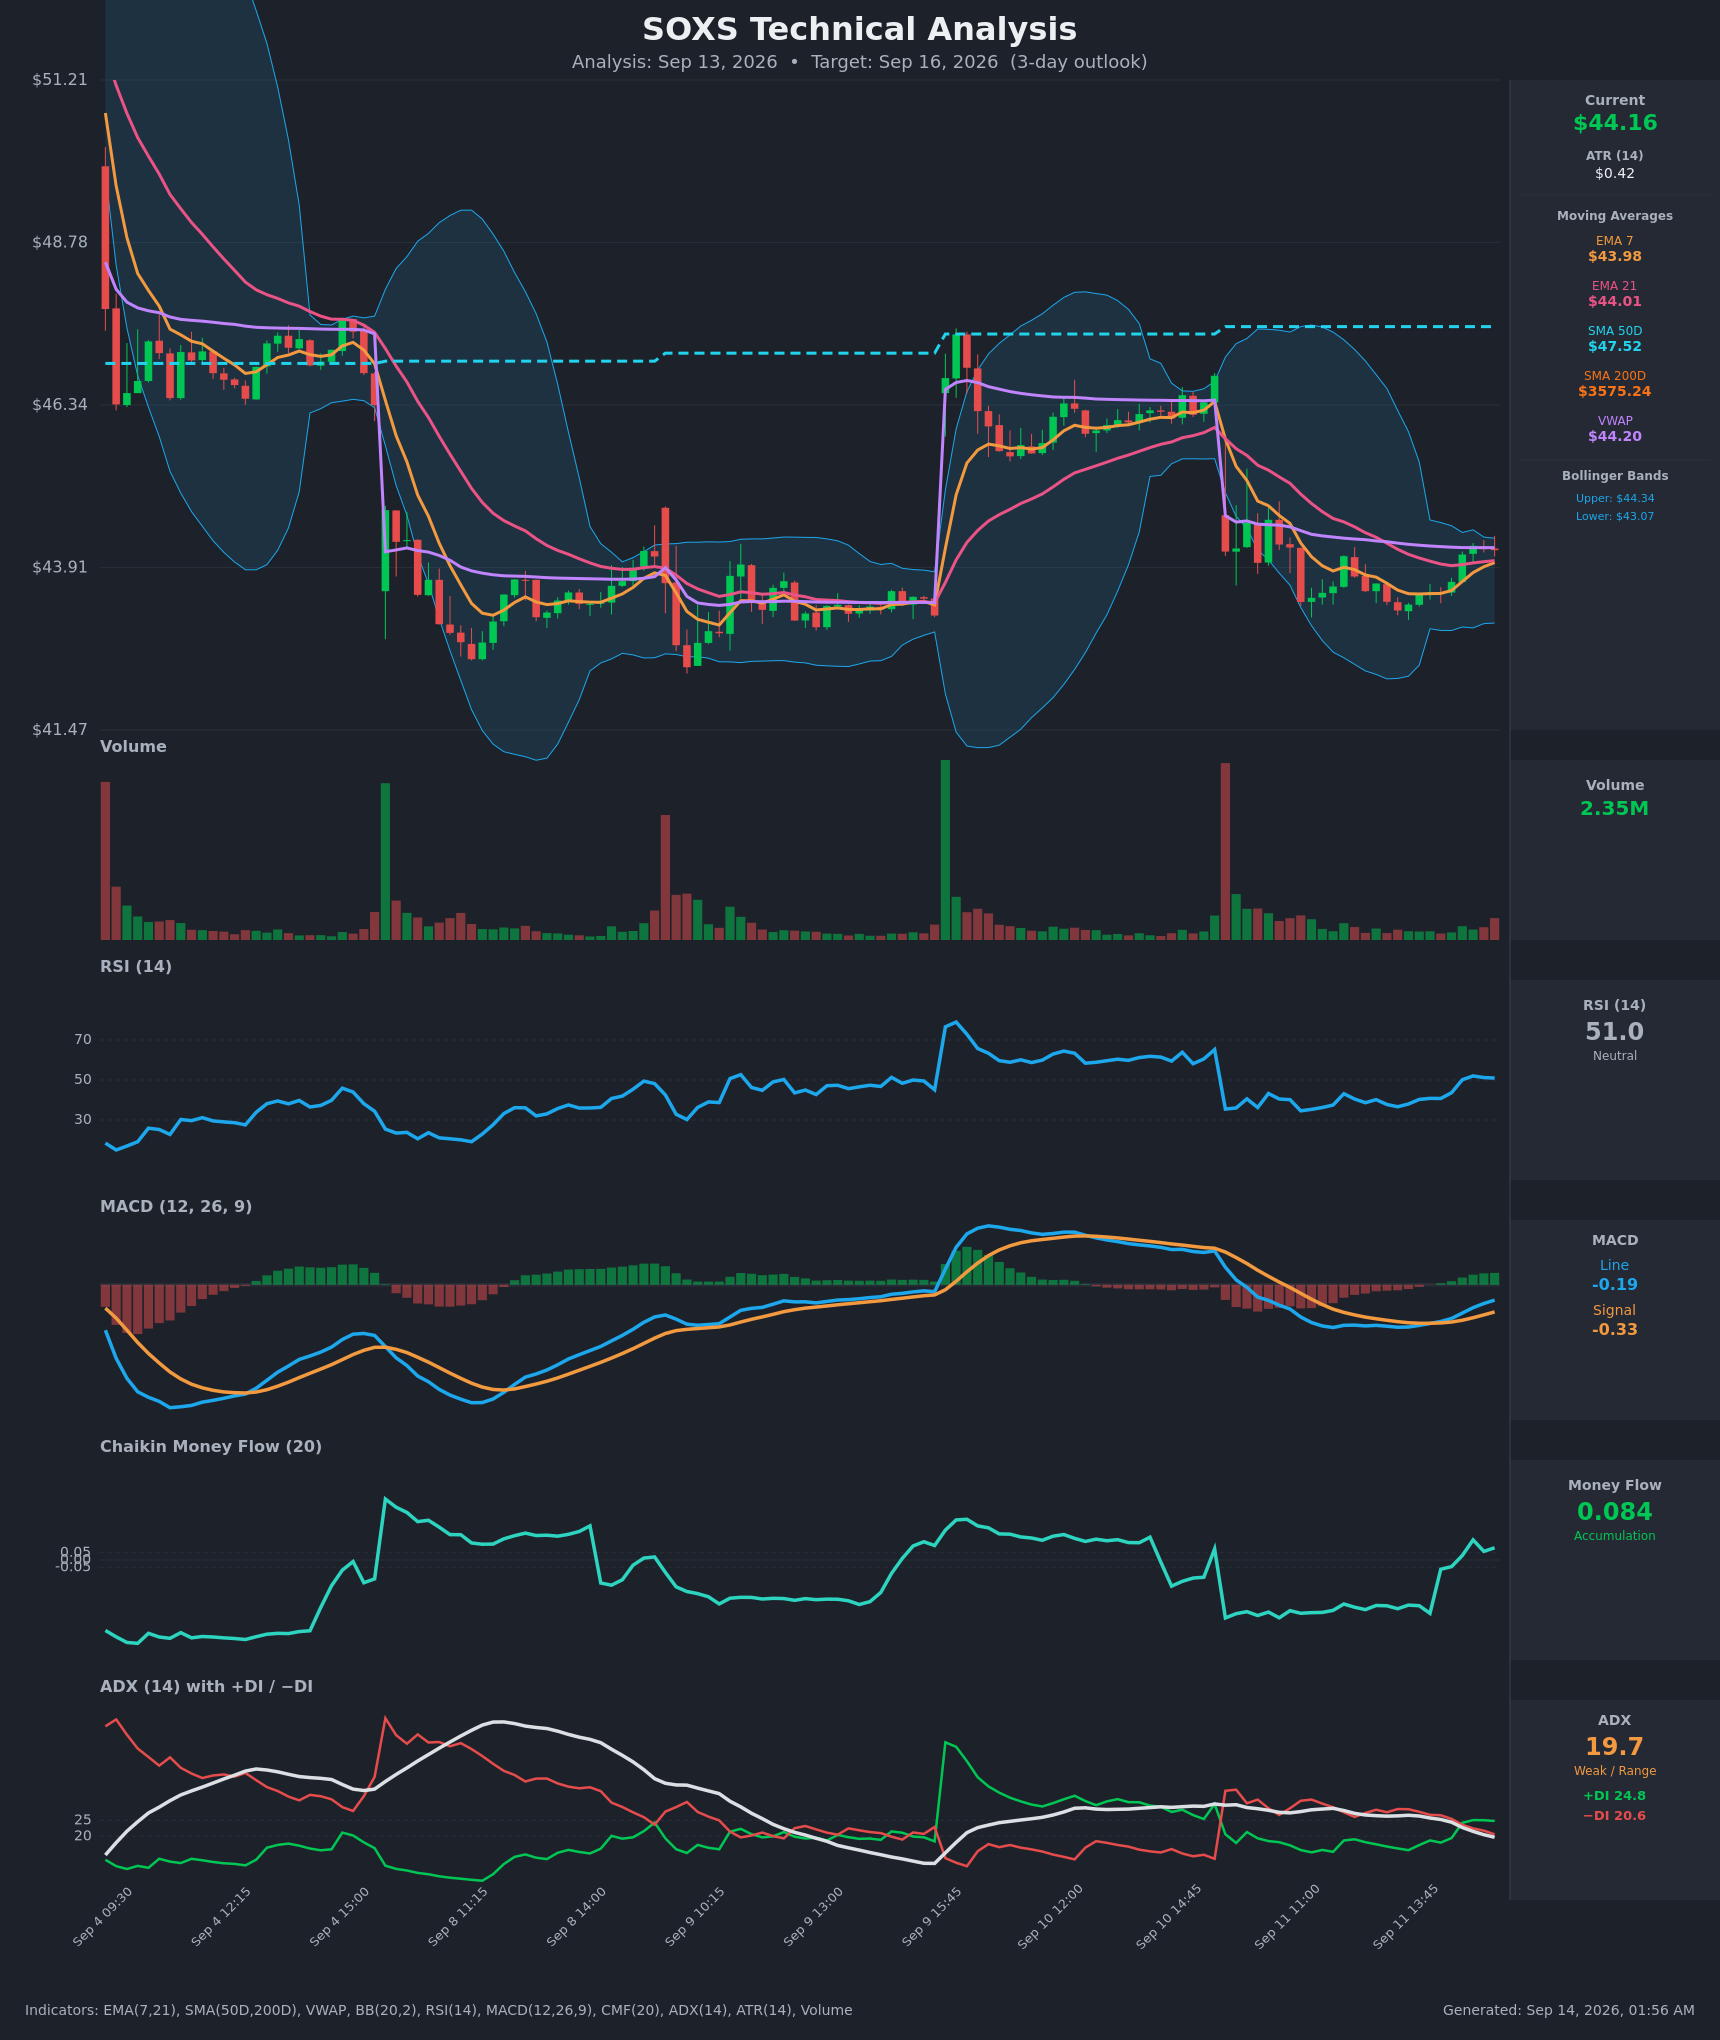
Model vs. Market: The options market implies $38.17–$50.11 into September 18; the 5-day technical model targets $43.20 inside a $41.90–$44.70 band. The chart model is pricing a corridor roughly one-quarter the width of the one the options market is charging for — if the chart model is right, everything sold outside $42 and $47 expires worthless.
Full technical write-ups: 3-day report → · 5-day report →
4 · Three ways the next four days can go
If SOXS pushes through $45.00 and toward $50.00: $45.00 is both the largest gamma strike on the board and the estimated hedging pivot, so it is the first real friction point overhead. Above it, the next concentration is $50.00, where 5,223 calls sit open chain-wide and where Friday's heaviest single-contract volume printed. Heavy call open interest overhead tends to slow rallies as dealers hedge into strength; a clean break through $50.00 leaves remarkably thin positioning until the lottery-ticket strikes far above.
If SOXS drifts between the walls: This is the base case the positioning data describes. Max pain for September 18 sits at $44.00 — fourteen cents below Friday's close — and the estimated dealer gamma regime is positive, which is the configuration where expiring open interest and hedging flows tend to pull price toward the middle rather than away from it. A quiet week ends with the entire $40/$50 corridor intact and both tails expiring worthless.
If SOXS breaks below $40.00: That is the put wall for both the target expiration and the whole chain — 1,585 contracts at that strike for September 18 and 4,839 across all expirations. Below a put wall, the hedging that had been absorbing supply stops helping. Spot is already sitting just under the estimated gamma flip at $45.00, closer to that pivot than is typical for this name, and below the flip one rough estimate suggests market-maker hedging amplifies selling rather than cushioning it. The fresh $38 and $36 put open interest built on Friday is exactly the positioning you would expect ahead of that scenario.
5 · Three defined-risk structures
Prices are end-of-day midpoints as of 2026-09-11. All structures are hypothetical. Verify live prices before trading — these will be stale by the open.
If you expect the range to hold: September 18 iron condor
- Trade: Sell the September 18 $40 put, buy the $38 put, sell the $50 call, buy the $52 call
- Credit: $0.665 ($66.50 per condor) · Max profit: $66.50 · Max loss: $133.50 · Break-evens: $39.34 and $50.67
- Why it fits: Both short strikes are real positioning levels, not arbitrary picks — $40.00 is the put wall for this exact expiration and $50.00 is the chain's heaviest call strike. The premium-over-delivered-movement gap sits at the 70th percentile of this stock's own recent readings, which is the condition that favors collecting premium, and the estimated positive dealer gamma regime is the one that tends to dampen rather than amplify moves. You collect $66.50 against $200 of width on each side, keeping it if SOXS finishes anywhere between the walls.
- Makes sense only if: You accept that the break-evens straddle the implied rails — $39.34 is inside the $38.17 lower rail, so the options market is genuinely pricing a chance of touching it. This is a bet that a 13.5% implied move overstates a four-session drift.
- Invalidated if: SOXS closes below $40.00 or above $50.00
- Managing it: Close at roughly 50% of max credit; exit regardless by the September 17 close rather than carrying gamma risk into expiration day. If either short strike is breached on a closing basis, close that side instead of hoping — with realized volatility running near 100% annualized, a touched strike can travel through the long wing overnight.
- Liquidity note: The $40 puts traded 10¢ wide with 1,220 contracts changing hands; the $50 calls traded 14¢ wide on 2,277 contracts, the busiest line on the board. The $52 calls are the weak leg at 15¢ wide on a $0.375 mid — roughly 40% of mid — so work the whole package as a limit order rather than legging in.
- Analyze this position →
If you lean bullish: September 18 $42/$40 put credit spread
A credit spread pays you up front; you keep the full credit if the stock stays above your short strike, and your loss is capped at the width of the spread minus what you collected.
- Trade: Sell the September 18 $42 put, buy the September 18 $40 put
- Credit: $0.605 ($60.50) · Max profit: $60.50 · Max loss: $139.50 · Break-even: $41.40
- Why it fits: The long leg sits exactly on the put wall, the densest block of downside open interest in the chain. Near-dated sentiment flipped positive on Friday as call open interest built 4,042 contracts in the sub-week bucket, and the put skew that had been stretched 25 vol points above its own norm has been flattening for three straight sessions — put demand is bleeding off.
- Makes sense only if: You think the five-session 14.5% slide is exhausted and the bounce the 3-day chart model describes has legs. Note this fights the 5-day model, which targets $43.20.
- Invalidated if: SOXS closes below $42.00
- Managing it: Take profit at roughly half the credit. Because the short-term direction is fighting a longer trend that is still positive over twenty sessions, take profits early rather than pressing — close by the September 17 session regardless.
- Liquidity note: The $42 puts traded 11¢ wide (7.8% of mid) on 402 contracts; the $40 puts 10¢ wide on 1,220 contracts. Both fill easily.
- Analyze this position →
If you lean bearish: September 18 $46/$48 call credit spread
- Trade: Sell the September 18 $46 call, buy the September 18 $48 call
- Credit: $0.595 ($59.50) · Max profit: $59.50 · Max loss: $140.50 · Break-even: $46.60
- Why it fits: The break-even sits above the 20-day moving average at $46.74 and below the 50-day at $47.52, in the zone where the 5-day chart model places its overhead resistance. Momentum readings are negative across the board — the composite sits at −41 with a three-day average of −49 — driven by a 14.5% five-session decline and put skew still steeper than this name's own norm.
- Makes sense only if: You believe the September 10 spike to the mid-$46s was the ceiling and the 5-day model's $43.20 target is the right map. Selling calls straight into a session where call open interest built by 6,617 contracts is deliberately contrarian.
- Invalidated if: SOXS closes above $46.00
- Managing it: Close at 50% of max credit or on any close above the short strike. Do not hold this through the estimated $45.00 gamma pivot without a plan — a move back above it is the first sign this side is wrong.
- Liquidity note: The $46 calls traded 17¢ wide (10.4% of mid) on 178 contracts; the $48 calls 10¢ wide (9.6%) on 371 contracts with 461 open. Acceptable, but use limits.
- Analyze this position →
If none of these: no trade
There is a serious case for standing aside even though the premium-over-delivered gauge reads rich. That richness is collapsing — it went from about 28 vol points on September 8 to about 8 today as realized movement caught up, and a premium edge that is shrinking by roughly five vol points a session may be gone before four days of theta arrive. Meanwhile IV rank of 21.73/100 says you are selling options that are cheap by this stock's own annual standard, and 20-day realized volatility near 100% annualized with the 5-day-over-20-day ratio above 1.09 says the underlying is moving faster, not slower. On top of that, the strikes that would put a condor safely outside the implied rails trade 30–45% wide, so a meaningful slice of the theoretical credit goes to the spread. If you cannot get filled near the midpoints quoted above, the trade is not the trade — waiting for a session where implied volatility is expanding rather than bleeding is an entirely reasonable call here.
6 · Quick FAQ
What is SOXS's expected move into September 18? About ±$5.97, or ±13.53%, putting the range at $38.17 to $50.11 — that is what the options market's straddle pricing implied as of the September 11 close.
Is SOXS expected to go up or down over the next four days? Options positioning as of September 11 reads genuinely neutral — call flow turned positive in the shortest-dated contracts while put open interest built across the rest of the curve, and the two cancel out — but that is a read of what traders have done, not a forecast. The actionable map is the $38.17–$50.11 range with $40.00 support and $50.00 resistance, and max pain at $44.00.
Are SOXS options expensive right now? Two lenses, two answers. IV rank of 21.73/100 says option prices are lower than about 78% of the past year's readings. On the other hand they are running about 8 vol points above the movement SOXS has actually delivered — richer than about 70% of this stock's own recent readings. Net: modestly favorable for premium sellers, but the edge has shrunk hard over the past three sessions.
Where is SOXS's biggest options support and resistance? The put wall is $40.00 and the practical overhead magnet is $50.00, the chain's heaviest call strike. The September 18 expiration's own call wall sits far out at $80.00, which is a lottery-ticket strike rather than a ceiling.
What invalidates this week's read? A close below $40.00. That is the put wall, and below it the estimated dealer hedging that has been leaning against moves stops helping.
Methodology & disclosures. Data: end-of-day options-chain snapshot for SOXS, 2026-09-11, generated 2026-09-14T01:56:14.893Z. Prices shown are midpoints and will differ from live markets. Momentum/positioning scores and volatility-premium comparisons are descriptive measurements of past option flow and past price movement — not investment advice, signals, forecasts, or guarantees. All trade structures are hypothetical. Every structure shown has a defined maximum loss; you can lose the entire max-loss amount. Options involve substantial risk and are not suitable for all investors.