SOXS Options Are Pricing a $5.00 Move Into September 25 — Our Read Is Flat, the Chart Model Isn't
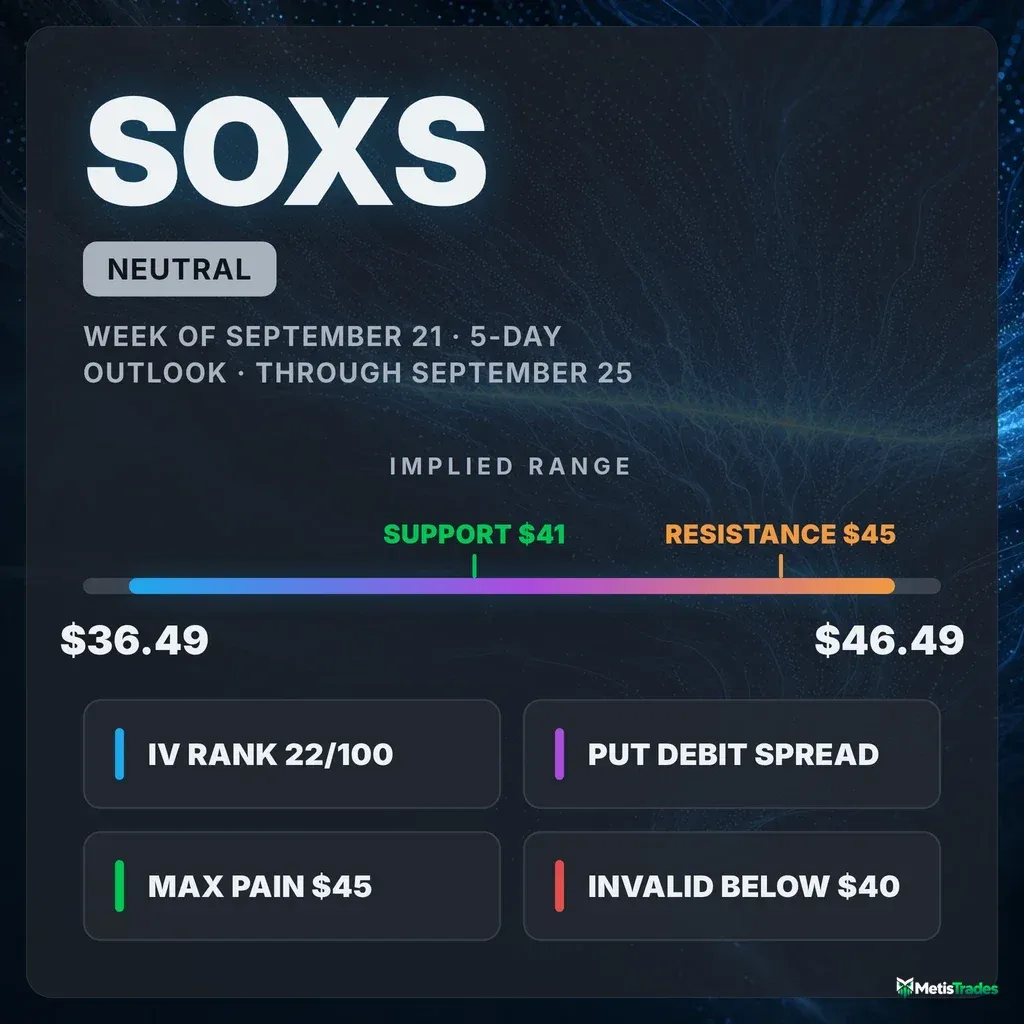
SOXS options imply a $36.49–$46.49 range into the September 25 expiration, with the week's put wall parked right at Friday's close and max pain $3.51 overhead. The options read is genuinely neutral; both technical models are not — here's the map and three defined-risk ways to trade it.
Listen to this analysis — prefer audio? This SOXS outlook is also available as a podcast episode:
The options market implies a $36.49–$46.49 range into the September 25 expiration; here's what's driving it, where the walls sit, and three defined-risk ways to trade it.
Published Sunday, September 20, 2026 · Data as of Friday, September 18 close · Export generated 2026-09-20
Explore the live SOXS options data in the Detailed Options Analyzer →
Quick answer
| Item | Answer |
|---|---|
| Market bias | Neutral |
| Spot (Friday, September 18 close) | $41.49 |
| Options-implied range (into September 25) | $36.49 – $46.49 (±$5.00, ±12.06%) |
| Major support | $41.00 — the September 25 put wall |
| Major resistance | $45.00 — the September 25 call wall |
| Max pain (September 25) | $45.00 |
| Dealer gamma regime (estimate) | September 25's own book reads negative — hedging tends to amplify moves; the whole chain combined reads positive. Flip level ≈ $42 (estimate) |
| Volatility condition | Flat over five sessions, far below its 30-day average — IV rank 22/100 · premium thin: options priced about 2.3 vol points below delivered movement |
| Technical check | Diverges (bearish, 3-day and 5-day models) |
| Best-fitting strategy | Defined-risk debit spreads — the September 25 $41/$38 put spread if you side with the chart, the $42/$45 call spread if you fade it. Premium isn't rich enough to lead with a credit trade |
| Analysis invalidated if | SOXS closes below $40.00 |
1 · What matters today
SOXS closed Friday, September 18 at $41.49 after a 6.0% slide over five sessions. The options market is pricing a move of about $5.00 up or down — a $36.49 to $46.49 range — through the September 25 expiration. That figure comes from what at-the-money straddles cost, and for a triple-leveraged fund a ±12% five-day band is normal, not a warning.
Our read of the positioning is neutral, and it is neutral for an honest reason: the signals disagree. Short-dated flow leans mildly constructive, the medium-dated buckets lean the other way, and price momentum is clearly negative. Meanwhile the biggest pile of open put contracts for September 25 sits at $41.00 — essentially right where the stock closed — while both max pain and the heaviest call strike sit at $45.00 above. The level that changes everything is $40.00: a close below it breaks the corridor and this read goes with it. Both technical models disagree with our flat stance and project lower — that tension is the most interesting thing in this article.
2 · What the options market is pricing
What changed over the past five days
Price did the heavy lifting: SOXS is down 6.0% over five sessions and 10.3% over twenty, with four consecutive down gaps into Friday (−8.76% on September 17 was the largest). Implied volatility barely moved with it — at-the-money IV sits at 108.2%, up 1.07% on the day and up just 0.35% over five sessions, but down 31.6% over thirty days and well under both its 30-day average (123.9%) and its 90-day average (160.2%). Traders paid for the move in direction, not in volatility.
Open interest tells a two-speed story. Across five sessions the put/call open-interest ratio fell from 0.62 to 0.46 — for every 100 call contracts held open there are now 46 puts, against a 14-day average of 0.53, so puts have been thinning relative to calls faster than this fund's own norm. But on Friday itself put open interest grew faster than call (+8,068 versus +6,959), and put volume picked up: the put/call volume ratio printed 0.61 against a 7-day average of 0.50. Total option volume ran 1.97× its 20-day average.
The single most informative non-expired build: the September 25 $41 puts added 865 contracts to 1,049 open on 546 traded — that build is what created the week's put wall, and it landed exactly at the money. (Into the September 18 expiry, now settled, the $48 calls added 1,118 contracts and the $43.50 puts traded 3,122 lots for $625,961 of premium — history, not a live level.)
One tension worth naming: the short- and medium-horizon trend reads are both bearish (price −6.0% over the past week, −10.3% over the past month) while the longest horizon reads bullish. That longest lookback spans a stretch of price history that isn't comparable to today's share price — the feed's 52-week high prints at $17,190 and its 200-day average at $3,300 — so treat only the near and medium reads as meaningful. Near-term flow is mixed; the price trend is not.
Expected move
Into September 25, the options market is pricing ±$5.00 (±12.06%) around $41.49 — a range of $36.49 to $46.49. That is the move implied by straddle pricing, not a forecast.
| Expiration | Implied move | Range around $41.49 |
|---|---|---|
| September 25 (7 DTE) | ±12.06% | $36.49 – $46.49 |
| October 2 (14 DTE) | ±18.74% | $33.72 – $49.27 |
| October 16 (28 DTE) | ±30.63% | $28.78 – $54.20 |
The rungs step up faster than time alone would explain because the near end of the curve is the cheaper end right now: the September 25 expiration's own at-the-money IV reads 87.1%, versus 110.6% out at October 16. If you want optionality, the short-dated contracts are where it costs least.
Volatility
At-the-money IV of 108.2% sounds enormous until you remember what SOXS is. The useful gauge is IV rank: 22/100 means today's IV is cheaper than roughly 78% of the past year's readings, and the 52-week percentile agrees at 30. The 14-day average IV rank is 24.9, so today's reading is near its own recent norm rather than at an extreme. The front-month read is unavailable on this file (September 18 was an expiry day, so the near-tenor interpolation can't be computed) — that is an expiry-day artifact, not a missing term structure. For context, the broad-market volatility index closed the week near the low end of its own 52-week range while showing a 0.66 correlation with this fund's at-the-money IV over the past 60 sessions; the calm is not confined to semiconductors.
One observation against this fund's own history stands out: realized movement is accelerating hard. The five-day realized-volatility pace is running about 1.49× the 20-day pace — an unusually large acceleration for SOXS, well above its recent norm. Ten-day realized volatility sits at 132.7% versus 110.5% over twenty days. The stock is speeding up while its options are not.
Premium: thin, not rich. The volatility risk premium — the gap between how much movement options are priced for and how much SOXS has actually delivered — is running at about −2.3 vol points: option sellers have been collecting slightly less than realized movement has cost them. The percentile is 65/100, meaning today's gap is still richer than about two-thirds of this fund's own recent readings (the gap has spent most of the last month closer to zero or negative, after printing well above +25 vol points in early September). The combination — IV rank 22/100 and a negative premium over delivered movement — favors owning defined-risk premium over collecting it this week. The snapshot reading of that same gap sits about typical versus its norm, so nothing here is stretched; it's simply not a seller's setup.
Skew and sentiment
Skew measures whether puts and calls the same distance from the stock price cost the same. On SOXS the interesting side is the call side, because a rally in this fund is a semiconductor selloff. Today's 25-delta puts price at 104.1% versus 106.1% for the calls — calls carry about 2.0 vol points more, against a 60-day norm of 0.3 points. Put premium has been bleeding off fast: the gap has flattened roughly 6.6 vol points over five sessions. Translation: relative demand has been shifting toward upside-in-SOXS protection (downside-in-semis hedges), while the fear priced into SOXS downside puts has drained.
Across the curve, sentiment splits by maturity. The 0–7 day bucket reads mildly positive (+27, in line with its 7-day average), the 7–30 day bucket reads negative (−27), and the 30–60 day bucket more negative still (−39), while the longest bucket reads positive. The summary phrase our model attaches to that shape is "bullish recovery" — positioning building further out — but the honest reading is that the near and medium books are pulling against each other. That disagreement is exactly why the headline bias lands flat.
The key levels map
| Level | Price | Why it matters |
|---|---|---|
| Whole-chain heaviest call strike | $50.00 | 13,292 call contracts across all expirations — mostly far-dated, a magnet only on a violent rally |
| 20- and 50-day moving averages | $47.90 | Price sits 13.4% below both; overhead resistance, not support |
| Top of implied range (Sept 25) | $46.49 | 1σ upper rail of what options are pricing |
| Call wall + max pain (Sept 25) | $45.00 | 824 call contracts open, the heaviest of the expiration, and the strike where the most option value expires worthless |
| Swing resistance (heuristic) | $44.71 / $43.12 / $42.32 | Recent pivot cluster — descriptive structure, not guaranteed reaction zones |
| Technical resistance | $43.50 | The 5-day chart model's stated invalidation for its bearish case |
| Gamma flip estimate | $42.00 | One rough estimate places the flip here; it is also the single largest gamma-by-strike concentration in the chain |
| Friday's close | $41.49 | Reference price for everything above and below |
| Put wall (Sept 25) | $41.00 | 1,049 put contracts open after Friday's 865-contract build — the week's densest downside shelf |
| Whole-chain put wall | $40.00 | 5,712 put contracts across all expirations (918 of them at Sept 25); also the shelf both technical models name |
| Swing support (heuristic) | $37.50 / $36.89 | Prior pivot cluster |
| Bottom of implied range (Sept 25) | $36.49 | 1σ lower rail |
| 52-week low | $31.70 | Price sits 30.9% above it |
Note the disagreement between scopes: the September 25 expiration's own walls are $41 and $45, while the whole chain combined puts its heaviest call strike at $50 and its heaviest put strike at $40. For the next five days, use the September 25 pair.
Positioning and unusual flow
Dealer gamma — the hedging market makers do against the options they've sold — is an estimate here, built on an assumed sign convention, and the two scopes disagree. Aggregated across all expirations the estimate reads positive (hedging tends to dampen moves); scoped to September 25 alone it reads negative, which means hedging into that expiry tends to amplify moves rather than cushion them. For a five-day view, the amplifying read is the relevant one. Spot also sits about 1.2% below the $42 flip estimate — further below than is typical for this fund — which is the fragile side of that line.
Three non-expired flow items worth the ink:
- September 25 $45 calls: 2,257 contracts traded against 824 open (up 402 on the day), $145,577 of premium at a 5¢-wide quote. The busiest contract of the expiration, parked exactly on the call wall and max pain.
- September 25 $42.50 puts: 702 traded against just 80 open — nearly nine times turnover, and in the 86th percentile versus comparable contracts. Fresh downside positioning just above the money.
- October 16 $44 calls: 927 traded against 173 open for $354,577 — the largest single non-expired dollar print in the file, and it's a month out rather than in the front week.
One curiosity: the September 25 $39.50 calls traded 400 lots against 6 open — a 67× turnover — but the quote is 42.9% wide, so treat it as flow color, not a tradeable level.
3 · Technical check (the 20%)
Both technical reports are dated September 20 against the same $41.49 reference price, so they are fresh and directly comparable. Both read bearish, and both diverge from our flat options bias on direction while landing their targets comfortably inside the options-implied range.
The 3-day model targets $40.60 with a projected range of $39.30 to $42.90, citing an ADX of 27.3 and rising with the negative directional line (45.4) far above the positive one (17.4) — a well-defined, strengthening downtrend — plus a Chaikin Money Flow of −0.110 that indicates sustained distribution. Its dominant scenario invalidates on a reclaim of $43.41. The 5-day model, which lands exactly on our target expiration, targets $40.10 with a projected range of $39.00 to $42.60, support at $40.00 and resistance at $43.50. Both flag an RSI of 27.5 as the counterweight: deeply oversold, which raises the odds of a relief bounce toward $43–$44 before any further leg down.
Model vs. Market: The options market implies $36.49–$46.49 into September 25; the 5-day technical model targets $40.10 inside a far tighter $39.00–$42.60. The chart is making a much more specific claim than the options are — the options are simply pricing a big, direction-agnostic move. A close below $40.00 resolves the question in the chart's favor; a reclaim of $43.50 resolves it against.
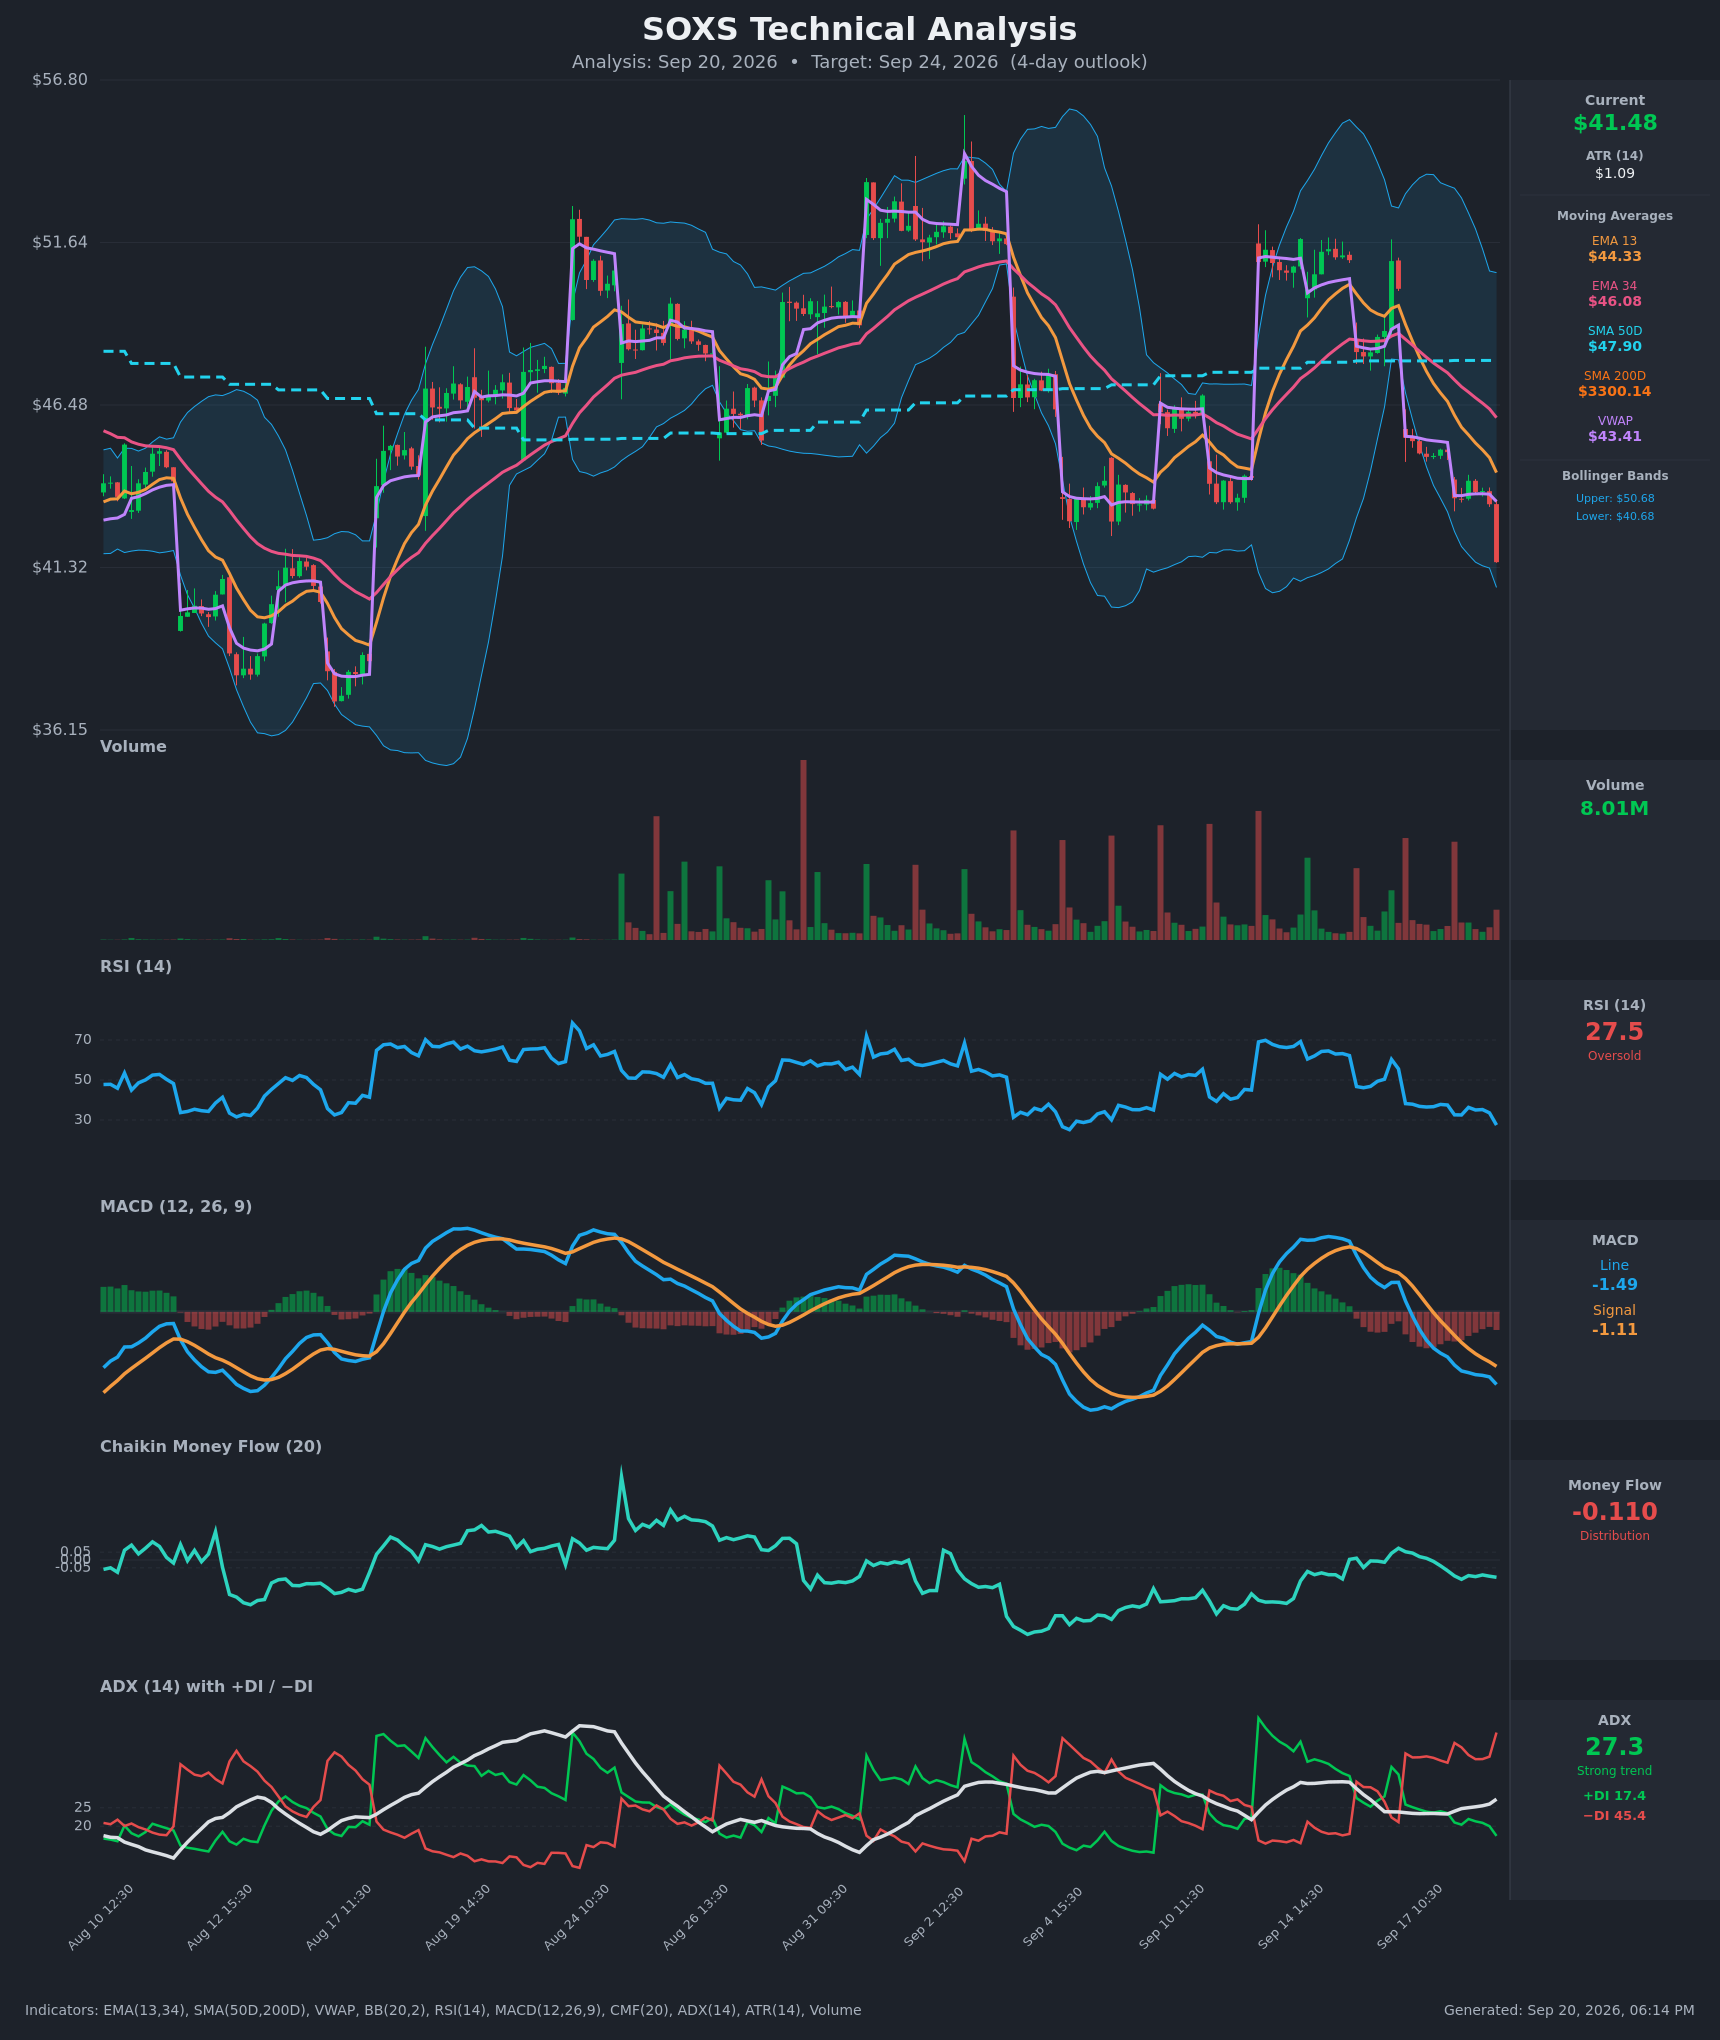
How the technicals shaped the strikes below: they did not move the bias, but they did anchor the short strike of the bearish structure near the $38 area both models point at, and they argue for shorter-dated expressions and earlier profit-taking rather than holding through the full week — a short-term direction fighting an unreliable longer-term read deserves a tighter leash.
Full technical write-ups: 3-day report → · 5-day report →
4 · Three ways the next five days can go
If SOXS pushes above the call wall ($45.00): That strike carries the heaviest call open interest of the expiration and is also where max pain sits, so it tends to act as a brake — rallies into dense call open interest usually slow. A clean break through it leaves noticeably thinner positioning until the top of the implied range at $46.49, and then nothing substantial until the whole-chain $50 call strike. Getting there requires a 8.5% move in five days, which is inside what the options are pricing.
If SOXS drifts between the walls ($41.00–$45.00): This is the max-pain case, with $45.00 the gravitational point for expiring open interest. Two caveats keep it from being a high-conviction pin story: the September 25 book's own dealer-gamma estimate reads negative, meaning hedging into that expiry tends to amplify rather than dampen, and realized movement has been accelerating well above this fund's own recent pace. A pin argument is weaker than usual this week.
If SOXS breaks below the put wall ($41.00): This is the acceleration case, and it is where the technical models live. Spot already sits about 1.2% below the $42 gamma flip estimate — below that line, one rough estimate suggests market-maker hedging amplifies selling rather than cushioning it. The next shelf is $40.00, where the chain's heaviest put open interest sits (5,712 contracts across all expirations, 918 of them at September 25), and below that the implied-range floor at $36.49 with swing support at $37.50.
5 · Three defined-risk structures
Prices are end-of-day midpoints as of 2026-09-18. All structures are hypothetical. Verify live prices before trading — these will be stale by the open.
Because the premium in these options is running below what SOXS has actually been delivering, the debit structures lead and the credit structure carries a health warning.
If you lean bearish: September 25 $41/$38 put debit spread
- Trade: Buy the September 25 $41 put, sell the September 25 $38 put. You pay a debit up front and are betting SOXS is lower by expiration; your maximum loss is the debit.
- Debit: $1.16 · Max profit: $1.84 (at or below $38.00) · Max loss: $1.16 · Break-even: $39.84
- Why it fits: The long strike is the week's put wall and the tightest-quoted contract in the expiration; the short strike sits just inside the implied-range floor and near the $37.50 swing-support cluster both models point toward. With premium priced below delivered movement and IV rank at 22/100, you are buying the cheaper side of the trade, not the expensive one.
- Makes sense only if: you want exposure to the technical thesis. The headline options bias is flat — this is the chart's trade, not the flow's.
- Invalidated if: SOXS closes above $43.50.
- Managing it: take profit at roughly 60–70% of the spread's width if $40.00 breaks early; close by September 23 if price is still hovering above $41.00, because the last two sessions are where the remaining time value drains fastest. Don't carry a loser into expiration hoping for a gap.
- Liquidity note: the $41 puts quoted $1.85/$1.90 — 5¢ wide on a $1.875 mid, with 546 contracts traded. The $38 puts are the weak leg at $0.60/$0.84, 24¢ wide on a $0.72 mid, though 686 contracts changed hands; work the order rather than crossing the spread.
- Analyze this position →
If you lean bullish: September 25 $42/$45 call debit spread
- Trade: Buy the September 25 $42 call, sell the September 25 $45 call. You pay a debit and profit if SOXS rallies toward the call wall.
- Debit: $0.97 · Max profit: $2.03 (at or above $45.00) · Max loss: $0.97 · Break-even: $42.97
- Why it fits: The short strike is pinned exactly on the call wall and max pain — the level rallies have the hardest time clearing — so you are selling the strike the positioning says is expensive to exceed. The 0–7 day sentiment bucket is the one constructive corner of the curve, and the long strike sits right at the gamma flip estimate. RSI at 27.5 gives the oversold-bounce case a real footing.
- Makes sense only if: you think the four-session slide is exhausted and the relief bounce toward $43–$44 that both technical reports assign a 35% weight actually extends.
- Invalidated if: SOXS closes below $40.00.
- Managing it: this is fighting the prevailing price trend, so take profit early — half the spread's width is a good exit — and cut it by September 23 if $42.97 hasn't been reclaimed.
- Liquidity note: the $45 calls are the most liquid contract on the board at $0.62/$0.67 (5¢ wide, 2,257 traded). The $42 calls quoted $1.55/$1.67, 12¢ wide on a $1.61 mid.
- Analyze this position →
If you expect the range to hold: September 25 $36/$38/$45/$47 iron condor
- Trade: Sell the $38 put / buy the $36 put, sell the $45 call / buy the $47 call, all September 25. You collect a credit up front and keep it if SOXS finishes between the short strikes.
- Credit: $0.83 · Max profit: $0.83 · Max loss: $1.17 · Break-evens: $37.17 and $45.83
- Why it fits: The short strikes are the two levels the positioning actually defends — the call wall above and the swing-support/implied-floor zone below — and both carry roughly 22–25 delta, the standard band for this structure.
- Health warning: you're selling premium that hasn't been rich lately. The options are priced about 2.3 vol points below what SOXS has delivered over twenty sessions, and both short strikes sit inside the options market's own ±$5.00 expected move. You are betting the fund slows down at precisely the moment its five-day realized pace is running about 1.49× its 20-day pace. That is a real bet, not free money.
- Makes sense only if: you expect the four-gap sequence to end in chop and you are sized for the full $1.17 loss.
- Invalidated if: SOXS closes outside $37.17–$45.83, or below $40.00 on heavy volume before that.
- Managing it: close at roughly 50% of max credit; exit regardless by September 23. If either short strike is breached on a close, close the tested side rather than hoping — the September 25 dealer-gamma estimate reads negative, which is the regime where moves extend rather than mean-revert.
- Liquidity note: the body is fine ($38 puts $0.60/$0.84 on 686 lots; $45 calls 5¢ wide on 2,257 lots), but the wings are poor — the $36 puts quote $0.18/$0.40 and the $47 calls $0.08/$0.41. Expect to receive meaningfully less than the $0.83 mid credit.
- Analyze this position →
If none of these: no trade
Standing aside is a defensible call this week, and here's the honest case for it. The directional inputs genuinely disagree — that is why the bias is flat rather than tilted — so both directional spreads are expressions of a view the data does not hand you. The range trade has the opposite problem: it needs quiet, and this fund's realized movement is accelerating while the premium you'd collect for absorbing that movement is running below what the movement has actually cost. Add wing quotes 22¢ and 33¢ wide on sub-$0.50 contracts and the slippage alone eats a meaningful slice of the edge. If you have no strong view on whether $40.00 holds, waiting for the resolution — a close below $40.00, or a reclaim of $43.50 — costs you nothing but a few days of theta you never paid for.
6 · Quick FAQ
What is SOXS's expected move into September 25? About ±$5.00, or ±12.06%, giving a $36.49–$46.49 range around the $41.49 close — that's what at-the-money straddle pricing implied as of September 18.
Is SOXS expected to go up or down over the next five days? Options positioning as of September 18 reads neutral — short-dated flow leans mildly constructive while the medium-dated books lean the other way and price momentum is clearly negative — but that's a read of what traders have done, not a forecast. The actionable map is the $36.49–$46.49 range and the $41.00 / $45.00 levels. Both technical models disagree and project toward $40.10–$40.60.
Are SOXS options expensive right now? Two lenses, same answer. IV rank 22/100 says option prices are lower than about 78% of the past year's readings; on top of that they're running roughly 2.3 vol points below the movement SOXS has actually delivered over twenty sessions — though that gap is still narrower than about two-thirds of this fund's own recent readings. Net: premium is thin, which favors owning defined-risk options over selling them.
Where is SOXS's biggest options support and resistance? For the September 25 expiration, the put wall is $41.00 (1,049 contracts) and the call wall is $45.00 (824 contracts), which is also where max pain sits. Across the whole chain combined, the heaviest strikes are $40.00 on the put side and $50.00 on the call side.
What invalidates this week's read? A close below $40.00.
Methodology & disclosures. Data: end-of-day options-chain snapshot for SOXS, 2026-09-18, generated 2026-09-20T18:14:22Z. Prices shown are midpoints and will differ from live markets. Momentum/positioning scores and volatility-premium comparisons are descriptive measurements of past option flow and past price movement — not investment advice, signals, forecasts, or guarantees. All trade structures are hypothetical. Every structure shown has a defined maximum loss; you can lose the entire max-loss amount. Options involve substantial risk and are not suitable for all investors.