SPY Options Are Pricing a $13 Move Through Friday — The Chart Models See $760
The options market implies SPY trades between $751.07 and $777.51 into the September 18 expiration, with max pain sitting almost exactly at spot. Here's why our positioning read lands on neutral, where the walls are, and three defined-risk ways to trade the range.

The options market implies a $751.07–$777.51 range into the September 18 expiration; here's what's driving it and three defined-risk ways to trade it.
Published Sunday, September 13, 2026 · Data as of the September 11, 2026 close · Export generated September 13, 2026
Explore the live SPY options data in the Detailed Options Analyzer →
Quick answer
Item | Answer |
|---|---|
Market bias | Neutral |
Options-implied range (into Sep 18) | $751.07 – $777.51 (±1.73%, or ±$13.22) |
Major support | $760.00 (Sep 18 put wall) |
Major resistance | $775.00 (Sep 18 call wall) |
Max pain (Sep 18) | $765.00 |
Dealer gamma regime (estimate) | Negative for the Sep 18 expiration — in this regime market-maker hedging tends to amplify moves rather than cushion them; no flip level could be computed from today's chain |
Volatility condition | Falling — IV rank 10/100 · premium mildly rich: options priced about 3.9 vol points above delivered movement |
Technical check | Mixed (bearish, 3-day and 5-day chart models — targets inside the implied range) |
Best-fitting strategy | Iron condor: Sep 18 $752/$755 put spread + $775/$777 call spread |
Analysis invalidated if | SPY closes below $760.00 |
1 · What matters today
SPY closed at $764.29 on Friday, and the options market is pricing a move of roughly $13 in either direction through Friday, September 18 — that's the expected move, derived from what straddles cost at that expiration. That puts the working band at $751.07 to $777.51. Inside that band, the positioning is remarkably balanced: the biggest pile of open put contracts sits at $760, the biggest pile of calls at $775, and max pain — the price where the most option value would expire worthless — is $765, within a dollar of where the ETF actually closed. Our five-input read of flow, skew and positioning lands flat at neutral, with no tilt. Two chart models lean bearish toward $760.50–$760.80, but both targets sit comfortably inside the options-implied range. The level that changes everything is $760: a close below it breaks the range case.
2 · What the options market is pricing
What changed this week
The last five sessions took SPY down 1.15%, and over 20 sessions it's down 1.74% — a slow bleed, not a break. The hedging showed up in open interest first: put open interest relative to call open interest went from 0.68 to 1.13 over five sessions, a 66% jump. In plain terms, for every 100 calls held open there are now 113 puts, where a week earlier there were 68. Today's 1.13 reading actually sits slightly below the 7-day average of 1.17, so the panic-buying of protection has already cooled off a notch.
Volatility told the same story in reverse. The market's estimate of how much SPY will move — implied volatility baked into option prices — is up 6.9% over five sessions but fell 13.0% on Friday alone, as the September 10 flush ($757.61 low on the chart models' data) was bought back. Total option volume ran at 0.96× its 20-day average, so this wasn't an unusual-activity day; it was a repricing day.
The single biggest change in open contracts among still-live strikes was the September 18 $760 put, which shed 19,804 contracts of open interest to 90,360 — traders closing downside protection into the bounce, right at the strike that defines this week's support. Further out, real new money went into November $730 and $745 puts (+18,410 and +17,091 contracts), but that's positioning well beyond this article's horizon.
One more piece of context: the short-, medium- and long-horizon trend reads all come back flat — price is −1.1% over the past week, −1.7% over the past month, and +2.5% over roughly two and a half months, with momentum averaging near zero across all three. There's no divergence between the near-term flow and the bigger trend to exploit here; they simply agree that nothing is trending. A momentum crossover on September 4 did flip the near-term read from bullish to bearish, and it was a hair's-breadth crossing — worth knowing, not worth building a thesis on.
Expected move
Into the September 18 expiration, the options market is pricing a 1σ move of ±1.73%, or about ±$13.22 around the $764.29 close — a band of $751.07 to $777.51. Here's how that scales across the nearby expirations:
Expiration | Implied move | Range around $764.29 |
|---|---|---|
Mon, Sep 14 (3 DTE) | ±0.65% | $759.32 – $769.26 |
Fri, Sep 18 (7 DTE) | ±1.73% | $751.07 – $777.51 |
Fri, Sep 25 (14 DTE) | ±2.30% | $746.71 – $781.87 |
Fri, Oct 9 (28 DTE) | ±3.47% | $737.77 – $790.81 |
The step from Monday's ±0.65% to Friday's ±1.73% is steeper than calendar time alone explains — the chain is pricing more event risk in the back half of this week than in the first two sessions. Beyond that, the ladder scales smoothly, with no hump anywhere in the term structure.
Volatility
At-the-money implied volatility sits at 12.59%, with an IV rank of 10/100 — meaning option prices are cheaper than roughly 90% of the past year's readings. The 52-week percentile agrees at 11. Current IV is below both its 30-day average (12.82%) and its 90-day average (14.12%), and it's down 13.4% over the past 30 sessions. The front-month read is unavailable today — Friday's chain had a same-day expiration, which makes the front-month interpolation impossible — so there's no clean term-structure slope to quote.
Realized movement is even quieter than the implied number: SPY's 20-day realized volatility is 8.74%, a reading that is unusually depressed compared against this ETF's own recent history. The 5-day-versus-20-day realized ratio is 1.11, so movement has picked up modestly in the last week without changing the bigger picture of a very calm tape. The VIX overlay says the same thing from the other side: it closed at 15.84 and sits in the bottom 13% of its own 52-week range, and over the past 60 observations it has tracked SPY's ATM IV almost perfectly (0.97 correlation).
Premium rich or cheap? The volatility risk premium — the gap between how much movement options are priced for and how much SPY has actually delivered — is +3.9 vol points, and it sits at the 68th percentile of this ETF's own recent readings, meaning today's gap is richer than about two-thirds of them. The one-clause color from our snapshot readings agrees: the implied-versus-delivered gap is running well above its own norm. So sellers of premium have been collecting more than realized movement has cost them. But note the tension: an IV rank of 10 and a 68th-percentile premium mean options are relatively rich and absolutely cheap. You are getting paid a fair edge on a small number. The path matters too — the premium ran from +4.5 to +5.9 vol points between Tuesday and Thursday and then collapsed back to +3.9 on Friday's IV drop, so the richest part of this week's premium has already been sold out of the market.
Skew and sentiment
Puts and calls the same distance from the stock price don't cost the same, and right now the gap is wide: 25-delta puts are marked at 15.21% implied volatility against 10.20% for the equivalent calls — a 5.0 vol-point spread against a 60-day median of 4.0 for this name. Traders are paying about one vol point more than usual for crash protection. That reading is a full standard deviation steeper than its own norm, and the steepening happened fast: it added 1.6 vol points over five sessions.
Volume flow leans the same way but more mildly. Put volume ran at 1.19× call volume, against a 7-day average of 1.14 and a 14-day average of 1.09 — put-heavy, but only modestly so. Pulling the other direction, net new open interest turned decisively call-side on Friday (+228,943 call contracts against −270,985 put contracts), a reading that is unusually call-tilted by this ETF's own standards.
Sentiment across expiration buckets is genuinely mixed — the file's own one-word summary. The 0–7-day bucket scores +9 (mildly call-leaning), the 7–30-day bucket −23 (put-leaning), and the 60–120-day bucket −33. Short-dated flow is comfortable; anything past next week is buying protection. That split is exactly why the composite bias lands at zero rather than picking a side.
The key levels map
Level | Price | Why it matters |
|---|---|---|
52-week high | $779.37 | 1.93% above the close; the ceiling of the past year |
Swing resistance (price structure) | $776.39 | Nearest heuristic pivot cluster above spot — an estimate, not a guaranteed reaction zone |
Call wall — Sep 18 | $775.00 | 47,090 calls held open at this strike; the whole chain's heaviest call strike sits here too (119,250), so the two agree |
Heavy call OI / large-gamma strike | $770.00 | 24,125 Sep 18 calls; chain-wide, the second-largest call pile (103,309) |
Chart-model resistance (3-day) | $768.03 | Upper Bollinger band the near-term technical read names as the level to clear |
20-day moving average | $766.88 | Price closed 0.34% below it |
Max pain — Sep 18 | $765.00 | Where the most option value expires worthless; also one of the chain's biggest gamma strikes |
Spot / last close | $764.29 | Effectively pinned at max pain |
Put wall — Sep 18 | $760.00 | 90,360 puts held open; also the whole chain's put wall (201,889) and its single largest gamma strike |
50-day moving average | $758.62 | 0.75% below the close; the 3-day model's stated support |
Swing support | $757.76 | Nearest pivot cluster below spot (estimate) |
Heavy put OI shelf | $755.00 | 164,535 puts across the chain — the next shelf under the wall |
Lower edge of the implied range | $751.07 | 1σ downside through Sep 18 |
Deeper swing support | $746.78 | Structure below the implied range (estimate) |
Positioning and unusual flow
The dealer gamma estimate for the September 18 expiration comes back negative — under the standard sign assumption, that's the regime where market-maker hedging tends to amplify moves rather than dampen them. The aggregate read across all expirations is negative too, so there's no disagreement to flag. The file couldn't compute a flip level from today's chain, so there's no single price to name; what the snapshot readings do show is that spot sits unusually far on the fragile side of that estimated pivot by this ETF's own recent standards. Treat all of that as an estimate built on an assumed convention, not as observed dealer inventory.
On the flow side, the money is concentrated exactly where the walls are. The September 18 $760 put alone traded $17.8 million of premium on Friday — the heaviest dollar flow of any live contract — with the $765 put at $14.8 million and the $765 call at $7.2 million right behind it. Further out the curve, short-dated churn dominated: the September 14 $766 put traded 56,456 contracts against just 119 held open (a 474× turnover), and the $764 put 89,305 against 209. That's day-trading the pin, not a positioning statement.
3 · Technical check
Both chart models lean bearish. The 3-day read (target date September 16) projects $760.80 with a model range of $751.50 to $774.00, citing −DI above +DI with ADX at 30.2 — a trending tape where sellers hold the edge — and a Chaikin Money Flow reading of −0.096 that shows money leaving during last week's bounce. The 5-day read (target date September 18) projects $760.50 with a model range of $749.00 to $779.00 and the same core evidence: a bounce off the September 10 low that faded without volume or money-flow confirmation.
Classify that as Mixed rather than a clean divergence. The direction contradicts our neutral positioning bias, but both targets sit inside the options-implied band, and both models' own dominant scenario is a retest of $756–$759 rather than a breakdown — with each explicitly invalidating on a close above $768.00–$768.50. In other words, the chart models and the options chain disagree about the tilt but agree almost exactly on the boundaries. Both also describe the multi-week structure as a $755–$781 rectangle, which is the same picture the $760/$775 wall corridor draws.
Model vs. Market: The options market implies $751.07–$777.51 into September 18; the 5-day technical model targets $760.50. That gap is directional, not structural — the chart read is picking the lower half of a range the options market has already fenced off, so the question this week is which half of the corridor gets used, not whether the corridor holds.
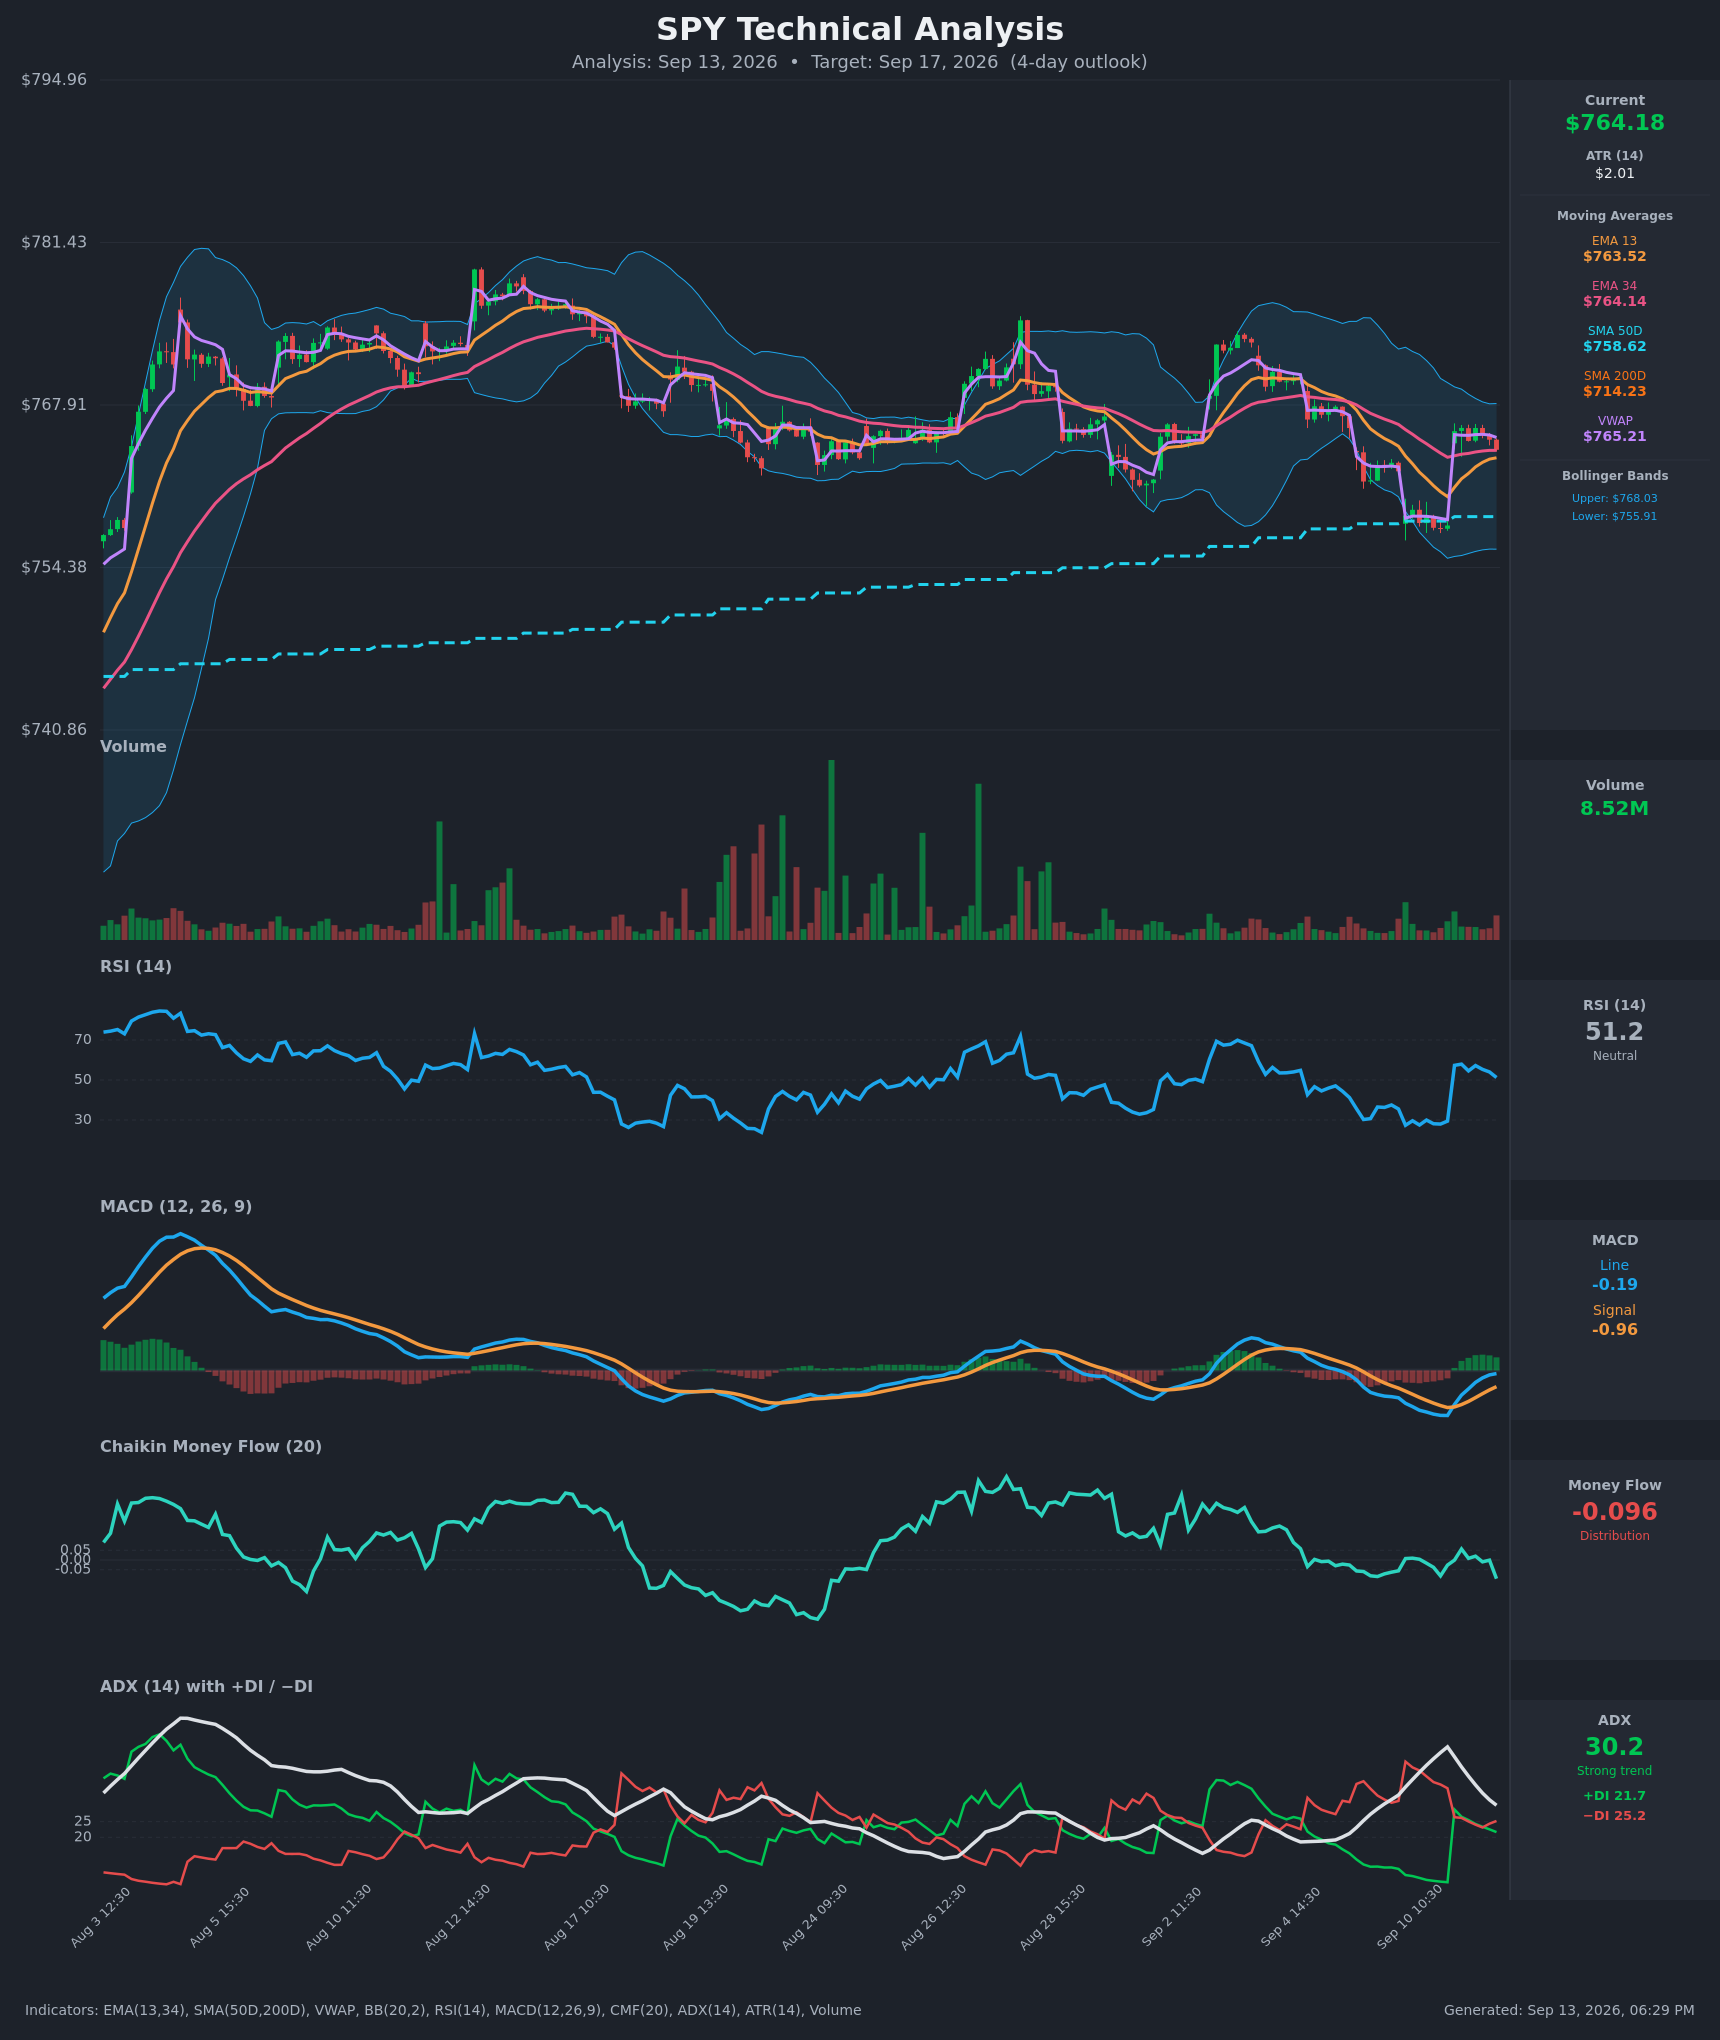
How that adjusted the trades below: it shaded the bullish structure's short strike to $755 — beneath both the put wall and the $760.00–$758 zone both models name as their downside target — rather than the $760.50 strike a purely options-driven read would have picked.
Full technical write-ups: 3-day report → · 5-day report →
4 · Three ways the next five days can go
If SPY pushes above the call wall ($775): that strike holds 47,090 open calls for Friday and is the heaviest call strike in the entire chain. Heavy overhead call open interest tends to slow rallies as it's hedged into, and $775 also happens to sit within a dollar of the top of the implied range. A clean break through leaves comparatively thin positioning until the $776.39 swing pivot and the $779.37 52-week high.
If SPY drifts between the walls: this is the base case the chain is built around. Max pain for Friday is $765 and spot closed at $764.29 — the ETF is already sitting on the pin. With max-pain and the largest gamma strikes clustered at $760, $765 and $770, expiring open interest tends to exert a gravitational pull into the settlement, and the $759–$769 band implied for Monday's expiration is a tighter version of the same map.
If SPY breaks below the put wall ($760): this is the acceleration branch. $760 carries 90,360 puts for Friday and is the single largest gamma strike in the chain; below it, the estimated dealer gamma regime for this expiration is negative, which one rough estimate suggests means hedging flows amplify selling rather than cushioning it. Spot already sits unusually far on the fragile side of that estimated pivot for this name. The next shelves are the 50-day average at $758.62, the $757.76 swing pivot, the $755 put shelf, and then the bottom of the implied range at $751.07 — which is also, not coincidentally, where both chart models' ranges bottom out.
5 · Three defined-risk structures
Prices are end-of-day midpoints as of the September 11 close. All structures are hypothetical. Verify live prices before trading — these will be stale by the open.
If you expect the range to hold: iron condor (the best fit this week)
Trade: Sell the Sep 18 $755/$752 put spread and the Sep 18 $775/$777 call spread (four legs, one condor)
Credit: ~$0.86 · Max profit: $86 · Max loss: $214 on the put side ($115 on the call side) · Break-evens: $754.15 and $775.86
Why it fits: A credit spread pays you upfront to be right about where price won't go. Both short strikes are anchored to real structure — $775 is the expiration's own call wall and $755 the put shelf beneath the $760 wall — and the neutral composite plus a $765 max pain sitting on top of spot is the textbook case for selling both tails. The 68th-percentile volatility premium means you're being paid a bit more than delivered movement has cost lately.
Makes sense only if: you believe the $760–$775 corridor contains the next five sessions, and you're comfortable collecting a small dollar credit in a low-IV-rank tape.
Invalidated if: SPY closes below $760.00 or above $775.00 — either wall breaking takes the thesis with it.
Managing it: close at roughly 50% of max credit; with only five sessions of life, take the money early rather than holding into Friday morning's gamma. If either short strike is touched, close that side rather than hoping — the estimated negative gamma regime for this expiration argues against letting a breach run.
Liquidity note: the $755 puts traded 4¢ wide, the $752 puts 3¢, and both the $775 and $777 calls 2¢. Fills should be easy on all four legs.
If you lean bullish: short put spread
Trade: Sell the Sep 18 $755/$752 put credit spread
Credit: ~$0.55 · Max profit: $55 · Max loss: $245 · Break-even: $754.45
Why it fits: You collect the credit and win if SPY simply stays above $755 through Friday. The short strike sits $5 below the $760 put wall and below the $760.00–$758 zone both chart models flag as their downside target — a deliberate concession to the bearish technical read. Put skew is running a vol point richer than its own norm, so the put side is the expensive side to sell.
Makes sense only if: you think last week's flush was the low and the $760 wall does its job.
Invalidated if: SPY closes below $757.76, the nearest swing support — at that point the short strike is live and the negative-gamma branch is in play.
Managing it: take 50% of max credit and leave; given a short-term momentum read that turned lower on September 4 against an otherwise flat longer trend, this is a structure to harvest early rather than ride to expiration.
Liquidity note: $755 puts 4¢ wide, $752 puts 3¢ wide — under 2% of mid on both legs.
If you lean bearish: short call spread
Trade: Sell the Sep 18 $770/$775 call credit spread
Credit: ~$1.32 · Max profit: $132 · Max loss: $368 · Break-even: $771.32
Why it fits: This is the structure that expresses both chart models' bearish lean without needing them to be right about direction — it only needs SPY to stay below $770 through Friday. The short strike sits at the second-heaviest call pile for this expiration and the long leg is bought right at the call wall, so the whole spread lives inside the zone where overhead call open interest tends to slow rallies. The 0–7-day sentiment bucket is mildly call-leaning, which is the honest argument against it.
Makes sense only if: you read the failed retest of the $765–$768 zone as distribution rather than consolidation.
Invalidated if: SPY closes above $775.00 — through the call wall, the positioning map thins out fast.
Managing it: close at ~50% of max credit, or on any close above $768.03 (the level both chart models use as their own bearish invalidation), whichever comes first.
Liquidity note: the $770 calls traded 2¢ wide and the $775 calls 2¢ wide — under 1% and 2.5% of mid respectively.
If none of these: no trade
There's a serious case for standing aside, and it's the absolute level of premium. An IV rank of 10/100 means you are selling the cheapest options this ETF has offered in roughly a year; the 68th-percentile volatility premium says the relative edge is real, but 68th percentile of a very small number is still a very small number. The condor above collects $86 to risk $214 across five sessions, and the estimated negative gamma regime for this expiration is exactly the condition under which a breach of either wall doesn't stop politely at the long strike. If your edge in premium selling comes from elevated volatility rather than from structure, this is a week to wait for IV rank to climb off the floor — a flat composite bias and a chart read pointing the other way is not a combination worth paying slippage to express.
6 · Quick FAQ
What is SPY's expected move this week? ±$13.22, or ±1.73%, into the September 18 expiration — a $751.07 to $777.51 band around the $764.29 close, per the options market's straddle pricing as of September 11.
Is SPY expected to go up or down over the next five days? Options positioning as of September 11 reads genuinely neutral — short-dated sentiment leans slightly call-side while the 7–30-day bucket leans put-side, and the five-input composite lands at zero. That's a read of what traders have done, not a forecast. The actionable map is the $751.07–$777.51 range and the $760/$775 levels.
Are SPY options expensive right now? IV rank of 10/100 says option prices are lower than 90% of the past year's readings; on top of that, they're running about 3.9 vol points above the movement SPY has actually delivered, which is richer than about 68% of this ETF's own recent readings. So: relatively rich, absolutely cheap — a fair edge for sellers on a small premium base.
Where is SPY's biggest options support and resistance? For the September 18 expiration, the put wall is $760.00 (90,360 contracts held open) and the call wall is $775.00 (47,090 contracts). The whole chain's heaviest strikes land in the same two places.
What invalidates this week's read? A close below $760.00. Below the put wall, the estimated dealer gamma regime for this expiration turns the hedging flow from cushioning into amplifying, and the range thesis stops being the base case.
Methodology & disclosures. Data: end-of-day options-chain snapshot for SPY, 2026-09-11, generated 2026-09-13T18:29:01Z. Prices shown are midpoints and will differ from live markets. Momentum/positioning scores and volatility-premium comparisons are descriptive measurements of past option flow and past price movement — not investment advice, signals, forecasts, or guarantees. All trade structures are hypothetical. Every structure shown has a defined maximum loss; you can lose the entire max-loss amount. Options involve substantial risk and are not suitable for all investors.