SPY Options Price a ±$10.82 Move Into September 25 — But the Walls Are Only $12 Apart
The options market implies a $750.87–$772.51 range for SPY into the September 25 expiration, with the heaviest call and put open interest boxed into a narrow $760–$772 corridor. Here's what the positioning says and three defined-risk ways to trade it.
Listen to this analysis — prefer audio? This SPY outlook is also available as a podcast episode:
The options market implies a $750.87–$772.51 range into the September 25 expiration; here's what's driving it and three defined-risk ways to trade it.
Published Sunday, September 20, 2026 · Data as of Friday, September 18, 2026 close
Explore the live SPY options data in the Detailed Options Analyzer →
Quick answer
| Item | Answer |
|---|---|
| Market bias | Neutral with a bullish tilt |
| Spot (September 18 close) | $761.69 |
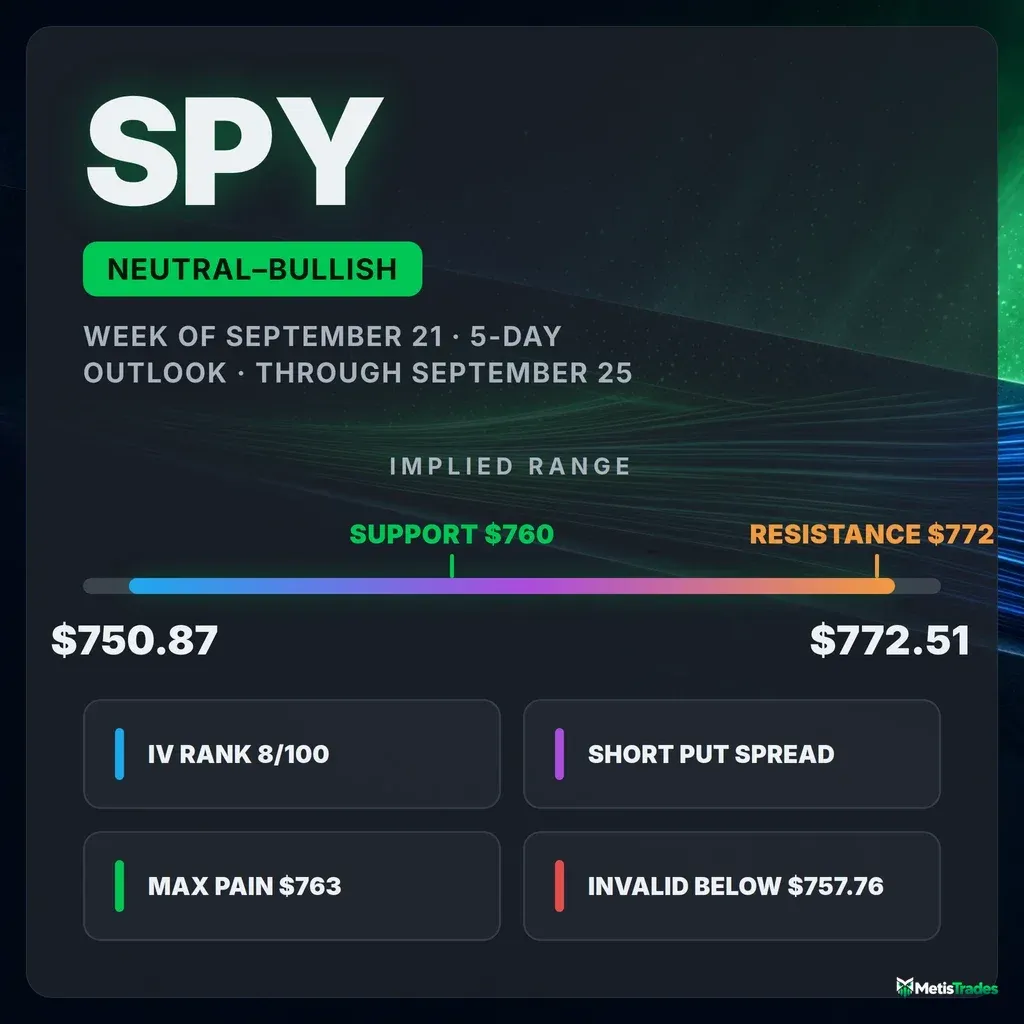
| Options-implied range (into September 25) | $750.87 – $772.51 (±1.42%, or ±$10.82) |
| Major support | $760.00 (put wall, September 25 expiration) |
| Major resistance | $772.00 (call wall, September 25 expiration) |
| Max pain (September 25) | $763.00 |
| Dealer gamma regime (estimate) | Negative — hedging tends to amplify moves; flip level ≈ $746 |
| Volatility condition | Falling — IV rank 8.45/100 · premium fair: options priced about 3.2 vol points above delivered movement |
| Technical check | Confirms (bullish, 3-day and 5-day chart models, target $765.50) |
| Best-fitting strategy | Short put spread below the put wall, September 25 expiration |
| Analysis invalidated if | SPY closes below $757.76 |
1 · What matters today
SPY closed at $761.69 on Friday, September 18, and the options market is pricing a move of about $10.82 up or down — roughly 1.42% — through the September 25 expiration. That's a $750.87–$772.51 band. The more useful number is tighter: for that expiration, the biggest pile of open put contracts sits at $760 and the biggest pile of calls sits at $772, so the week's heaviest positioning is boxed into a $12-wide corridor around spot, with the price where the most option value would expire worthless ("max pain") at $763 — barely above Friday's close.
The lean is mildly constructive, not a call for a breakout: short-dated sentiment flipped from put-heavy to call-heavy over the last two sessions, and puts are cheaper relative to calls than usual for this name. The chart models agree, targeting $765.50. A close below $757.76 breaks the read.
2 · What the options market is pricing
What changed this week
The most striking shift is in the crowd's hedging book. Put open interest relative to call open interest — how many put contracts are held open for every call — finished at 1.18, against a 7-day average of 1.48 and a reading as high as 1.93 on September 16. Traders spent the first half of September stacking downside protection and have now let a large slice of it expire or unwind. Put/call volume told the same story on the day: 1.03 versus a 14-day average of 1.11, meaning Friday's flow was less put-tilted than the recent norm.
Implied volatility — the market's estimate of how much SPY will move, baked into option prices — kept bleeding out, down 2.1% over five sessions and 5.4% over thirty, to 12.33%. The underlying itself barely moved: −0.34% over five trading days and −0.12% over twenty. Total option volume ran at 0.98× its 20-day average, so this was a normal-sized session, not a scramble.
The single biggest build in live (non-expired) contracts was in the September 21 $770 calls, where open interest jumped 28,265 to 31,504 on 58,171 contracts traded. Right behind it: the September 25 $772 calls added 24,079 contracts to reach 26,482 — that build is the week's call wall, constructed in a single session. Into Friday's expiry, by contrast, the settled $750 calls shed 34,338 contracts of open interest; that's history, not a live level.
The short-, medium- and long-term trend reads all print neutral and agree with each other — price is +1.3% over roughly two months, −0.1% over one month, −0.3% over the past week. There's no trend tension to resolve here; this is a market marking time.
Expected move
The expected move is the move the options market is pricing in, derived from what straddles cost. Into the September 25 expiration, that's ±1.42% of spot, or about $10.82 in either direction — a $750.87 to $772.51 band.
| Expiration | Implied move | Range around $761.69 |
|---|---|---|
| September 21 (3 DTE) | ±0.62% | $756.97 – $766.41 |
| September 23 (5 DTE) | ±1.07% | $753.54 – $769.84 |
| September 25 (7 DTE) | ±1.42% | $750.87 – $772.51 |
| October 2 (14 DTE) | ±2.18% | $745.08 – $778.30 |
The ladder scales smoothly with time — no step-up, no kink, no hump anywhere in it. That's what a calendar with no scheduled shock looks like from the inside of the option chain.
Volatility
At-the-money implied volatility is 12.33%, with an IV rank of 8.45/100 — meaning option prices are cheaper than roughly 92% of the past year's readings. The percentile read is even more extreme at 7/100. Current IV sits below both its 30-day average (12.77%) and its 90-day average (14.03%), and it has fallen on every timeframe: −1.3% on the day, −2.1% over five sessions, −5.4% over thirty. The front-month read is unavailable today — Friday was an expiration day, which makes that particular tenor uncomputable, not missing.
For context on the index side, VIX closed at 14.81 with a 52-week rank of 7.6/100, and it has tracked SPY's own ATM IV with a 0.96 correlation over the past 60 observations — the two are telling one story, and the story is calm.
Two "vs its own norm" readings sharpen that. SPY's 20-day realized volatility — how much it has actually been moving — is 9.16%, unusually depressed compared against this stock's own recent history. But the 5-day/20-day realized-vol ratio is 1.18 and sits well above its norm: the last week has been livelier than the month that preceded it, even as the absolute level stays low.
Premium rich or cheap. The volatility risk premium — the gap between how much movement options are priced for and how much SPY has actually delivered — stands at about 3.2 vol points (12.33% implied against 9.16% realized). When that gap is positive, option sellers have been collecting more than realized movement cost them. Where does today's gap sit versus this ETF's own recent readings? At the 59th percentile — richer than about 59% of them, which is squarely middling. A week ago the gap was wider (about 5.7 points on September 16) and it has compressed since as implied volatility fell faster than realized. The combination — IV rank 8.45 and a merely average premium over delivered movement — means neither side of the premium trade has an obvious edge. Sellers aren't being overpaid; buyers aren't getting a bargain. Structure selection should be driven by where the walls are, not by a volatility edge.
Skew and sentiment
Skew measures the fact that puts and calls the same distance from the stock price don't cost the same — when puts are pricier, traders are paying up for crash protection. SPY's 25-delta skew is 3.0 vol points (put IV 13.81% vs call IV 10.79%), against a 60-day median of 4.0 points and a 7-day average of 5.1. In plain terms: downside protection is cheaper relative to upside than it has been at any point in recent weeks. That reading is stretched flat versus this ETF's own history — complacency, not fear.
Sentiment across expiration dates flipped with it. The 0–7 day bucket scores +6 and the 7–30 day bucket +14, against 7-day averages of −19 and −27 respectively; the overall summary phrase for Friday was "broadly bullish," where a week's worth of sessions averaged out to "broadly bearish." The longest bucket (60–120 days) is the strongest at +26. So the change is real and it is broad, but the magnitudes are small — this is a lean, not a stampede.
One counterweight, and it matters: on Friday itself, put open interest grew faster than call open interest (+80,781 puts vs +20,404 calls). The unwinding of hedges happened earlier in the week; Friday saw fresh protection go back on. Our read of the flow is a market that has stopped panicking without yet committing.
The key levels map
| Level | Price | Why it matters |
|---|---|---|
| 52-week high | $779.37 | 2.3% overhead; the ceiling of the past year |
| Swing resistance | $776.39 | Heuristic pivot cluster from recent price structure |
| Call wall (September 25) | $772.00 | 26,482 calls open — the strike that caps this expiration's upside; built almost entirely on Friday |
| Whole-chain heaviest call strike | $770.00 | 116,094 calls across all expirations — note it differs from the September 25 wall by $2; the $772 strike is the one that governs this week |
| Large-gamma strike | $765.00 | Second-heaviest total gamma in the chain — hedging flows thicken here |
| 20-day moving average | $764.30 | Price is 0.34% below it; first overhead trend marker |
| Max pain (September 25) | $763.00 | Where the most option value would expire worthless — expirations sometimes gravitate toward it |
| Spot (September 18 close) | $761.69 | Reference |
| Put wall (September 25) | $760.00 | 19,485 puts open, and the single largest gamma strike in the whole chain — the week's floor |
| 50-day moving average | $759.73 | Price sits 0.26% above it |
| Swing support | $757.76 | The level whose loss invalidates this read |
| Whole-chain put wall / 100-day MA | $750.00 / $750.05 | 184,279 puts open across all expirations, right on the 100-day average — a deep structural floor |
| Gamma flip estimate | ≈ $746 | One rough estimate suggests market-maker hedging amplifies selling below here |
| 200-day moving average | $716.28 | 6.3% below; the long-term trend is untouched by any of this |
Positioning and unusual flow
Market makers hedge the options they've sold, and the direction of that hedging depends on their net position. One rough estimate of that positioning puts the whole chain in a negative-gamma regime, where hedging tends to amplify moves rather than dampen them, with a flip level around $746. The September 25 expiration's own estimate is also negative, though only mildly so — and notably, the nearer expirations (September 21 through 24) estimate as positive. Practically, that means the first half of the outlook window leans toward pinning behavior and the back half toward looser, more extendable moves. Treat all of it as an estimate; it is derived from gamma and open interest under an assumed dealer convention, not from observed inventory.
Three live flow items stand out:
- September 25 $772 calls — open interest up 24,079 in one session to 26,482 on 5,275 contracts traded. Somebody built this expiration's ceiling deliberately, and most of it was new positioning rather than day-trading churn.
- September 21 $770 calls — 58,171 contracts traded, open interest up 28,265. Cheap lottery tickets three days out at 6.1% implied volatility and a delta of 0.03; this is a low-cost upside bet, not conviction buying.
- September 21 $760 puts — 89,815 contracts traded against just 4,575 open, a turnover ratio near 20. Heavy same-day activity right at the put wall strike, which is exactly where you'd expect the tug-of-war to concentrate.
3 · Technical check
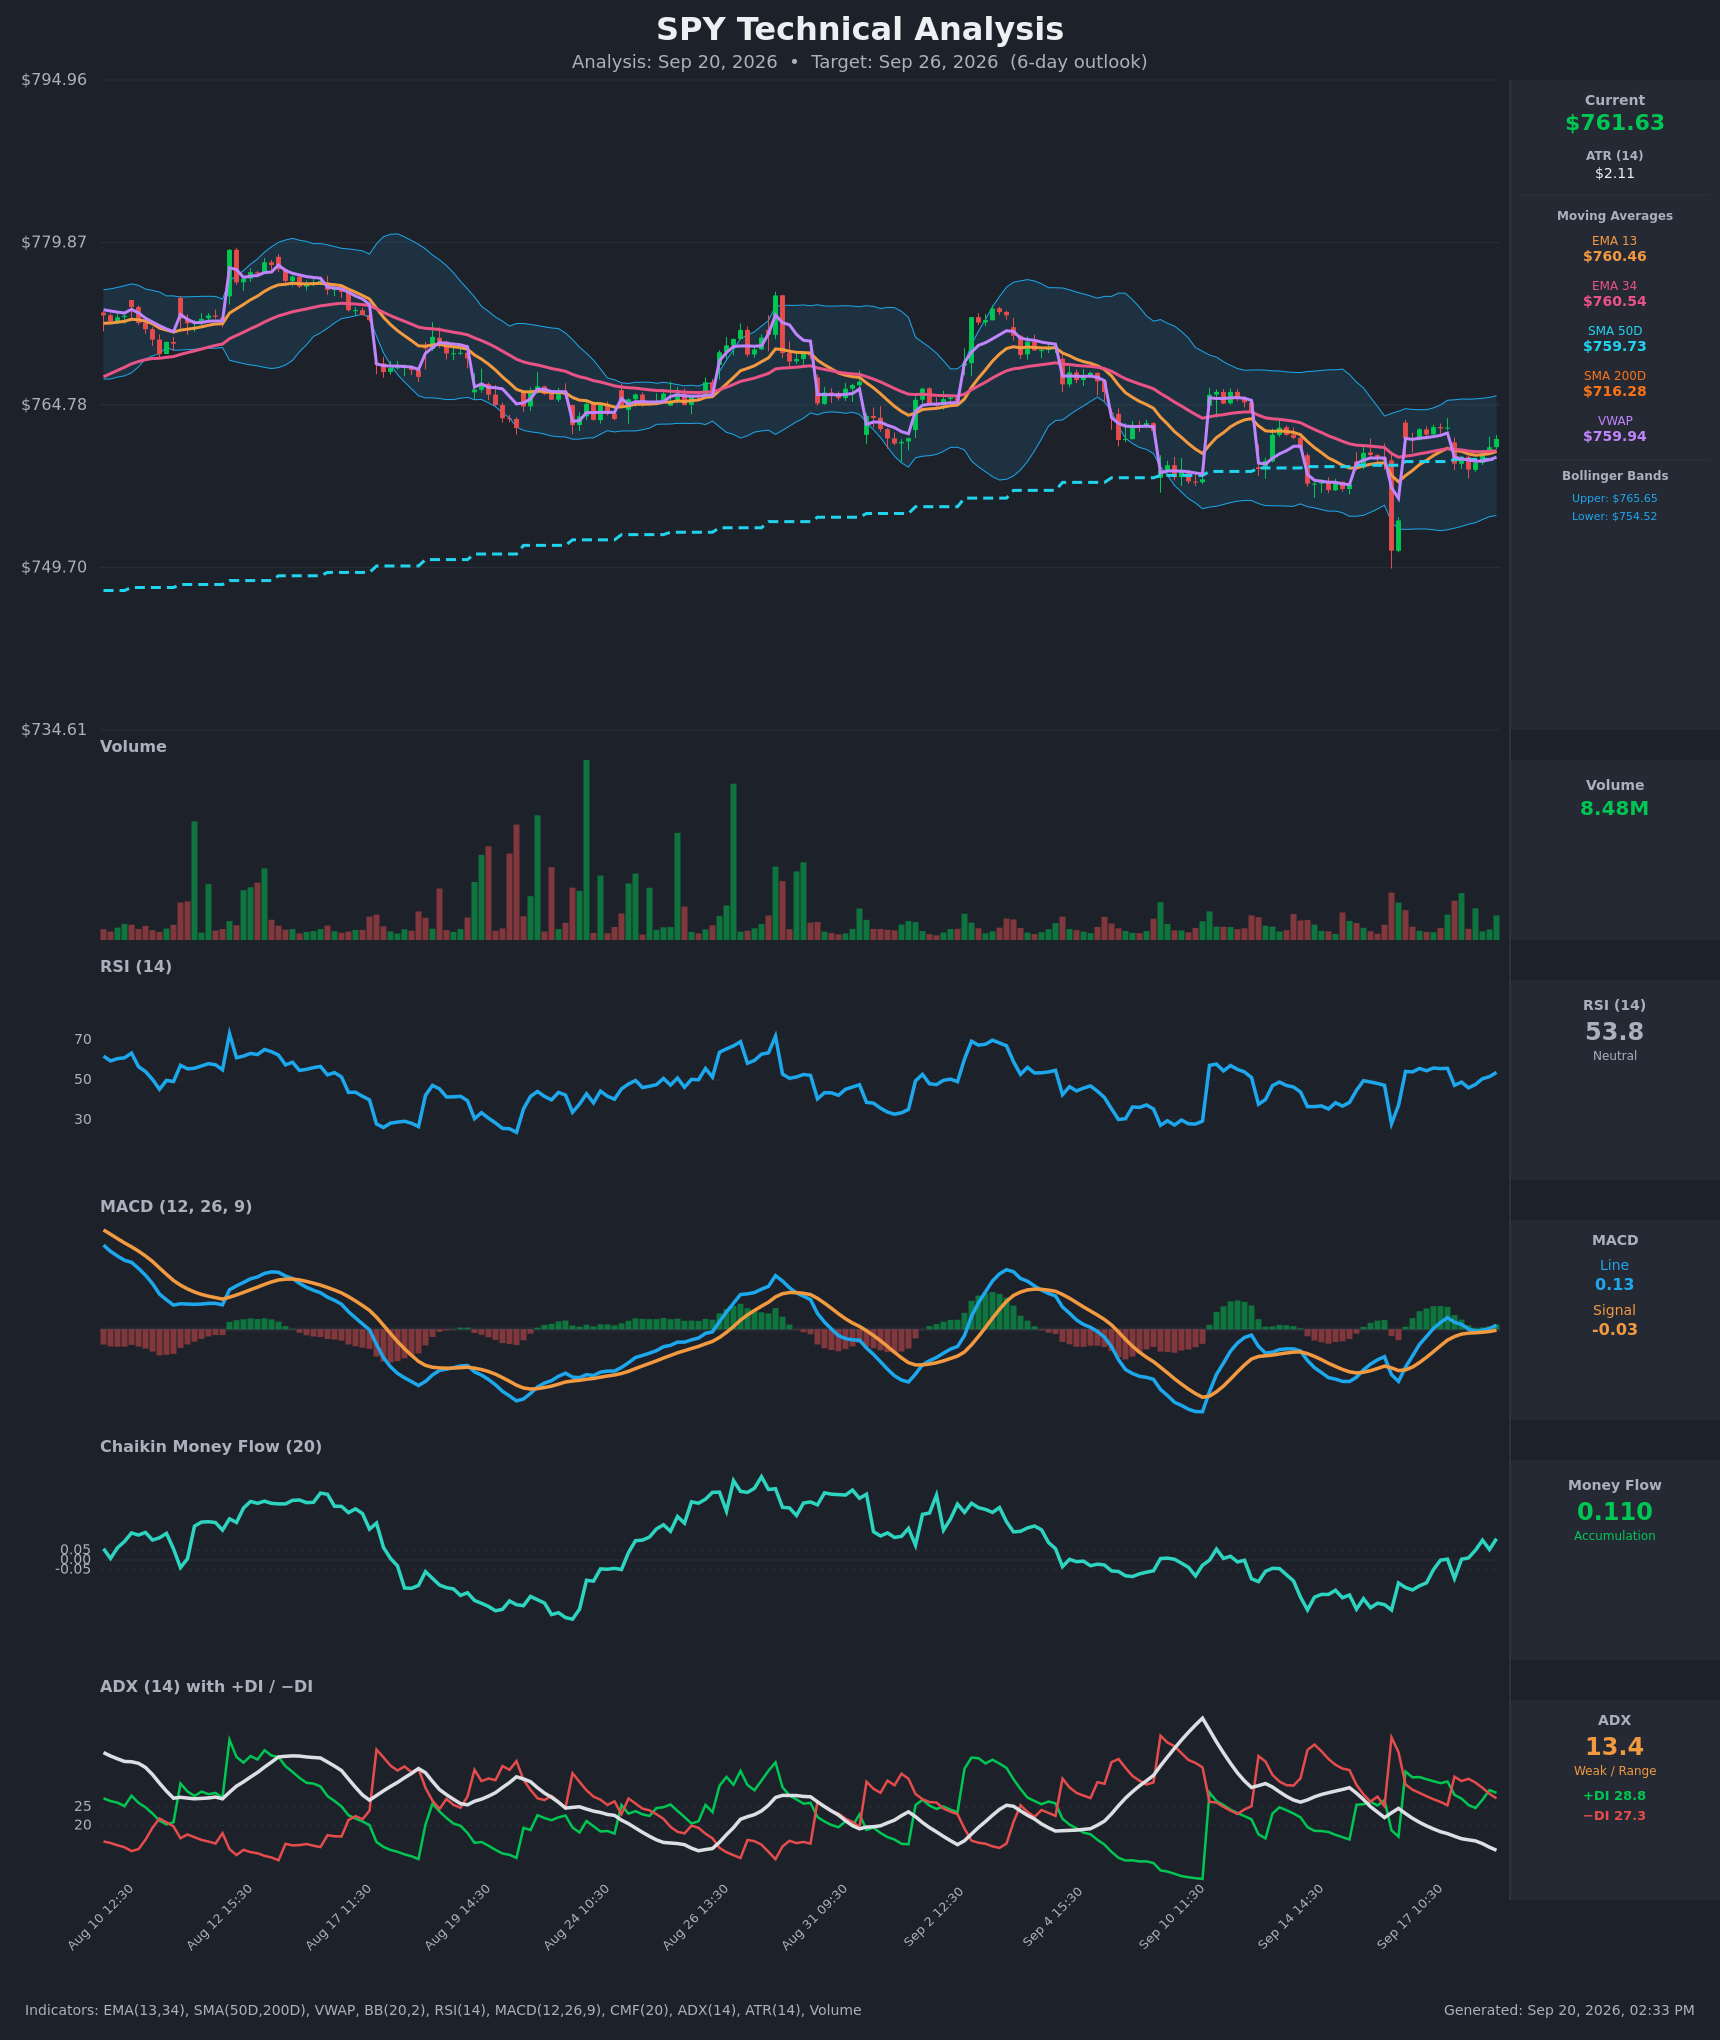
Both chart models run bullish and both land on the same number. The 3-day model (target date September 23) projects $765.50 with a forecast range of $747.00 to $778.00. The 5-day model (target date September 25) also projects $765.50, with a forecast range of $749.50 to $777.00. Their reference price of $761.63 is within six cents of the options snapshot's $761.69 — no data-date problem.
Both classify as Confirms: direction matches the options market's mild upward tilt, and the $765.50 target sits comfortably inside the options-implied $750.87–$772.51 band, between max pain at $763 and the call wall at $772. The supporting reads are a fresh MACD crossover above its signal line and money flow (CMF at 0.110) turning decisively into accumulation off the September 16 low. The caution is equally clear: ADX at 13.4 and falling describes a weak, range-bound tape, which argues for a grind rather than a thrust. The 5-day model's own dominant scenario invalidates on a close below $758 — within a few cents of the swing support this article uses as its kill switch.
Model vs. Market: The options market implies $750.87–$772.51 into September 25; the 5-day technical model targets $765.50 within a $749.50–$777.00 forecast range. The chart model's ceiling sits above where the options chain has built its heaviest call resistance — if SPY gets to $772, the option positioning, not the chart, is what decides whether it goes further.
Net effect on strikes below: the confirming technicals justify shading the bullish structure's short strike up to $757 rather than further out, and keeping the condor's short call at $770 rather than stretching to the $772 wall.
Full technical write-ups: 3-day report → · 5-day report →
4 · Three ways the next five days can go
If SPY pushes above the call wall ($772): That strike carries 26,482 open calls for this expiration, and heavy call open interest overhead tends to slow rallies as hedging flows lean against the move. A clean break through it leaves relatively thin positioning until the swing resistance zone near $776.39 and the 52-week high at $779.37. Note that the whole chain's heaviest call strike is $770, $2 lower — so the $770–$772 zone functions as a band, not a line.
If SPY drifts between the walls ($760–$772): This is the base case. Max pain for September 25 sits at $763, $1.31 above Friday's close, and the nearer expirations' estimated gamma regime leans positive, which historically coincides with hedging that dampens rather than extends moves. A drift into the $763–$766 zone — where max pain, the 20-day average at $764.30 and the second-largest gamma strike at $765 all cluster — would be the least surprising outcome in the file.
If SPY breaks below the put wall ($760): The $760 strike is both this expiration's put wall and the single largest gamma strike in the entire chain, so a break through it means unwinding the densest positioning on the board. Below that, the 50-day average at $759.73 and swing support at $757.76 come quickly, and then a gap down to the $750 shelf, where 184,279 puts sit open across all expirations. One rough estimate places the gamma flip near $746 — below that level, market-maker hedging tends to accelerate selling rather than cushion it.
5 · Three defined-risk structures
Prices are end-of-day midpoints as of September 18, 2026. All structures are hypothetical. Verify live prices before trading — these will be stale by the open.
If you lean bullish: short put spread
- Trade: Sell the September 25 $757 put / buy the September 25 $752 put
- Credit: $0.86 · Max profit: $86 · Max loss: $414 · Break-even: $756.14
- Why it fits: The short strike sits $3 below this expiration's put wall at $760 and above the implied-range floor of $750.87. You collect a credit that pays as long as SPY holds the zone the options market itself has identified as its floor, and the flattened skew means you're not paying up for the long wing.
- Makes sense only if: you accept that the credit is small in absolute terms — IV rank 8.45 means there simply isn't much premium in this chain — and you're being paid mainly for time, not for volatility.
- Invalidated if: SPY closes below $757.76.
- Managing it: Close at roughly 50% of max credit; exit regardless by the September 23 checkpoint if SPY is trading under $760, because the short strike's cushion evaporates fast in the last two sessions. If SPY closes through $757, close rather than hope.
- Liquidity note: The $757 puts quoted 4¢ wide (about 1.8% of mid) and the $752 puts 2¢ wide; fills should be straightforward.
- Analyze this position →
If you expect the range to hold: iron condor
- Trade: Sell the September 25 $755 put / buy the $750 put, and sell the September 25 $770 call / buy the $774 call
- Credit: $1.50 · Max profit: $150 · Max loss: $350 · Break-evens: $753.50 and $771.50
- Why it fits: A credit structure collects premium up front and wins if price stays between the short strikes. Those strikes bracket the $760–$772 wall corridor with room to spare, and the structure's midpoint (~$762.50) sits right between max pain at $763 and Friday's close. The chart models' $765.50 target is comfortably inside both break-evens.
- Makes sense only if: you genuinely expect chop. With ADX at 13.4 and realized volatility unusually depressed for this ETF, that's the tape you've got — but the 5-day/20-day realized-vol ratio at 1.18 says movement has been picking up, so size accordingly.
- Invalidated if: SPY closes outside $757.76–$772.00.
- Managing it: Take profits at ~50% of the credit; close the threatened side if either short strike is breached on a closing basis rather than defending both wings.
- Liquidity note: The $755 puts traded 3¢ wide and the $770 calls 3¢ wide; the $774 calls are the loosest leg at 2¢ on a $0.55 mid (about 3.6%) — use a limit order on the full structure.
- Analyze this position →
If you lean bearish: short call spread
- Trade: Sell the September 25 $768 call / buy the September 25 $773 call
- Credit: $1.32 · Max profit: $132 · Max loss: $368 · Break-even: $769.32
- Why it fits: It sells the zone directly beneath the two heaviest overhead strikes — the chain's $770 call concentration and this expiration's $772 wall. You're betting the rally that started off the September 16 low runs out of room before it reaches positioning that has historically acted as a brake.
- Makes sense only if: you're fading the bullish tilt rather than following it — this structure fights the file's lean, so keep it smaller than the other two.
- Invalidated if: SPY closes above $772.00.
- Managing it: Because the short-term chart reads point up against a flat longer trend, this one wants a short leash — take 50% and go, and close on any daily close above $766.
- Liquidity note: The $768 calls quoted 5¢ wide on a $2.01 mid (about 2.5%) and the $773 calls 2¢ wide; both are tradeable.
- Analyze this position →
If none of these: no trade
There's a real case for sitting this one out. IV rank at 8.45/100 means every credit structure here collects a thin premium for a defined but meaningful risk — the short put spread risks $414 to make $86. The premium over delivered movement sits at the 59th percentile of this ETF's own recent readings, which is average, not rich; you are not being compensated for an unusual volatility distortion. And with the composite directional read landing at a mild tilt rather than a conviction call, there's no directional edge worth paying for either. If your alternative is a modest credit in a $12-wide corridor with a negative-gamma estimate on the back half of the week, cash is a perfectly respectable position.
6 · Quick FAQ
What is SPY's expected move this week? ±$10.82, or ±1.42%, into the September 25 expiration — a $750.87 to $772.51 band around Friday's $761.69 close, per the options market's straddle pricing as of September 18.
Is SPY expected to go up or down over the next five days? Options positioning as of September 18 leans mildly bullish — short-dated sentiment flipped positive and puts are unusually cheap relative to calls for this name — but that's a read of what traders have done, not a forecast. The actionable map is the $750.87–$772.51 range with the $760 put wall and $772 call wall as the hard edges.
Are SPY options expensive right now? IV rank of 8.45/100 says option prices are lower than about 92% of the past year's readings. On top of that, they're running about 3.2 vol points above the movement SPY has actually delivered — richer than roughly 59% of this ETF's own recent readings, which is middling. Cheap in absolute terms, fairly priced relative to delivered movement: neither buying nor selling premium carries an obvious edge this week.
Where is SPY's biggest options support and resistance? For the September 25 expiration, the put wall is $760.00 (19,485 contracts open) and the call wall is $772.00 (26,482 contracts open). Across the whole chain the heaviest call strike is $770 and the heaviest put strike is $750 — label which you're using, because they aren't the same levels.
What invalidates this week's read? A close below $757.76.
Methodology & disclosures. Data: end-of-day options-chain snapshot for SPY, 2026-09-18, generated 2026-09-20T14:33:45Z. Prices shown are midpoints and will differ from live markets. Momentum/positioning scores and volatility-premium comparisons are descriptive measurements of past option flow and past price movement — not investment advice, signals, forecasts, or guarantees. All trade structures are hypothetical. Every structure shown has a defined maximum loss; you can lose the entire max-loss amount. Options involve substantial risk and are not suitable for all investors.