TLT Options Are Pricing a $1.30 Move Into September 21 — The Chart Model Sees $79.80
The options market implies an $79.57–$82.17 range for TLT into the September 21 expiration, with call-side flow building even as price sits a quarter percent above its 52-week low. Here's the level-by-level map and three defined-risk ways to trade the gap between the flow and the chart.

The options market implies a $79.57–$82.17 range into the September 21 expiration; here's what's driving it, where the walls sit, and three defined-risk ways to trade it.
Published Sunday, September 13, 2026 · Data as of Friday, September 11 close
Explore the live TLT options data in the Detailed Options Analyzer →
Quick answer
| Item | Answer |
|---|---|
| Market bias | Neutral |
| Options-implied range (into September 21) | $79.57 – $82.17 (±1.61%, or about ±$1.30) |
| Major support | $78.00 (September 21 put wall) |
| Major resistance | $86.00 (September 21 call wall) |
| Max pain (September 21) | $82.00 |
| Dealer gamma regime (estimate) | Negative — in this regime market-maker hedging tends to amplify moves rather than cushion them; no flip level is computable from today's chain |
| Volatility condition | Falling — IV rank 32.7/100 · premium roughly fair: options are priced about 0.2 vol points above delivered movement |
| Technical check | Diverges (bearish, both the 4-day and 7-day chart models) |
| Best-fitting strategy | Iron condor — short the September 21 $79.50 put and $82 call, wings one dollar wide |
| Analysis invalidated if | TLT closes below $79.50 |
1 · What matters today
TLT closed Friday at $80.87 — a quarter of one percent above its 52-week low of $80.67. That is the fact everything else hangs on. Underneath it, the options flow is doing something almost contrary: call open interest grew by roughly 249,000 contracts in a single session while put open interest shrank, and seven call contracts cleared the unusual-volume bar against zero puts. Our read of that flow leans mildly higher; the price structure and both technical models lean lower. The two cancel, so the honest call for the next seven days is neutral, and the map matters more than the direction.
That map: the options market is pricing a $79.57–$82.17 range into the September 21 expiration — roughly $1.30 up or down, derived from what straddles cost. Max pain sits at $82.00. A daily close below $79.50 breaks the range read and hands the week to the sellers.
2 · What the options market is pricing
What changed this week
The story of the past five sessions is a volatility scare that drained almost as fast as it arrived. On September 10 the chain went risk-off hard: put volume outran call volume at a ratio of 1.46, total option volume hit 2.6× its 20-day average, and at-the-money implied volatility — the market's estimate of how much TLT will move, baked into option prices — spiked to 12.9%. By Friday's close IV had fallen 13.6% in one day back to 11.10%, and the put/call volume ratio had collapsed to 0.55. For context, the trailing seven-day average of that ratio is 0.70 and the fourteen-day average is 0.63; Friday was distinctly call-heavy even against a call-heavy baseline.
Open interest tells the same story more slowly. The put/call open-interest ratio — how many puts are held open for every call — now sits at 0.70, against a fourteen-day average of 0.83. Puts have been thinning for two weeks. The single largest non-expired open-interest change was in the October 16 $75 puts, which shed 64,594 contracts (from 90,623 to 26,029); on the other side, the September 30 $82 calls added 51,281 contracts to reach 61,014. Traders have been letting far-downside protection lapse while building upside strikes. And into Friday's expiration, the September 11 $81.50 calls saw 26,636 contracts trade and added 18,247 of open interest — settled history now, but it fits the pattern.
The trend reads agree with each other and say very little: the 5-day, 20-day and 50-day momentum reads all come back flat, even though price is down 1.5% over the past week and 5.4% over roughly two and a half months. This has been a grind, not a cascade.
Expected move
Into the September 21 expiration, the options market is pricing a move of about ±$1.30, or ±1.61% — a $79.57–$82.17 range around Friday's $80.87 close. That figure is the standard one-standard-deviation approximation from at-the-money option pricing, so roughly two-thirds of outcomes historically land inside it and one-third do not.
| Expiration | Implied move | Range around $80.87 |
|---|---|---|
| September 18 | ±1.51% | $79.65 – $82.09 |
| September 21 (our horizon) | ±1.61% | $79.57 – $82.17 |
| September 30 | ±2.41% | $78.92 – $82.82 |
| October 16 | ±3.41% | $78.11 – $83.63 |
The ladder is smooth — no humps, no steps, just the ordinary square-root-of-time expansion. Worth noting: the September 21 expiration's own at-the-money IV is 9.75%, below the chain-wide 11.10%, so this particular rung is priced slightly calmer than the chain average.
Volatility
At-the-money IV is 11.10%, with an IV rank of 32.7/100 — today's reading is cheaper than roughly 67% of the past year's. That is right on the 30-day average of 11.1% and above the 90-day average of 10.4%, so the bigger picture is "modestly elevated versus summer, unremarkable versus the year." The one-day drop of 13.6% is the September 10 spike unwinding. The front-month read is unavailable today (Friday was an expiry day, and front-month IV cannot be interpolated from a same-day-expiring contract), so there is no term-structure line this session.
On the realized side, 20-day realized volatility is 10.9%, which is running above this ETF's own recent norm — TLT has genuinely been moving more than it typically does. But the 5-day-to-20-day realized ratio is 0.83, meaning the last week has been quieter than the month behind it. Movement is decelerating into a lower price.
Premium: roughly fair. The volatility risk premium — the gap between how much movement options are priced for and how much TLT has actually delivered — is about 0.2 vol points (11.10% implied against 10.9% realized over 20 days). When that gap is positive, option sellers have been collecting more than realized movement cost them; 0.2 points is barely positive. Against this ETF's own recent readings it sits at the 36th percentile — richer than only about a third of them. The path matters too: the gap swung from roughly 1.7 vol points on September 10 to 0.2 points on September 11 as the vol scare deflated. Put plainly, with IV rank at 33 and a 36th-percentile premium over delivered movement, neither selling nor buying premium carries a strong edge here — which is exactly why the structures below are all defined-risk and none of them is a big credit play.
Skew and sentiment
Skew — the fact that puts and calls the same distance from the stock price don't cost the same — is essentially at its norm. The 25-delta put is priced at 11.28% IV against 10.88% for the 25-delta call, so puts run about 0.4 vol points over calls, versus a 60-day median of 0.4 vol points for this name. Nobody is paying up for crash protection; nobody is dumping it either. That said, skew has steepened by roughly 0.9 vol points over the past five sessions, so the direction of travel is toward slightly more put demand even if the level is ordinary.
The flow data is where the bullish tilt lives. Put volume was 244,174 against 441,048 calls. Friday's net new open interest — call open interest up 248,710 against puts down 19,828 — is an unusually heavy call-side build measured against this ETF's own history. So is the peer-relative sweep count: seven call contracts cleared the 95th-percentile volume bar and zero puts did, which is an extreme reading for TLT. Sentiment in short-dated options is mildly positive in the 0–7 day bucket and more clearly positive in the 7–30 day bucket, while the 60–120 day bucket leans slightly negative. The overall regime label is Mixed — the buckets disagree, and that disagreement is part of why the headline bias lands on neutral.
The key levels map
| Level | Price | Why it matters |
|---|---|---|
| Call wall (September 21 expiration) | $86.00 | Heaviest call open interest (7,510) for our expiration — well outside the priced range, so not a live cap this week |
| Whole chain's heaviest call strike | $84.00 | 337,609 calls open across all expirations — the real overhead pile, mostly October and December |
| Swing resistance | $83.01 | Recent pivot cluster from the price data (heuristic, not a guaranteed reaction zone) |
| 50-day moving average | $82.99 | Price sits 2.55% below it |
| 20-day moving average | $82.20 | Price sits 1.62% below it |
| Top of implied range (September 21) | $82.17 | One-standard-deviation upside for the week |
| Max pain (September 21) | $82.00 | The price where the most option value expires worthless — and the chain's single largest gamma strike |
| First swing resistance | $81.71 | Nearest overhead pivot; the chart models call it $81.50 resistance |
| Heaviest put strike, all expirations | $81.00 | 225,603 puts open — second-largest gamma pile in the chain |
| Last close / spot | $80.87 | Reference for every figure above and below |
| 52-week low | $80.67 | Just 0.25% under Friday's close — the structural line in the sand |
| Bottom of implied range (September 21) | $79.57 | One-standard-deviation downside for the week |
| Chart-model support | $79.50 | Named support in both technical reports; this week's invalidation level |
| Put wall (September 21 expiration) | $78.00 | Heaviest put open interest (3,348) for our expiration — thin, but it is this expiration's floor |
One caveat worth stating plainly: the September 21 expiration's own walls and the whole chain's walls disagree. Aggregated across every expiration, the biggest call pile is $84.00 and the biggest put pile is $81.00. Scoped to September 21 alone, they are $86.00 and $78.00 on just 7,510 and 3,348 contracts. That expiration carries thin open interest, so its walls sit wide and exert far less magnetic pull than the $81–$82 cluster that dominates the chain. For this week, treat $81 and $82 as the levels that actually matter and the September 21 walls as the outer rails.
Positioning and unusual flow
One rough estimate of dealer positioning puts the chain in a negative gamma regime — both in aggregate and for the September 21 expiration specifically. In that regime, market-maker hedging tends to amplify moves rather than dampen them: a push lower begets more selling. This is an estimate built on an assumed dealer sign convention, not observed inventory, and today's chain does not produce a usable flip level, so there is no single price at which the regime mechanically changes. Read it as a tilt toward faster moves, not a trigger.
Three non-expired flow items stood out:
- September 18 $81 calls — 53,115 contracts traded against 12,833 open, about $2.36 million of premium, the largest single-contract premium in the entire chain. At-the-money calls expiring in a week, bought in size.
- September 21 $74 calls — 1,900 contracts against zero open interest, roughly $1.32 million of premium. Deep in-the-money calls with 95-delta: that is a stock substitute, not a lottery ticket.
- September 30 $82 calls — open interest jumped from 9,733 to 61,014, a build of 51,281 contracts on 6,914 of volume. Someone is positioning for a reclaim of the $82 area later this month.
All three lean the same way, which is why the arithmetic behind the bias leaned mildly bullish before calibration pulled it back.
3 · Technical check
Both technical models disagree with the options flow, and they do so with some conviction. The 4-day model (target date September 18) is bearish, projecting $79.95 with a range of $78.70–$81.60. The 7-day model (target date September 21, matching our horizon) is also bearish, projecting $79.80 with a range of $77.90–$81.90. The reasoning is consistent across both: price trades below every major moving average, the directional-movement indicator has negative direction dominant on a rising ADX, and money-flow readings show sustained distribution rather than a one-off spike. Both name $79.50 support and $81.50 resistance.
Classified against the options data, this is a divergence on two counts. The direction opposes the call-side flow build, and the 7-day target of $79.80 sits below the bottom of the options-implied range at $79.57 — the chart model expects a move the option market has not priced as its base case. Both models also flag a shallow, unconfirmed MACD crossover as a bounce risk, and each assigns roughly a third of its probability weight to an oversold rally back toward $81.50–$82.20.
Model vs. Market: The options market implies $79.57–$82.17 into September 21; the 7-day technical model targets $79.80 with a projected range of $77.90–$81.90. That gap is the whole story of the week — the flow says accumulation, the chart says distribution, and the $80.67 52-week low is the referee. A daily close beneath it resolves the argument for the chart; a reclaim of $81.71 resolves it for the flow.
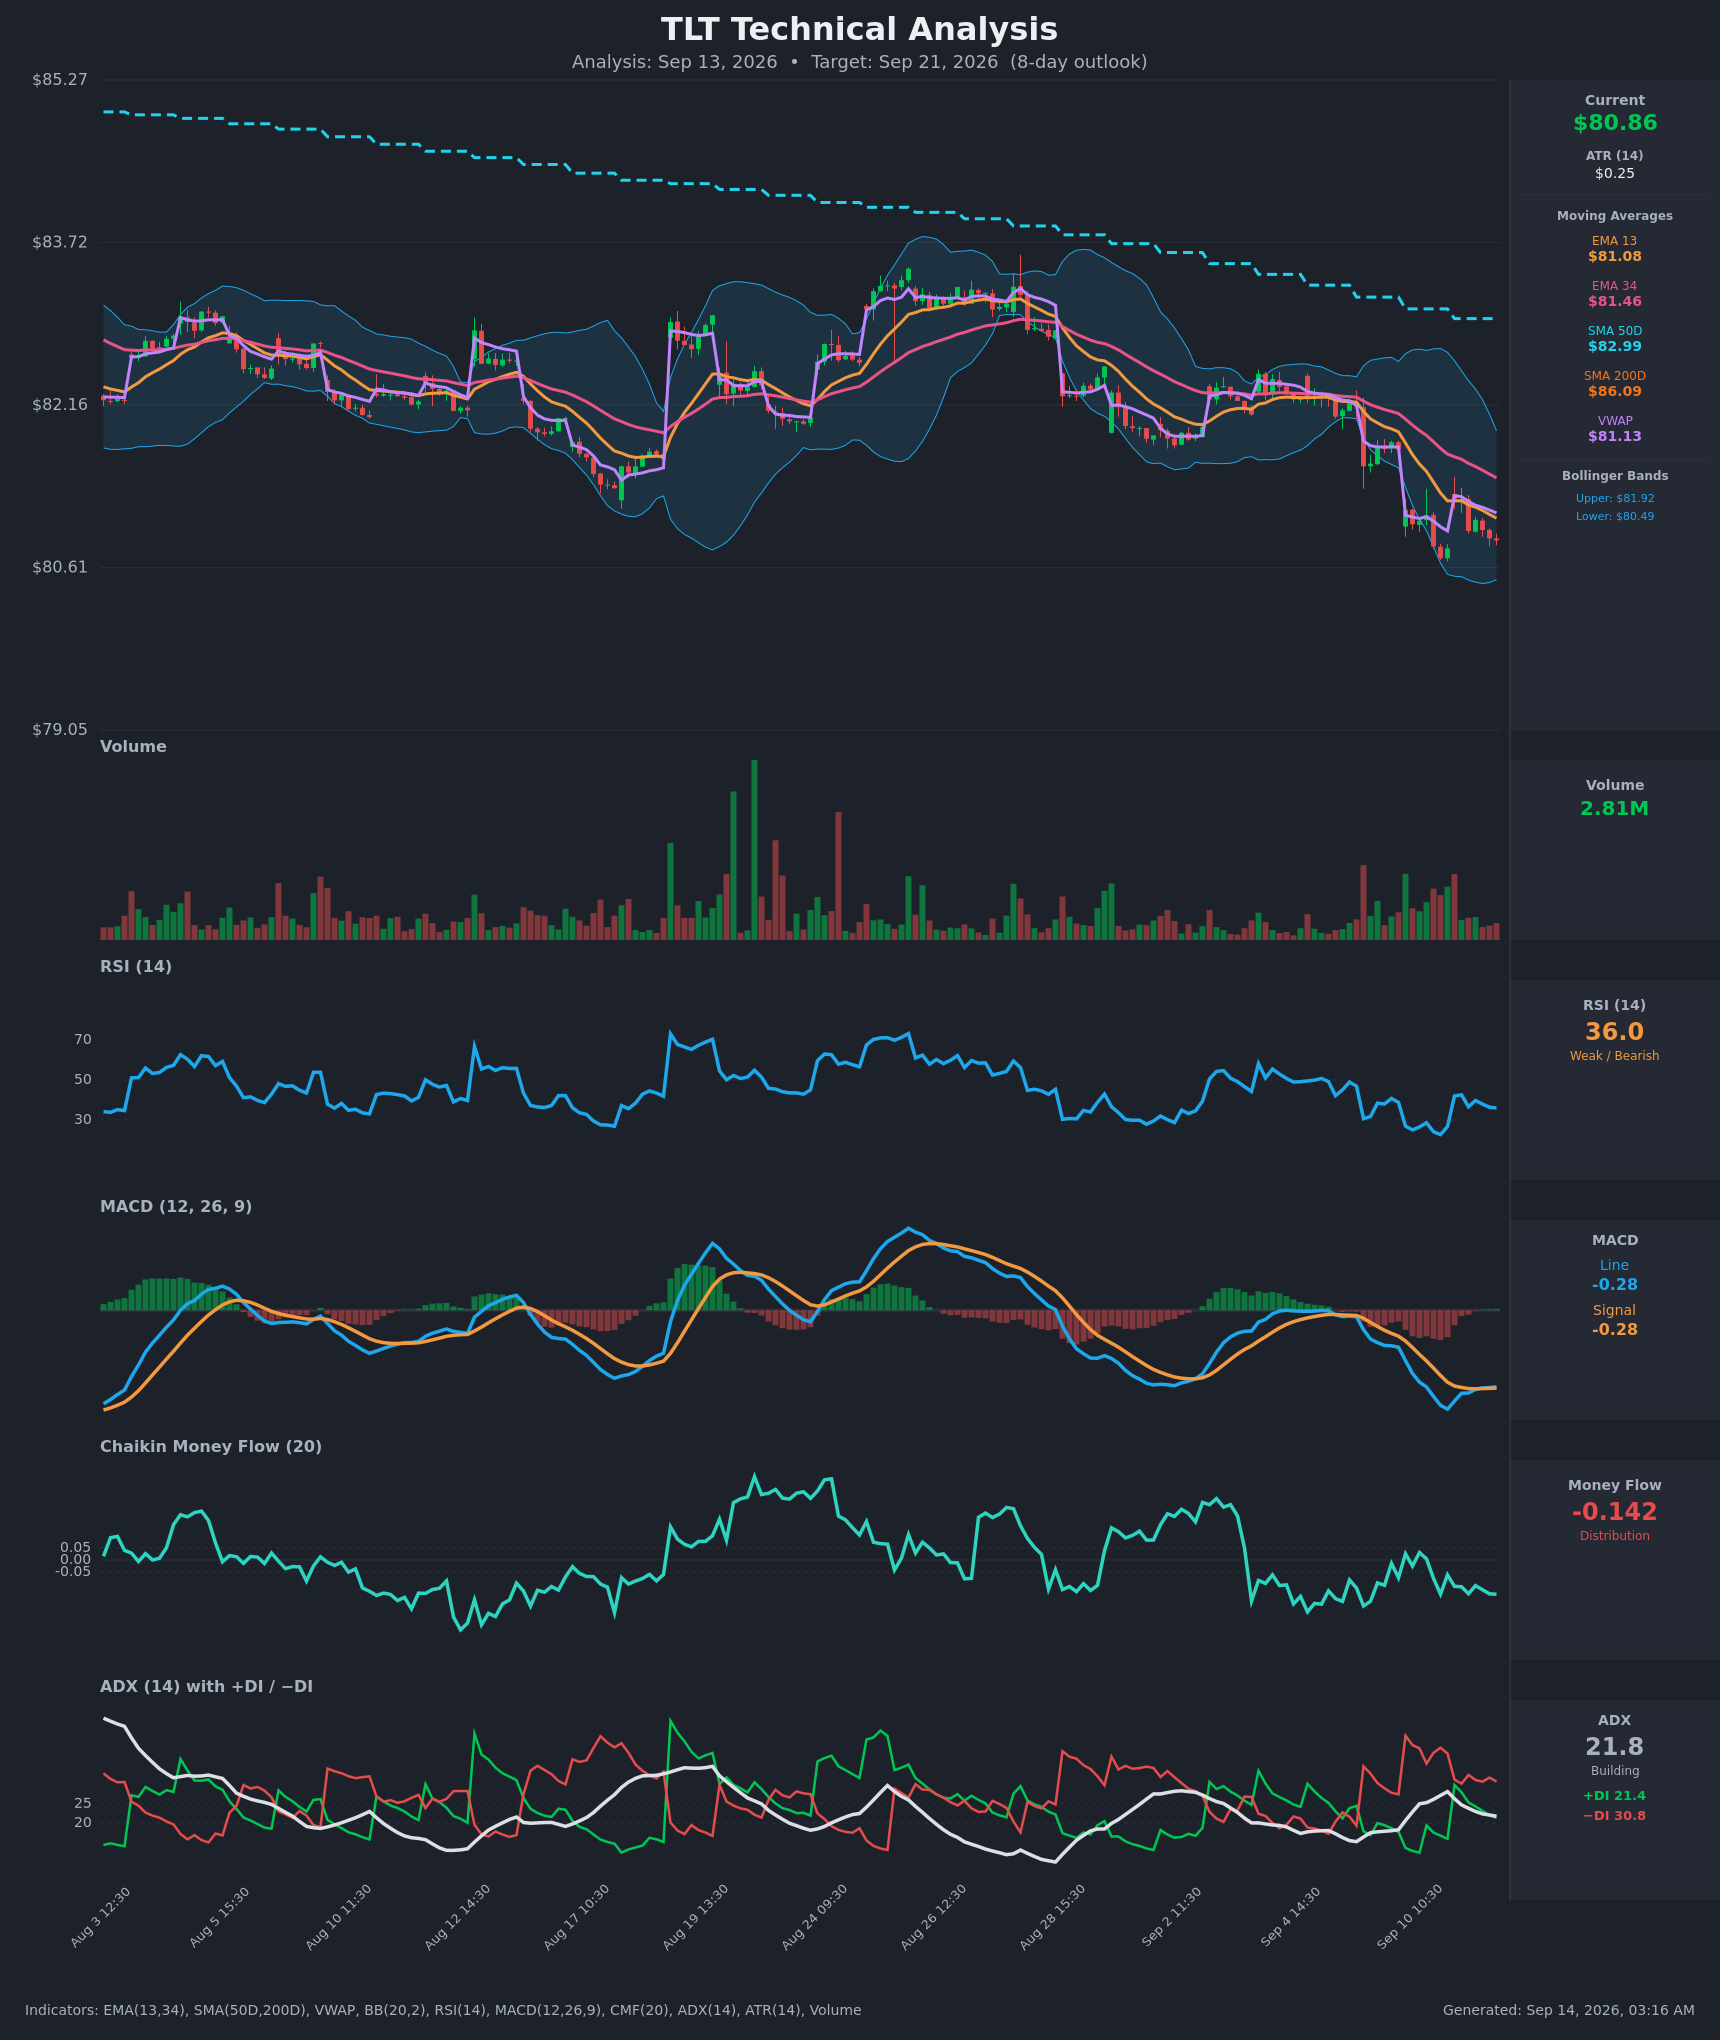
Practically, the technical read did two things to the structures below: it shaded the range-holding condor's short put down to $79.50 rather than $80, and it kept the bullish structure modest in size and short in duration.
Full technical write-ups: 4-day report → · 7-day report →
4 · Three ways the next seven days can go
If TLT pushes toward the top of the range ($82.17): The September 21 call wall at $86.00 is far outside anything priced this week, so it is not the cap that matters. The real overhead structure is the $82.00 max-pain strike — which is also the chain's single largest gamma pile — stacked under the 20-day average at $82.20 and the 50-day at $82.99. Positioning of that kind tends to slow a rally rather than reject it outright; the September 30 $82 call build suggests some traders expect exactly this drift.
If TLT drifts between the rails: This is the pin case, and it is the one the chain is built for. The $81.00 and $82.00 strikes hold the two biggest gamma piles in the whole chain and $82.00 is where the most option value expires worthless on September 21. Expiring open interest and the hedging it generates tend to pull price into that zone, which is why a $79.50–$82.00 profit box is the highest-probability shape available this week.
If TLT breaks below $79.50: The acceleration case. Price is already within a quarter percent of its 52-week low, the heuristic support levels in the price data came back empty (there are no recent swing pivots below here to lean on), and one rough estimate has dealers in negative gamma, where hedging tends to amplify selling rather than cushion it. The September 21 put wall at $78.00 is the next structural marker, and it is thin. A close through $79.50 is the level that ends this article's read.
5 · Three defined-risk structures
Prices are end-of-day midpoints as of Friday, September 11. All structures are hypothetical. Verify live prices before trading — these will be stale by the open.
If you expect the range to hold: September 21 iron condor
- Trade: Sell the $79.50 put / buy the $78.50 put, and sell the $82 call / buy the $83 call, all expiring September 21. (An iron condor is two credit spreads: you collect premium up front and keep it if price finishes between the short strikes.)
- Credit: $0.19 · Max profit: $19 per condor · Max loss: $81 per condor · Break-evens: $79.31 and $82.19
- Why it fits: Both short strikes sit at or outside the 1σ rails ($79.57 / $82.17), and the short call is parked exactly at the $82 max-pain strike — so a pin at $82 is this structure's best case, not its worst. The bias arithmetic came out neutral and premium is neither rich nor cheap, which argues for a wide, boring profit box over a directional bet.
- Makes sense only if: you believe the $80.67 52-week low holds for seven more days. The chart models put roughly even odds against that.
- Invalidated if: TLT closes below $79.50 or above $82.19.
- Managing it: Close at roughly 50% of max credit (about $0.10); exit regardless on September 18 if either side is being tested; if TLT closes through a short strike, close rather than hope — with only $19 of credit against $81 of risk, one bad expiration erases four good ones.
- Liquidity note: Each leg quotes about a penny wide ($0.14/$0.15 on the $79.50 put, $0.15/$0.16 on the $82 call), but on 5–15¢ options a penny is 7–18% of the mid. Use limit orders and expect to give up a couple of cents on entry — that is a real bite out of a $19 credit.
- Analyze this position →
If you lean bullish: September 21 $81/$82 call debit spread
- Trade: Buy the September 21 $81 call, sell the September 21 $82 call. (A debit spread: you pay up front, and the most you can make is the width of the strikes minus what you paid.)
- Debit: $0.33 · Max profit: $67 · Max loss: $33 · Break-even: $81.33
- Why it fits: It targets the $82.00 max-pain strike, which is also the chain's heaviest gamma pile — the most likely magnet for an expiration drift. It is the structure that expresses the flow story directly: 249,000 contracts of new call open interest in one session, seven call sweeps to zero put sweeps, and $2.36 million of premium through the nearby $81 calls. And because premium is only about 0.2 vol points above delivered movement, you are not paying a fat volatility surcharge to own it.
- Makes sense only if: TLT reclaims $81.71 — the nearest swing resistance and the level both chart models flag (as $81.50) as their own bearish invalidation.
- Invalidated if: TLT closes below $80.67, the 52-week low.
- Managing it: This position fights a longer trend that has price 5.4% lower over roughly two and a half months, so take profits early rather than holding for the last nickel — if TLT trades $82 before expiration, close it. Use the September 18 checkpoint: no progress by then, take what's left.
- Liquidity note: The $81 calls are the most liquid contract on this expiration — $0.48/$0.49, about 2% of mid, with $123,675 of premium traded Friday. The $82 calls are $0.15/$0.16. Entry is workable.
- Analyze this position →
If you lean bearish: September 21 $80.50/$79.50 put debit spread
- Trade: Buy the September 21 $80.50 put, sell the September 21 $79.50 put.
- Debit: $0.21 · Max profit: $79 · Max loss: $21 · Break-even: $80.29
- Why it fits: It is the structure that pays if the chart models are right — both target $79.80–$79.95 and both name $79.50 support, which is exactly where this spread reaches maximum value. Price is a quarter percent above its 52-week low with no swing-pivot support beneath it in the price data, and the dealer gamma estimate is negative, a regime in which hedging tends to accelerate a breakdown.
- Makes sense only if: you are willing to be short into the flow. Call-side positioning is building against you; this is the contrarian side of the week's data.
- Invalidated if: TLT closes above $81.50 — the reclaim level both technical reports name as their own invalidation.
- Managing it: Take profits at or just above $79.50 rather than holding for the last few cents of intrinsic value. If TLT is still stuck around $80.50–$81.00 at the September 18 checkpoint, close for whatever remains — the spread is almost all extrinsic value at that point and time decay does the rest of the damage.
- Liquidity note: The $80.50 puts trade $0.35/$0.36 (a penny, about 2.8% of mid) and the $79.50 puts $0.14/$0.15. Both fillable.
- Analyze this position →
If none of these: no trade
There is a real case for standing aside. IV rank at 32.7/100 and a premium sitting only about 0.2 vol points above delivered movement — thinner than roughly two-thirds of this ETF's own recent readings — means credit sellers are not being paid much for the risk they take. The condor above collects $19 against $81 of exposure, which demands a win rate north of 80% just to break even, and it asks you to underwrite a 52-week low holding for seven more days while one rough estimate has dealers in a regime that amplifies breaks. On the other side, the directional structures each require you to pick a side of a genuine disagreement between the flow and the chart. If you have no strong view on whether $80.67 holds, "no position" is a perfectly good expression of that. Wait for either a close through $79.50 or a reclaim of $81.71, then trade with the resolution instead of ahead of it.
6 · Quick FAQ
What is TLT's expected move this week? About ±$1.30, or ±1.61%, into the September 21 expiration — a $79.57–$82.17 range around the $80.87 close, per the options market's straddle pricing as of Friday, September 11.
Is TLT expected to go up or down over the next week? Options positioning as of September 11 leans mildly bullish — heavy call-side open-interest building and call sweeps with no put counterpart — but that is a read of what traders have already done, not a forecast, and both technical models point the other way. The net call is neutral. The actionable map is the $79.57–$82.17 range and the $79.50 / $82.00 levels around it.
Are TLT options expensive right now? Two lenses, same answer. IV rank of 32.7/100 says option prices are lower than about 67% of the past year's readings; on top of that, they are running only about 0.2 vol points above the movement TLT has actually delivered, which is richer than just 36% of this ETF's own recent readings. Premium is roughly fair — neither a gift for sellers nor a bargain for buyers.
Where is TLT's biggest options support and resistance? For the September 21 expiration specifically, the put wall is $78.00 and the call wall is $86.00 — both thin and wide. Across the full chain the heavier structure sits much closer: $81.00 holds 225,603 puts and $84.00 holds 337,609 calls, with max pain for September 21 at $82.00.
What invalidates this week's read? A daily close below $79.50.
Methodology & disclosures. Data: end-of-day options-chain snapshot for TLT, 2026-09-11, generated 2026-09-14T03:16:21.151Z. Prices shown are midpoints and will differ from live markets. Momentum/positioning scores and volatility-premium comparisons are descriptive measurements of past option flow and past price movement — not investment advice, signals, forecasts, or guarantees. All trade structures are hypothetical. Every structure shown has a defined maximum loss; you can lose the entire max-loss amount. Options involve substantial risk and are not suitable for all investors.