TLT Expected Move: Options Price ±$1.55 Into October 23, Plus Key Levels and Defined-Risk Trades
TLT options imply a $78.50–$81.60 range into the October 23 expiration, and positioning leans slightly bullish after a 2.7% weekly pop. Premium is rich versus delivered movement, so here are the levels that matter and three defined-risk ways to trade them.
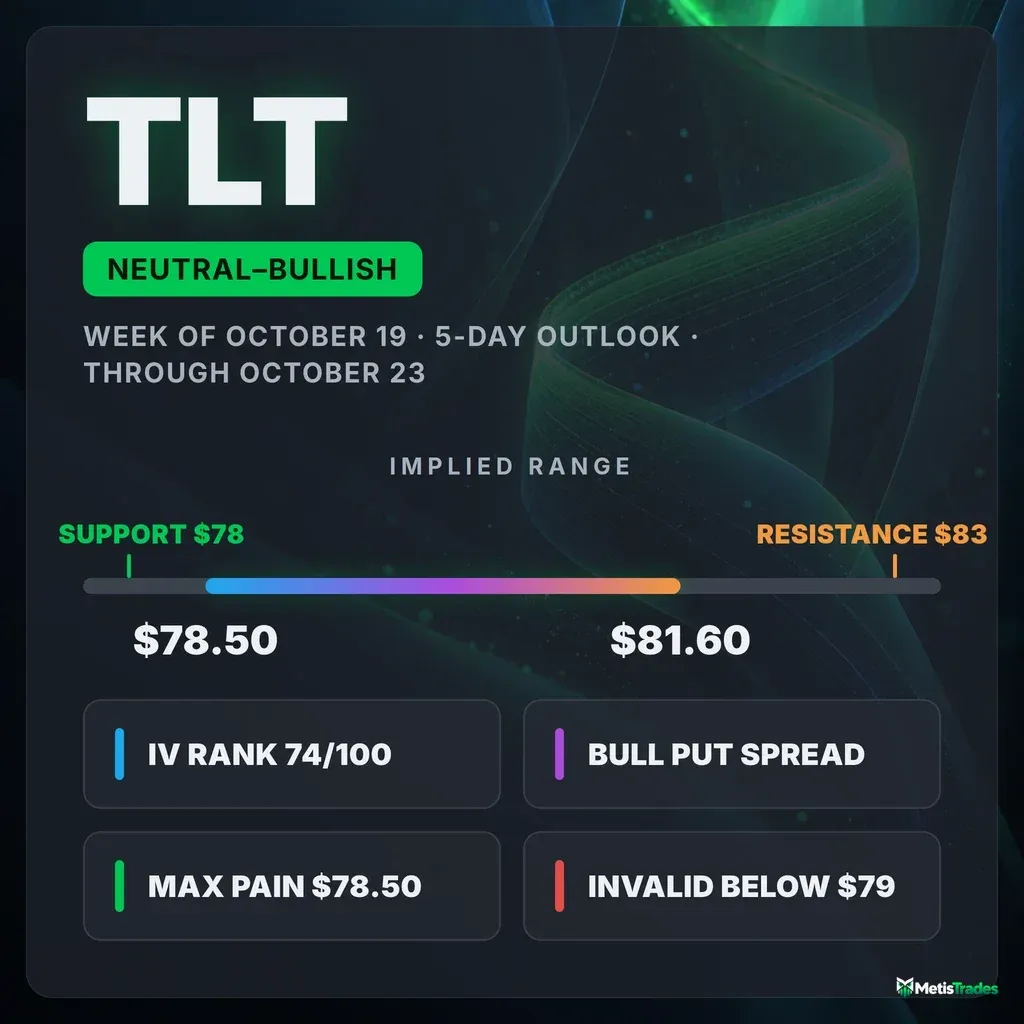
The options market implies a $78.50–$81.60 range into the October 23 expiration. Here's what's driving it, where the walls sit, and three defined-risk ways to trade it.
Published Sunday, October 18, 2026 · Data as of Friday, October 16, 2026 close
Explore the live TLT options data in the Detailed Options Analyzer →
Quick answer
| Item | Answer |
|---|---|
| Market bias | Slightly bullish |
| Options-implied range (into Oct 23) | $78.50 – $81.60 (±$1.55, ±1.94%) |
| Major support | $78.00 (Oct 23 put wall); the whole chain's heaviest put strike is $79 |
| Major resistance | $83.00 (Oct 23 call wall, also the whole chain's heaviest call strike) |
| Max pain (Oct 23) | $78.50 |
| Dealer gamma regime (estimate) | Positive on net, so hedging tends to dampen moves; flip level ≈ $81, with spot sitting just below it |
| Volatility condition | Rising. IV rank 74/100 · premium rich: options priced ~3.4 vol pts above delivered movement |
| Technical check | Confirms (bullish; 3-day target $80.40, range $78.70–$81.40; 5-day target $80.70, range $78.00–$82.00) |
| Best-fitting strategy | Bull put credit spread (Oct 23 $79.50/$78.50), only if TLT holds above $79.50 |
| Analysis invalidated if | TLT closes below $79.00 |
1 · What matters today
Our read of TLT options is slightly bullish for the next five trading days. The single biggest reason is sentiment in options expiring over the next month: it is strongly call-leaning, and traders have been thinning out put positions all week. The options market is pricing a move of about $1.55 either way by the October 23 expiration. That works out to a range of roughly $78.50 to $81.60 around Friday's $80.05 close.
The level that changes the picture is $79. It holds the largest pile of open put contracts across the whole chain and sits just above the base of the October 15 gap. A close below it would undo the week's breakout. Options are also expensive right now, priced for more movement than TLT has actually delivered, which favors collecting premium over buying it. Both technical models point modestly higher, which confirms the lean.
2 · What the options market is pricing
What changed this week
TLT gained 2.65% over the past five sessions, most of it on the October 15 gap from $78.89 to an $80.47 open. Option flow followed price.
- Puts are thinning. The put/call open-interest ratio (open interest = contracts currently held open) slid from 0.66 to 0.58 over five days. For every call held open there are now about 0.58 puts, against a 14-day average of 0.69. That pace of put unwinding is faster than usual for this ETF.
- IV is climbing. Implied volatility rose 5.2% over the same stretch even as price rallied.
- The biggest new position is a long-dated call build. Open interest in the November 30 $86 calls jumped by 88,037 contracts in a single day. That is a lot of new, far-upside call exposure.
- Some put interest came back on Friday. Day-over-day, put open interest grew by about 94,500 contracts versus roughly 42,100 for calls. The weekly drift is call-friendly, but Friday alone added protection.
- Expiry-day cleanup. Into Friday's expiration, the October 16 $80 calls shed 39,034 contracts of open interest. That is settled history, not a live position.
The trend reads also show some tension. The past week's pop is clearly upward, but over the past month TLT is still down about 1.5%, and over the past two months about 3%. The near-term flow is leaning up while the bigger trend has only flattened, not turned.
Expected move
The expected move is the move the options market is pricing in, derived from what straddles cost. For the October 23 expiration that is ±$1.55 (±1.94%), putting the one-standard-deviation range at $78.50 to $81.60. Here is how the ladder steps out:
| Expiration | Implied move | Range around $80.05 |
|---|---|---|
| Oct 19 | ±1.00% | $79.25 – $80.85 |
| Oct 21 (halfway checkpoint) | ±1.50% | $78.85 – $81.25 |
| Oct 23 (target) | ±1.94% | $78.50 – $81.60 |
| Oct 30 | ±2.80% | $77.81 – $82.29 |
| Nov 13 (~1 month) | ±4.10% | $76.77 – $83.33 |
The rungs scale roughly with time, with no unusual step-up anywhere in the ladder. The market isn't bracing for one specific date. It is simply pricing an elevated, evenly spread level of movement.
Volatility
Implied volatility (IV) is the market's estimate of how much TLT will move, baked into option prices. At-the-money IV is 14.73%. IV rank tells you where today's IV sits versus the past year: 74/100 means cheaper than only about 26% of the past year's readings. The IV percentile is even more lopsided: today's IV is higher than about 94% of the past year's days.
The direction is up:
- +2.6% on the day, +5.2% over five days, and +31.9% over 30 sessions.
- Current IV sits above its 30-day average (13.47%) and well above its 90-day average (11.30%).
- The front-month term-structure read, which compares option prices across different expiration dates, is unavailable today because it was an expiry day. The roughly two-month IV reads 14.62%, almost identical to the at-the-money level, so the curve looks broadly flat.
Measured against this ETF's own recent history ("unusual" here means unusual for TLT, not versus the broader market), 20-day realized volatility is running above its norm. Movement has also cooled sharply inside that window: 10-day realized vol is just 8.5%, versus 11.35% over 20 days. The gap-and-hold has turned into quiet digestion.
Premium rich or cheap? The volatility risk premium is the gap between how much movement options are priced for and how much TLT has actually delivered. When it's positive, option sellers have been collecting more than realized movement cost them.
- Right now, options are priced about 3.4 vol points above TLT's 20-day realized volatility.
- That gap sits at the 82nd percentile of this ETF's own recent readings, meaning richer than 82% of them.
- The path matters: the premium ran near 6 points in late September, compressed to about 2.8 points by mid-October, and ticked back up on Friday.
That combination, an IV rank of 74 and an 82nd-percentile premium over delivered movement, favors collecting premium over the next five days rather than paying up for it.
Skew and sentiment
Skew means puts and calls the same distance from the stock price don't cost the same. When puts are pricier, traders are paying up for crash protection.
- Skew is unusually flat. Today, 25-delta puts cost about 0.05 vol points less than equivalent calls (14.99% vs 15.04%). This ETF's 60-day norm has puts about 0.5 points richer. Downside protection has gotten noticeably cheaper relative to upside bets, which reads as complacency about a drop rather than fear.
- Put/call volume is ordinary. The put/call ratio measures put activity relative to calls; above 1 means puts dominate. Volume came in at 0.58, close to its 7-day average of 0.54 and its 60-day median. Total option volume was about average at 0.96× its 20-day norm.
- Short-dated sentiment is the split that matters. The 0–7 day bucket scores a near-flat +8, while the 7–30 day bucket scores a strongly bullish +72, up from a 7-day average of 45. That is why the overall regime reads "Mixed" today even though the 7-day average reads "Broadly Bullish."
The takeaway: this week's expirations are close to neutral, while traders positioning for the next few weeks are leaning toward upside.
The key levels map
| Level | Price | Why it matters |
|---|---|---|
| 52-week high | $92.19 | Far overhead; TLT sits in the lower quarter of its yearly range |
| 200-day moving average | $84.95 | Long-term trend line; price is 5.8% below it |
| Swing resistance | $84.58 | Prior pivot cluster |
| Swing resistance | $83.20 | Pivot just above the call wall |
| Call wall (Oct 23 and whole chain) | $83.00 | The strike with the biggest pile of open call contracts, which often acts like a magnet or barrier. Both the target expiration and the full chain agree |
| 100-day moving average | $82.79 | Intermediate trend line |
| Swing resistance | $82.18 | Next structural ceiling above the implied range |
| Large gamma strike | $82 | Heavy combined open interest; hedging flows concentrate here |
| Upper implied rail (Oct 23) | $81.60 | Top of the options-priced one-sigma range |
| Gamma flip estimate | $81 | One rough estimate of the line below which market-maker hedging tends to accelerate moves rather than cushion them; also a large gamma strike |
| Swing resistance | $80.81 | Nearest structural ceiling |
| 50-day moving average | $80.73 | Both technical models flag it as first resistance |
| Spot / largest gamma strike | $80.05 / $80 | Price sits on the chain's single heaviest gamma strike, a natural pin |
| TA support | $79.69 | Recent consolidation low (3-day technical report) |
| Put wall (whole chain) / invalidation | $79.00 | The strike with the biggest pile of open put contracts across all expirations; a close below breaks the thesis |
| Gap base | $78.89 | Prior close before the October 15 gap; a full gap fill lands here |
| 20-day moving average | $78.76 | Short-term trend support |
| Max pain (Oct 23) / lower implied rail | $78.50 | The price where the most option value would expire worthless; expirations sometimes gravitate toward it |
| Put wall (Oct 23) | $78.00 | Heaviest put open interest for the target expiration |
| 52-week low / swing support | $76.43 | Floor of the yearly range |
Positioning and unusual flow
Market makers hedge the options they've sold. Under the common convention behind this estimate, net dealer gamma for the October 23 expiration and the full chain both come out positive, a regime where their hedging tends to dampen moves. That fits the two-day sideways drift near $80.
There is a wrinkle, and it is also only an estimate: the gamma flip sits around $81, and spot is about 1.8% below it. That is closer to the flip than is typical for TLT, but still on the less cushioned side. So the dampening effect may be weaker than the net reading suggests if price slips.
Three items stand out in Friday's non-expired flow:
- Oct 23 $80 calls: 44,963 contracts traded against 10,682 open, more than four times the existing open interest. About $3.0 million in premium changed hands. This is the busiest contract in the target expiration, right at the money.
- Oct 23 $80.50 calls: 34,966 traded against 7,051 open, about $1.56 million in premium. Fresh interest just above spot.
- Nov 13 $81 calls and $79 puts: each added roughly 38,700 contracts of open interest on the same day. The matched size suggests a paired position bracketing the current price rather than a one-way bet.
Net, the near-dated call activity is heavy but concentrated around the current price. It reads as traders positioning for a grind higher rather than a breakout.
3 · Technical check
3-day report (target date Oct 21): bullish, target $80.40, projected range $78.70–$81.40. The options-implied range for the October 21 expiration is about $78.85–$81.25. The model's target sits well inside it, so this confirms the lean.
5-day report (target date Oct 23): bullish, target $80.70, projected range $78.00–$82.00. That target also sits inside the options-implied $78.50–$81.60, another confirmation.
Both reports describe a small post-gap flag on light volume. Chaikin money flow has stayed positive since early October, a sign of steady accumulation. Both also flag a bearish MACD crossover and the 50-day average at $80.73 as reasons to expect a slow advance rather than a surge.
Key levels from the reports:
- 3-day: support $79.69, resistance $80.73.
- 5-day: support $79.20, resistance $80.73.
- The dominant 5-day scenario is invalidated on a close below $79.20.
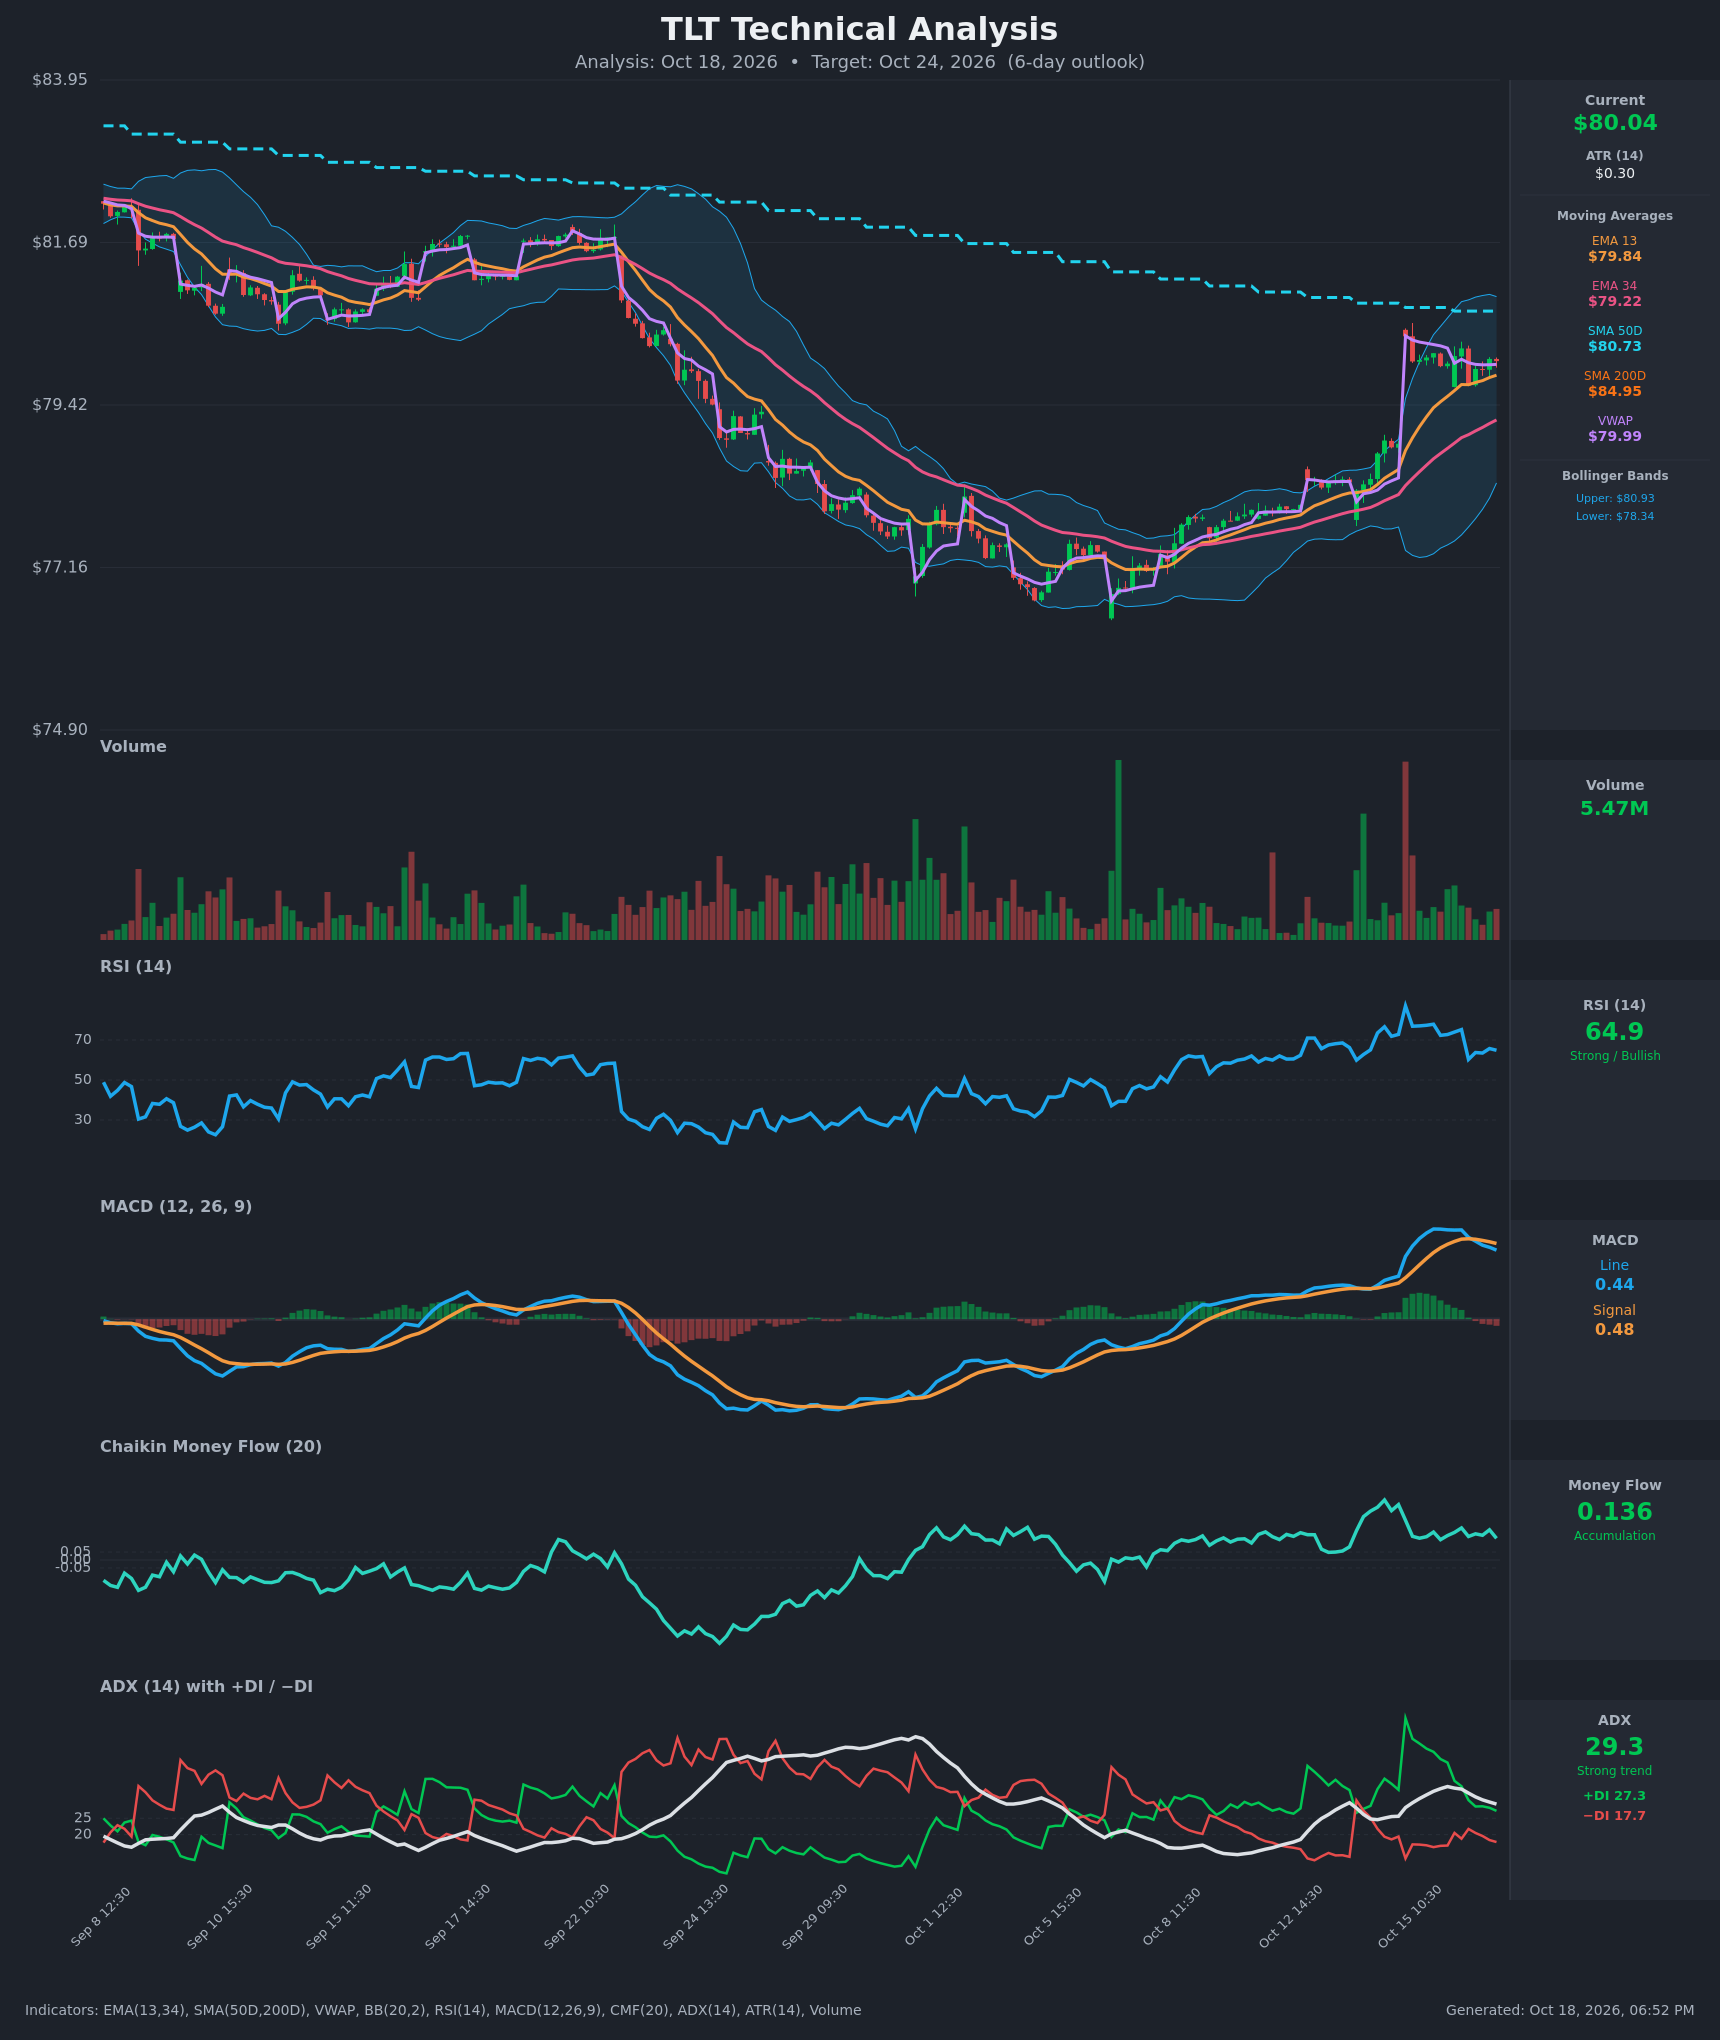
Model vs. Market: The options market implies $78.50–$81.60 into October 23; the 5-day technical model targets $80.70. The two agree on direction and magnitude: a modest drift higher capped near the 50-day average, well short of the $83 call wall.
Because the technical models confirm, the bullish structure's short strike is set at $79.50, just under the 3-day model's $79.69 support, and the condor's call side is shaded above the 5-day model's $80.70 target.
Full technical write-ups: 3-day report → · 5-day report →
4 · Three ways the next five days can go
If TLT pushes above the call wall ($83): That would require a move well past the $81.60 upper rail, through the 50-day average at $80.73 and swing resistance at $82.18. Heavy call open interest at $83 tends to slow rallies as hedgers sell into strength. A clean break would leave thinner positioning above until the $84.58 pivot.
If TLT drifts between the walls: This is the base case the positioning describes. The positive gamma estimate favors pinning, and the single heaviest gamma strike is $80, right at spot. Max pain at $78.50 sits below price, so expiring open interest exerts a mild downward pull into October 23. In practice that suggests a $79–$81 chop, with upside attempts stalling near $80.73–$81.
If TLT breaks below the put wall ($78): To get there, price would first lose $79 (the whole chain's heaviest put strike) and the $78.89 gap base. One rough estimate suggests that below the ~$81 flip, market-maker hedging cushions selling less. A break through $78 would leave little options support until the 52-week low at $76.43.
5 · Three defined-risk structures
Prices are end-of-day midpoints as of October 16, 2026. All structures are hypothetical. Verify live prices before trading; these will be stale by the open.
Premium is rich versus delivered movement, so the credit structures lead. A credit spread collects money up front and profits if the stock stays on the right side of the short strike. A debit spread pays up front for a directional move.
If you lean bullish: Bull put credit spread
- Trade: Sell the Oct 23 $79.50 put, buy the Oct 23 $78.50 put
- Credit: $0.235 ($23.50 per spread) · Max profit: $23.50 · Max loss: $76.50 · Break-even: $79.27
- Why it fits: IV rank of 74 and an 82nd-percentile premium over delivered movement mean you're selling expensive options. Puts are thinning, short-dated sentiment is call-leaning, and the long leg sits at max pain and the lower implied rail.
- Makes sense only if: TLT holds the post-gap consolidation above roughly $79.70.
- Invalidated if: TLT closes below $79.50.
- Managing it: Close at about 50% of max credit. Exit no later than October 22 to avoid expiration-day pin risk. If TLT closes through $79.50, close rather than hope. The week's move runs ahead of a flat-to-down longer trend, so take profits early.
- Liquidity note: The $79.50 puts traded 2¢ wide ($0.35/$0.37) and the $78.50 puts 1¢ wide ($0.12/$0.13). Those are pennies, but on cheap options that is 6–8% of mid, so use limit orders at or near the midpoint.
- Analyze this position →
If you expect the range to hold: Iron condor
- Trade: Sell the Oct 23 $79/$78 put spread and sell the Oct 23 $81.50/$82.50 call spread
- Credit: $0.23 ($23 per condor) · Max profit: $23 · Max loss: $77 · Break-evens: $78.77 and $81.73
- Why it fits: The positive gamma estimate and the heavy $80 gamma strike favor a pin. Rich premium pays you to wait. The long put sits on the October 23 put wall, and the short call sits just inside the $81.60 upper rail, above the 5-day model's $80.70 target.
- Makes sense only if: The post-gap digestion continues and neither the gap base nor the 50-day average breaks decisively.
- Invalidated if: TLT closes below $79.00 or above $81.50.
- Managing it: Take 50% of the credit if offered. If one side is tested, close that side rather than roll into expiration. Exit by October 22 at the latest.
- Liquidity note: The $79 puts traded 1¢ wide and the $81.50 calls 1¢ wide; the $78 puts and $82.50 calls are also 1¢ wide but only 7–8¢ total. Four cheap legs add slippage, so enter as a single limit order.
- Analyze this position →
If you lean bearish: Bear put debit spread
- Trade: Buy the Oct 23 $80 put, sell the Oct 23 $79 put
- Debit: $0.35 ($35 per spread) · Max profit: $65 · Max loss: $35 · Break-even: $79.65
- Why it fits: Max pain at $78.50 sits below spot, Friday's net new open interest leaned toward puts, and both technical reports flag a gap-fill scenario toward $78.90–$79.20. Selling the $79 put offsets part of the rich premium you're paying for the $80 put.
- Makes sense only if: TLT loses the $79.69 consolidation low early in the window.
- Invalidated if: TLT closes above $80.81.
- Managing it: Take profits near $79; this is a counter-lean trade, so don't overstay it. Exit by October 22 if the move hasn't come.
- Liquidity note: The $80 puts traded 3¢ wide ($0.55/$0.58, about 5% of mid) and the $79 puts 1¢ wide. Acceptable, but work the order.
- Analyze this position →
If none of these: no trade
Rich premium is the best argument for selling here, but it is not a free lunch. Spot sits below the ~$81 gamma flip estimate, a little closer than is typical for TLT, so the cushioning that makes short-premium trades comfortable could be thinner than the net gamma reading implies. The short-dated 0–7 day sentiment is also close to flat, so the bullish lean rests mostly on positioning further out.
Each credit structure risks about $3 to collect $1. If you can't watch the position daily and close it on a break of $79, standing aside costs nothing. Selling premium you can't manage is how rich premium turns into a loss.
6 · Quick FAQ
What is TLT's expected move this week? About ±$1.55 (±1.94%) into the October 23 expiration, a $78.50–$81.60 range, per straddle pricing as of the October 16 close.
Is TLT expected to go up or down over the next week? Options positioning as of October 16 leans slightly bullish, because puts are being unwound and 7–30 day sentiment is call-heavy. That is a read of what traders have done, not a forecast. The actionable map is the $78.50–$81.60 range, $78 support, and $83 resistance.
Are TLT options expensive right now? Yes. An IV rank of 74/100 means option prices are higher than about 74% of the past year's range. On top of that, they're running about 3.4 vol points above the movement TLT has actually delivered, richer than 82% of this ETF's own recent readings. That favors premium-selling structures.
Where is TLT's biggest options support and resistance? For the October 23 expiration, the put wall is $78 and the call wall is $83. Across the whole chain, the heaviest put strike is $79.
What invalidates this week's read? A TLT close below $79.00.
Methodology & disclosures. Data: end-of-day options-chain snapshot for TLT, 2026-10-16, generated 2026-10-18T18:52:40.775Z. Prices shown are midpoints and will differ from live markets. Momentum/positioning scores and volatility-premium comparisons are descriptive measurements of past option flow and past price movement — not investment advice, signals, forecasts, or guarantees. All trade structures are hypothetical. Every structure shown has a defined maximum loss; you can lose the entire max-loss amount. Options involve substantial risk and are not suitable for all investors.