TLT Options Are Pricing a $1.20 Move Into Sept 25 — And the Chart Model Disagrees
The options market implies an $80.05–$82.45 range for TLT into the September 25 expiration, with the heaviest put open interest parked right under Friday's close. Here's what the positioning says, where the chart model dissents, and three defined-risk ways to trade the next five days.
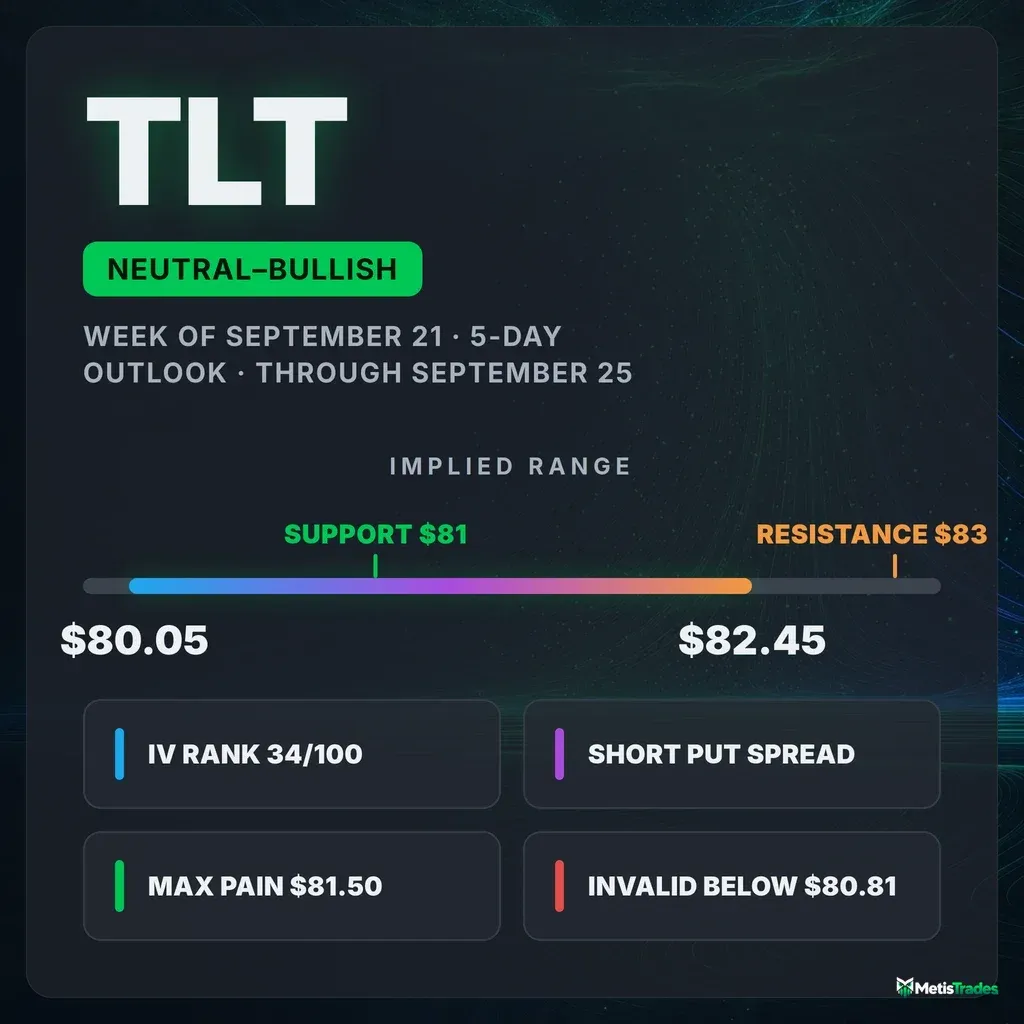
The options market implies an $80.05–$82.45 range into the September 25 expiration; here's what's driving it, where the chart model pushes back, and three defined-risk ways to trade it.
Published Sunday, September 20, 2026 · Data as of Friday, September 18 close
Explore the live TLT options data in the Detailed Options Analyzer →
Quick answer
| Item | Answer |
|---|---|
| Market bias | Neutral with a bullish tilt |
| Options-implied range (into Sep 25) | $80.05 – $82.45 (±1.48%, or about ±$1.20) |
| Spot / last close | $81.25 |
| Major support | $81.00 (put wall, Sep 25 expiration) |
| Major resistance | $83.00 (call wall, Sep 25 expiration) |
| Max pain (Sep 25) | $81.50 |
| Dealer gamma regime (estimate) | Negative for the Sep 25 expiration — hedging there tends to amplify moves; the whole-chain estimate reads positive with a flip level ≈ $83.00 |
| Volatility condition | Neutral — IV rank 34/100 · premium rich: options priced about 2.2 vol points above delivered movement |
| Technical check | Diverges (bearish, 3-day and 5-day chart models) |
| Best-fitting strategy | Short put spread — sell the Sep 25 $81 put, buy the $80 put |
| Analysis invalidated if | TLT closes below $80.81 |
1 · What matters today
TLT closed Friday, September 18 at $81.25, and the options market is pricing a move of roughly $1.20 either way through the September 25 expiration — an $80.05 to $82.45 band. That is a quiet week by any standard. Our read of options flow lands neutral with a slight upward tilt: positioning, momentum and short-dated sentiment are all close to flat, but the heaviest pile of open put contracts sits at $81.00, just under the close, and call open interest has been building steadily further out. The one number that changes the picture is $80.81. Below that, the bounce off the recent lows has failed and the put wall stops acting like a floor. One caveat worth knowing up front: both of our chart models read this tape as bearish, which is the most interesting tension in the data this week.
2 · What the options market is pricing
What changed this week
TLT is up 0.47% over the last five sessions and down 1.32% over the last twenty — a bounce inside a slow grind lower. Implied volatility, the market's estimate of how much TLT will move that is baked into option prices, jumped 4.6% on Friday alone to 11.2% at the money, though it's only up 1.1% over five days and down 0.8% over thirty. Put/call volume came in at 0.66 — for every call contract traded there were roughly two-thirds as many puts — which is almost exactly its 7-day average of 0.66 and a touch above the 14-day 0.62. Put/call open interest sits at 0.70, below its 14-day average of 0.76: the stock of open put contracts has been shrinking relative to calls.
The single loudest positioning change wasn't in our window at all. The October 16 $83 calls added 55,185 contracts of open interest in one session, with the October 16 $82 calls adding another 37,419 and the October 23 $83 calls 25,260. That is a large, deliberate build of upside exposure a month out, and it is the clearest directional footprint in the file. Closer in, the September 25 $83 calls added 10,988 contracts. (For historical context only: into Friday's expiration, the $81.50 calls shed 9,640 contracts of open interest as they settled.) Total option volume ran 0.93× its 20-day average, so none of this came on a volume surge. The short-, medium- and long-horizon trend reads all come back flat — price is up 0.5% over the past week, down 1.3% over the past month and down 3.8% over the past two and a half months, with no horizon showing a clear direction.
Expected move
Into September 25, the options market is pricing a move of ±1.48%, or about ±$1.20 around the $81.25 close — that figure is derived from what straddles cost at the money. Here is how the rungs stack up:
| Expiration | Implied move | Range around $81.25 |
|---|---|---|
| Sep 21 | ±0.58% | $80.78 – $81.72 |
| Sep 23 | ±1.05% | $80.40 – $82.10 |
| Sep 25 (our window) | ±1.48% | $80.05 – $82.45 |
| Oct 16 | ±3.11% | $78.72 – $83.78 |
The ladder scales smoothly with time — no kinks, no humps, nothing that looks like the chain bracing for a specific dated event. For a long-duration Treasury ETF, that smoothness is the normal state and it's worth noticing when it's there.
Volatility
At-the-money implied volatility is 11.2%, with an IV rank of 34/100 — meaning today's reading is cheaper than about 66% of the past year's readings. The 52-week percentile is higher at 64, so TLT has spent more days below this level than the rank alone suggests; the rank is dragged down by a handful of high-volatility spikes over the past year. Current IV sits just above its 30-day average of 11.1% and clearly above its 90-day average of 10.5%. The front-month read is unavailable today — Friday was an expiration day, and front-month at-the-money IV can't be interpolated from a contract expiring that afternoon, so the term-structure comparison across expirations returns next session.
Meanwhile, TLT itself has been unusually still. Twenty-day realized volatility — how much the fund has actually moved — is 9.03%, an unusually depressed reading versus this ETF's own recent norm, though the 5-day-to-20-day ratio of 1.16 says movement has been picking up slightly in the last week.
Premium rich or cheap. The gap between what options are priced for and what TLT has actually delivered — the volatility risk premium — sits at about 2.2 vol points in favor of sellers: option prices imply roughly 11.2% annualized movement against 9.0% delivered over the past month. When that gap is positive, option sellers have been collecting more than realized movement cost them. Today's gap is richer than about 82% of this ETF's own readings over the past few months, and it has been positive and broadly widening for the past two weeks (it was slightly negative on August 31). That combination — a middling IV rank of 34 but an 82nd-percentile premium over delivered movement — argues for collecting premium rather than owning it this week, and it's why the credit structures lead the trade section below.
Skew and sentiment
Puts and calls the same distance from the price don't cost the same here. The 25-delta put is marked at 12.0% implied volatility against 10.7% for the 25-delta call — a gap of about 1.2 vol points, against a 60-day median of roughly 0.2 vol points for this name. Traders are paying up for downside protection at a pace that is unusually steep versus TLT's own recent history; on our reading of flow, this is the most stretched single input in the file, and it's the one signal pulling against the bullish tilt.
Against that, the flow itself leans the other way. Call open interest grew by 161,733 contracts on Friday versus 9,366 for puts. Six call contracts cleared the unusual-volume bar against three puts — a call-tilted sweep profile that is running well above this ETF's own norm. Sentiment in short-dated options splits the difference: the 0–7 day bucket reads mildly negative at −8 while the 7–30 day bucket reads +16 and the 30–60 day bucket +37, which the model summarizes as a Mixed regime. In plain terms: the very front of the curve is hedged, and everything past a week is positioned for a bounce.
The key levels map
| Level | Price | Why it matters |
|---|---|---|
| 200-day average | $85.87 | 5.4% overhead and sloping down — the big-picture trend cap |
| Swing resistance | $83.20 | Next pivot cluster above the call wall |
| Call wall (Sep 25) | $83.00 | 16,872 call contracts open here for our expiration; it is also the whole chain's heaviest call strike at 434,624 — the two agree, which is unusual and makes this the week's firmest ceiling. One rough estimate also places the dealer gamma flip here |
| 50-day average | $82.61 | 1.65% above the close, declining |
| Implied range high | $82.45 | Top of the options-implied band into Sep 25 |
| Swing resistance | $82.32 | Nearest chart pivot — the first real test on a push higher |
| Largest gamma strike | $82.00 | Chain-wide, the single strike with the most gamma·open-interest — a natural magnet |
| 20-day average | $81.96 | 0.86% above the close |
| Max pain (Sep 25) | $81.50 | Where the most option value would expire worthless; expirations sometimes gravitate toward it |
| Spot / last close | $81.25 | Friday, September 18 close |
| Put wall (Sep 25) | $81.00 | 37,559 put contracts open for our expiration — the biggest pile below the price, and again the whole chain agrees (236,880) |
| Swing support | $80.81 | The level that invalidates this read on a close below |
| 52-week low | $80.46 | TLT sits just 0.98% above it; range position 7/100 |
| Implied range low | $80.05 | Bottom of the options-implied band into Sep 25 |
Positioning and unusual flow
Market makers hedge the options they've sold, and the direction of that hedging depends on their net position. For the September 25 expiration specifically, the dealer gamma estimate comes back negative, meaning hedging flows through that expiration would tend to amplify moves rather than cushion them. The whole-chain aggregate estimate reads the other way — positive, with an estimated flip level near $83.00 — so the two disagree, and the one that governs this week's expiry is the negative read. Both figures are estimates built on an assumed dealer sign convention, not observed inventory, so treat them as texture rather than fact.
Three live flow items stand out. First, the September 25 $81.50 calls traded 37,797 contracts against just 4,620 open — more than eight times turnover, and $1.38 million of premium, the largest single contract in the file. Second, the September 25 $82 calls traded 38,056 against 15,332 open. Both are just above spot and both expire in our window: that is short-dated upside positioning, not hedging. Third, on the other side, the September 28 $79.50 puts traded 970 against 219 open — small in dollars, but a clean example of the downside insurance the skew reading is already flagging.
3 · Technical check
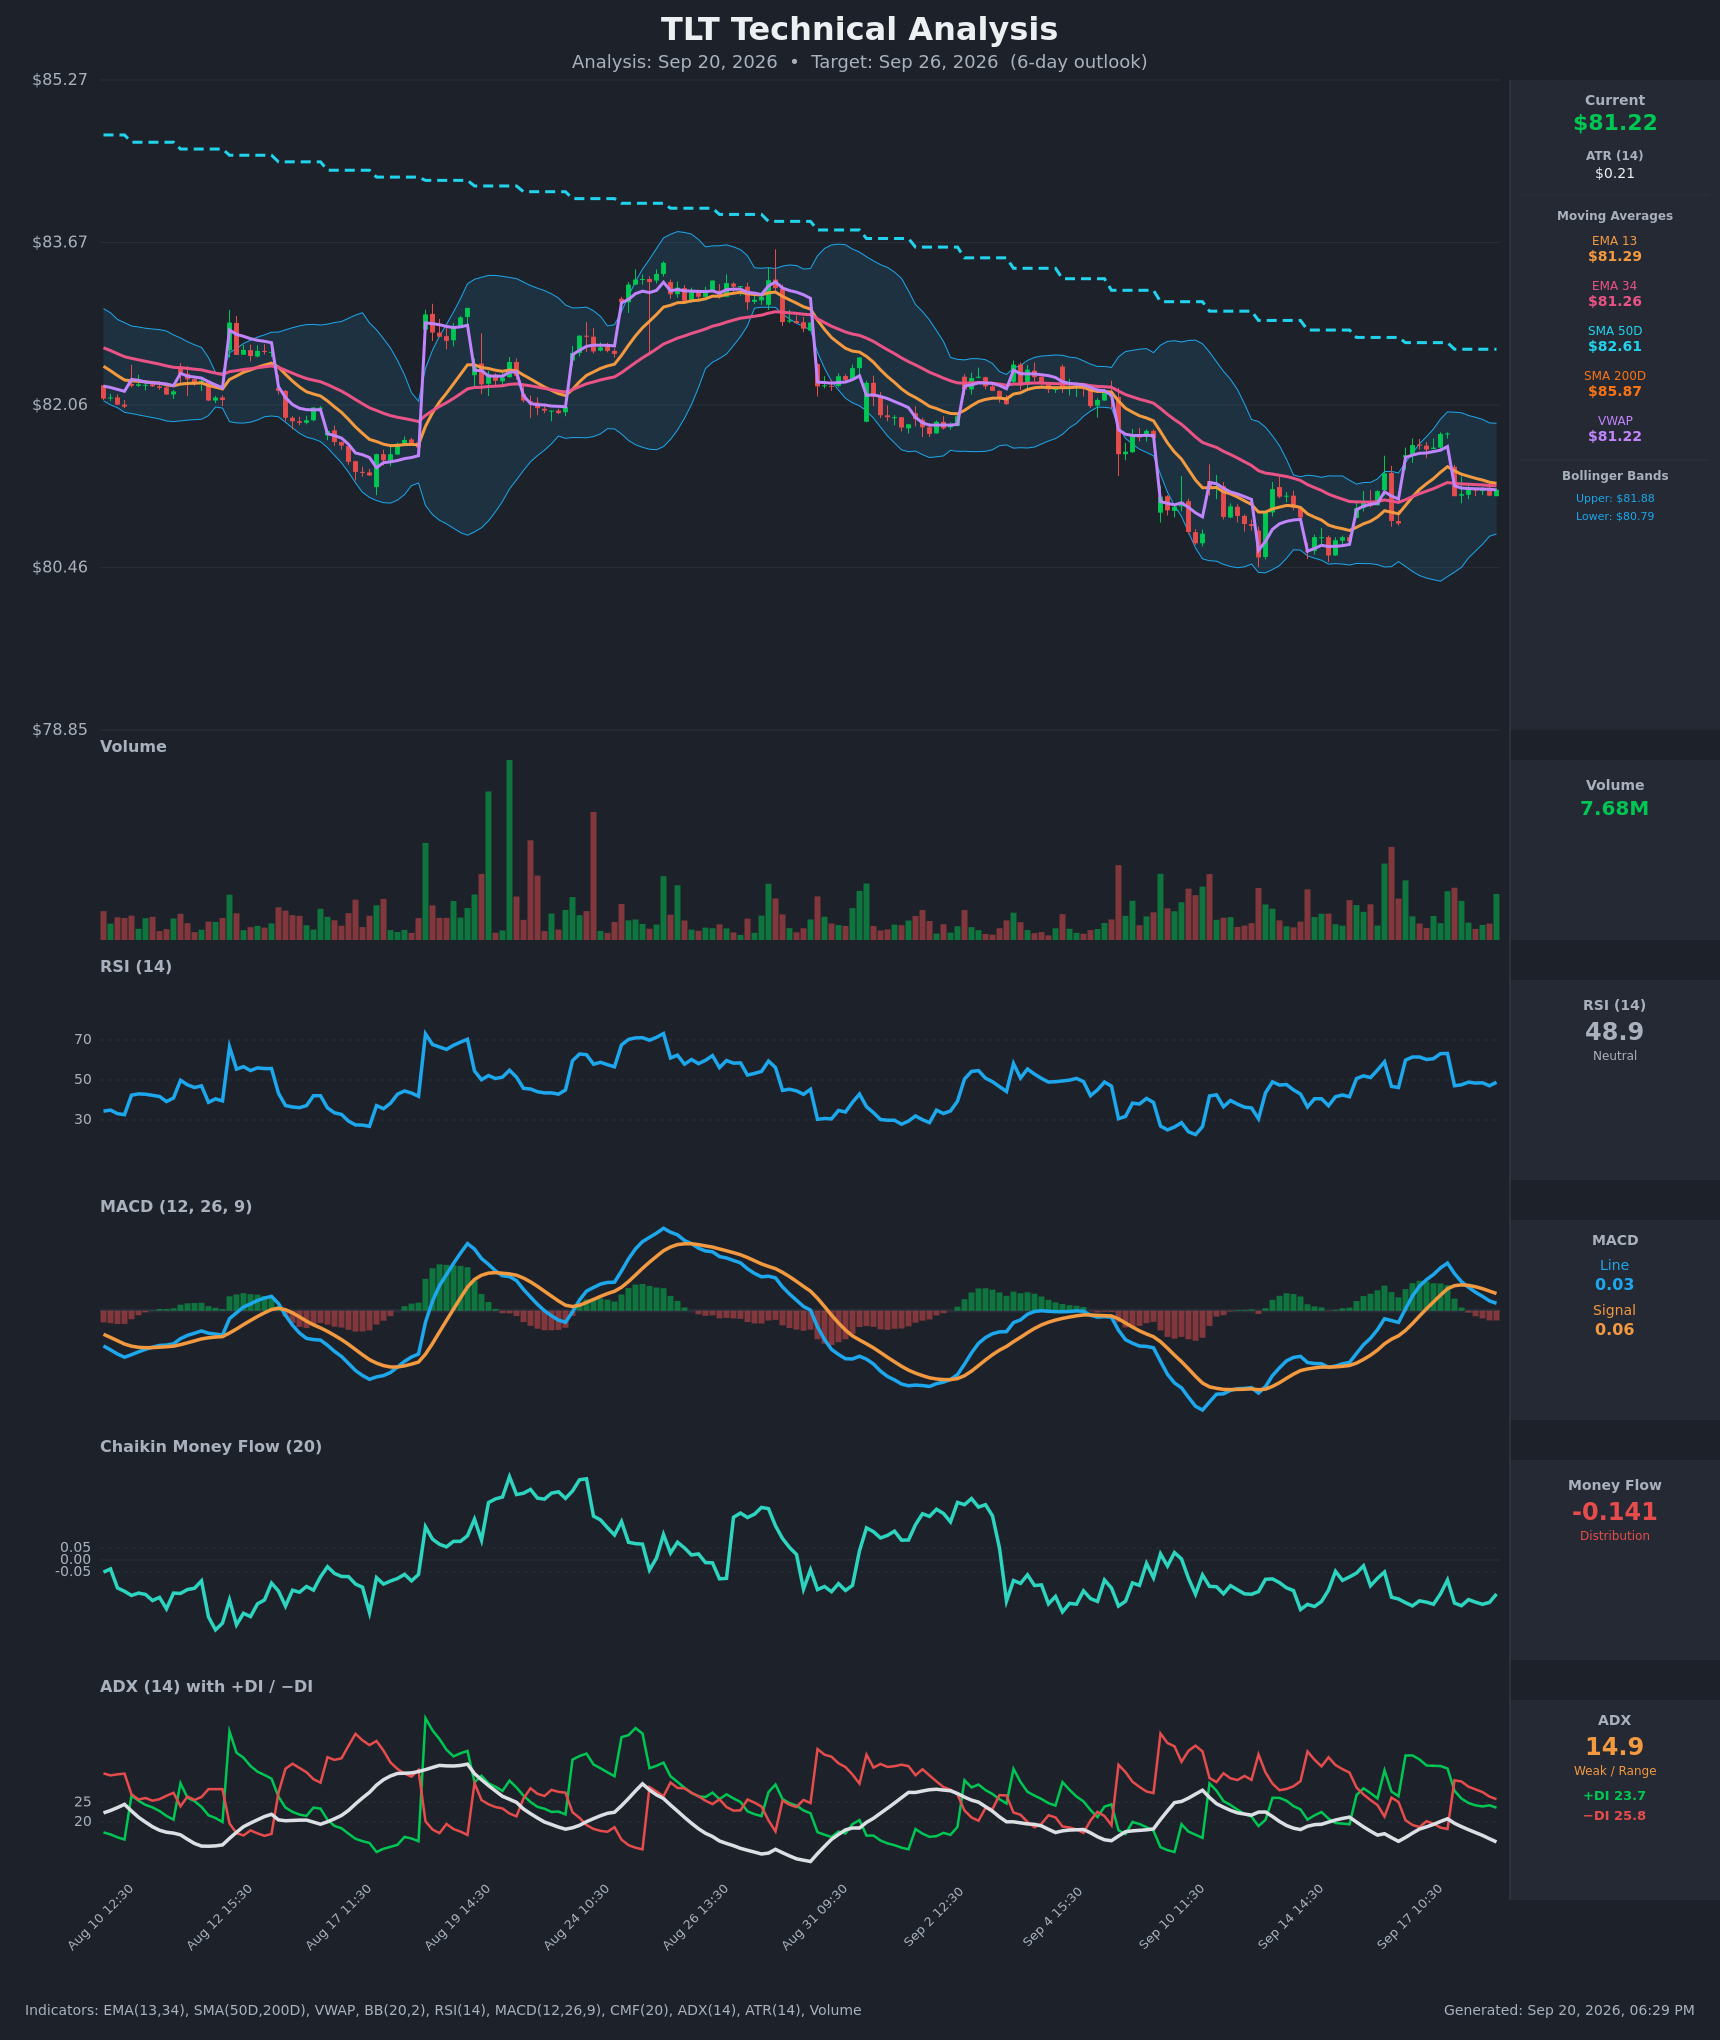
Both chart models read this tape bearish, and both are fresh (dated September 20 against a September 18 options snapshot). The 3-day model targets $80.85 by September 23, with a projected range of $79.90 to $82.50. The 5-day model — which lands exactly on our expiration date — targets $80.70 with a projected range of $79.75 to $82.55. Their reference price of $81.22 is within a rounding error of the options snapshot's $81.25, so the two data sets are describing the same close.
The reasoning is consistent across both: MACD crossed below its signal line on September 18 after peaking the day before, Chaikin Money Flow has stayed negative at −0.14 for weeks (sustained distribution, even through the bounce), and the −DI line sits marginally above +DI. The counterweight the reports themselves supply is ADX at 14.9 — well under 20, which describes a market with no trend at all. Their own dominant scenario invalidates on a close back above $81.90.
Classification: Diverges. Direction contradicts our options read. But note where the disagreement actually lives: the 5-day model's $80.70 target sits comfortably inside the $80.05–$82.45 implied range, and its projected range is nearly identical in width to what options are pricing. This is not a fight about magnitude — both sides expect a quiet week. It's a fight about which end of a narrow band gets tested.
Model vs. Market: The options market implies $80.05–$82.45 into September 25; the 5-day technical model targets $80.70. The gap resolves at $81.00 — if the put wall holds through midweek, the options positioning read wins; if TLT closes through $80.81, the chart model was right and this article's thesis is dead.
Practically, the divergence did one thing to the trade structures below: it kept every short strike at or below the put wall rather than above it, and it shortened the leash on the bullish structure's management plan.
Full technical write-ups: 3-day report → · 5-day report →
4 · Three ways the next five days can go
If TLT pushes above the call wall ($83.00): That strike carries the heaviest call open interest both for this expiration and across the entire chain, and strikes like that tend to slow rallies as hedging flows lean against the move. A clean break through it would leave thinner positioning overhead until the swing resistance at $83.20 and the 50-day average at $82.61 — which price would already have cleared — and would sit well outside the top of the implied range. Getting there inside five days would require roughly double the move options are pricing.
If TLT drifts between the walls: This is the base case the positioning describes. Max pain for September 25 is $81.50, a quarter above Friday's close, and the chain's single largest gamma strike sits at $82.00 — both above spot, both acting as mild magnets into Friday. Expiring open interest is heavily concentrated between $81.00 and $83.00, which is exactly the zone that generates the most pinning pressure as the week runs down.
If TLT breaks below the put wall ($81.00): The floor becomes a trapdoor. Spot already sits about 3.4% below the whole-chain gamma flip estimate near $83.00 — the fragile side of that estimate, where market-maker hedging is thought to accelerate selling rather than cushion it — and the September 25 expiration's own dealer gamma estimate is negative as well. The 52-week low at $80.46 is only 0.98% below the close, and the bottom of the implied range sits at $80.05. That is not much cushion, and it's the scenario both chart models are pointed at.
5 · Three defined-risk structures
Prices are end-of-day midpoints as of Friday, September 18. All structures are hypothetical. Verify live prices before trading — these will be stale by the open.
If you lean bullish: short put spread at the put wall
- Trade: Sell the Sep 25 $81 put / buy the Sep 25 $80 put
- Credit: $0.245 ($24.50 per spread) · Max profit: $24.50 · Max loss: $75.50 · Break-even: $80.755
- Why it fits: You collect premium at the exact strike holding 37,559 open put contracts for this expiration — the level the chain itself treats as the floor — and the premium you're selling is rich: options are priced about 2.2 vol points above what TLT has actually delivered, richer than roughly 82% of this ETF's own recent readings. The break-even at $80.755 sits below both the swing support at $80.81 and the put wall.
- Makes sense only if: you believe the $81.00 shelf holds through Friday. The short strike is essentially at the money, so this is a directional bet dressed as an income trade — size it accordingly.
- Invalidated if: TLT closes below $80.81.
- Managing it: Close at roughly 50% of max credit. Given that the near-term chart read fights this position and no horizon of the trend read is pointed up, take profits early rather than holding for the last few cents, and close — don't hope — if TLT settles below $81.00 on any daily close.
- Liquidity note: The $81 puts quoted 2¢ wide (bid $0.31 / ask $0.33) on 8,313 contracts and $266,016 of traded premium; the $80 puts quoted a penny wide on $0.07/$0.08. Those percentages look wide only because the contracts are cheap — the tick is the floor, not the liquidity.
- Analyze this position →
If you expect the range to hold: iron condor around max pain
- Trade: Sell the Sep 25 $80.50 put / buy the $79.50 put, and sell the Sep 25 $82.50 call / buy the $83.50 call
- Credit: $0.20 ($20 per condor) · Max profit: $20 · Max loss: $80 · Break-evens: $80.30 and $82.70
- Why it fits: An iron condor collects premium for the market staying inside a band — you keep the credit if TLT finishes between the short strikes. Those strikes straddle the $81.50 max pain level, the short call sits just above the top of the implied range, and the short put sits above the 52-week low. With the premium-over-delivered-movement gap in the 82nd percentile and realized volatility unusually depressed for this ETF, this is the structure that gets paid for the market doing nothing — which is what both the implied range and the near-flat trend reads describe.
- Makes sense only if: you're comfortable with a $20-for-$80 risk profile, and you accept that the negative dealer gamma estimate for this expiration argues moves get amplified, not dampened, if either rail breaks.
- Invalidated if: TLT closes outside $80.81 or $82.32 — the swing support and resistance that bracket the condor's profitable zone.
- Managing it: Close at roughly 50% of max credit, or by Wednesday September 23 regardless, when the remaining premium no longer compensates for expiration-week gamma risk. If one side is breached, close that side rather than rolling into a narrower band.
- Liquidity note: The $80.50 puts quoted $0.16/$0.17 on 3,306 contracts; the $82.50 calls $0.09/$0.10 on 2,091. The $79.50 put and $83.50 call wings are penny-tick markets — enter as a package, never leg in.
- Analyze this position →
If you lean bearish: short call spread under the call wall
- Trade: Sell the Sep 25 $82 call / buy the Sep 25 $83 call
- Credit: $0.15 ($15 per spread) · Max profit: $15 · Max loss: $85 · Break-even: $82.15
- Why it fits: This is the structure that sides with both chart models, which target $80.85 and $80.70. The short strike sits just under the $82.32 swing resistance and the $82.45 implied-range high; the long leg is parked at $83.00, the call wall, where the heaviest call open interest in the entire chain would have to be chewed through. You're also selling into the same rich premium the other two structures exploit.
- Makes sense only if: you think the 20-day average at $81.96 caps this bounce. Be honest about the risk/reward — $15 against $85 is a low-payout trade that needs a high hit rate to work.
- Invalidated if: TLT closes above $82.32.
- Managing it: Close at roughly 50% of max credit. Because this position fights the call-side open-interest build we flagged above — 38,056 contracts traded in the September 25 $82 calls alone — treat a decisive close above $81.96 as a reason to exit early rather than wait for the break-even.
- Liquidity note: The $82 calls quoted $0.18/$0.21 (3¢ wide, about 15% of mid) on enormous volume of 38,056; the $83 calls quoted $0.04/$0.05 on 2,719. The percentage spread on the short leg is the one real slippage cost here — work the mid, don't hit the ask.
- Analyze this position →
If none of these: no trade
The case for standing aside is real even with rich premium on offer. The implied move into September 25 is ±$1.20 — the entire tradeable band is about 2.4% wide, and every credit structure above collects between $15 and $25 against $75 to $85 of risk. That is a narrow reward for expiration-week gamma exposure in a name sitting 0.98% above its 52-week low, with the dealer gamma estimate for this specific expiration pointed at amplification rather than pinning. Premium being richer than 82% of recent readings is a genuine edge on average, but it is a thin one on a five-day hold when the commission and slippage on four legs can eat a quarter of the credit. If you can't get filled near the mid, or if you'd be sizing up to make the dollars interesting, the honest answer is to wait for the October expirations — where the $83 call build is happening and where premium has more room to decay.
6 · Quick FAQ
What is TLT's expected move this week? About ±$1.20, or ±1.48%, into the September 25 expiration — an $80.05 to $82.45 range around Friday's $81.25 close, per what at-the-money straddles cost as of September 18.
Is TLT expected to go up or down over the next five days? Options positioning as of September 18 leans neutral with a slight upward tilt — the put wall sits right under the price, call open interest is building, and short-dated sentiment past one week is positive — but that's a read of what traders have done, not a forecast. Both chart models disagree and lean bearish toward $80.70–$80.85. The actionable map is the $80.05–$82.45 range and the $81.00 / $83.00 levels.
Are TLT options expensive right now? Two lenses. IV rank of 34/100 says option prices are lower than about 66% of the past year's readings. But on top of that, they're running roughly 2.2 vol points above the movement TLT has actually delivered over the past month — richer than about 82% of this ETF's own recent readings. Cheap in absolute terms, rich relative to what the fund is doing: a seller's setup, not a buyer's.
Where is TLT's biggest options support and resistance? Put wall at $81.00 and call wall at $83.00 for the September 25 expiration. Unusually, the whole chain agrees on both strikes, which makes them firmer than a single-expiration read would be.
What invalidates this week's read? A close below $80.81.
Methodology & disclosures. Data: end-of-day options-chain snapshot for TLT, 2026-09-18, generated 2026-09-20T18:29:14.685Z. Prices shown are midpoints and will differ from live markets. Momentum/positioning scores and volatility-premium comparisons are descriptive measurements of past option flow and past price movement — not investment advice, signals, forecasts, or guarantees. All trade structures are hypothetical. Every structure shown has a defined maximum loss; you can lose the entire max-loss amount. Options involve substantial risk and are not suitable for all investors.