TQQQ Options Are Pricing a $5.22 Move Into September 21 — The Chart Model Sees Half That
Options on TQQQ imply a $65.76–$76.20 range into the September 21 expiration, but max pain sits at $71.00 — a penny above Friday's close. Here's what the positioning data shows, where the real levels are, and three defined-risk ways to trade a market that is priced richer than it has been moving.

The options market implies a $65.76–$76.20 range into the September 21 expiration; here's what's driving it and three defined-risk ways to trade it.
Published Sunday, September 13, 2026 · Data as of Friday, September 11, 2026 close
Explore the live TQQQ options data in the Detailed Options Analyzer →
Quick answer
| Item | Answer |
|---|---|
| Market bias | Neutral |
| Options-implied range (into Sept 21) | $65.76 – $76.20 (±7.36%, or ±$5.22 around the $70.98 close) |
| Major support | $60.00 — the Sept 21 expiration's put wall |
| Major resistance | $80.00 — the Sept 21 expiration's call wall |
| Max pain (Sept 21) | $71.00 |
| Dealer gamma regime (estimate) | Positive — one rough estimate suggests hedging tends to dampen moves; flip level ≈ $74 |
| Volatility condition | Falling — IV rank 21.6/100 · premium rich: options priced about 13.3 vol points above delivered movement |
| Technical check | Mixed (bullish, 4-day and 7-day chart models) |
| Best-fitting strategy | Iron condor with short strikes near the expected-move rails — conditional on the range holding |
| Analysis invalidated if | TQQQ closes below $68.09 |
1 · What matters today
TQQQ closed Friday, September 11 at $70.98, and the options market is pricing roughly $5.22 up or down by the September 21 expiration — a $65.76 to $76.20 band. The single most striking number in the file is max pain: $71.00, a penny above the close. That is the price at which the most option value would expire worthless, and expirations sometimes gravitate toward it. Our five-input read of flow, skew, and positioning lands squarely neutral — the signals genuinely disagree this week rather than lining up.
The one thing that would change the picture is a close below $68.09, the next swing-support shelf; below that the pin case stops making sense. Both chart models lean mildly bullish, but both target prices land inside the options range, so they add nuance rather than conflict.
2 · What the options market is pricing
What changed this week
The past two sessions were a whipsaw: TQQQ gapped down 3.70% on September 10, then gapped up 2.86% the next morning and closed at $70.98 — net, the ETF is down 1.46% over five sessions and down 8.00% over twenty. Total option volume on Friday ran 2.03× its 20-day average, so this was an active tape, not a drifting one.
The clearest flow shift is in open interest — contracts currently held open. The put/call open-interest ratio sits at 0.74, meaning for every 100 call contracts held open there are 74 puts. Five sessions ago that figure was 1.03, and the trailing 14-day average is 1.01. Puts have been closed or allowed to roll off at a rapid clip; that is a meaningful de-hedging, and it registers as unusually pronounced against this ETF's own recent history. Put/call volume, by contrast, was ordinary at 0.77 versus a 7-day average of 0.80.
The biggest single open-interest build among live contracts was the September 18 $65 puts, up 8,597 contracts to 18,080 on 3,856 lots traded — downside insurance being restocked a full $6 below spot. On the other side, the September 18 $73.50 calls added 4,486 contracts to 20,541 on 16,956 lots. Further out, the October 2 $60 puts added 2,934 contracts to 18,129 on $859,000 of premium. Traders are buying cheap wings on both ends while thinning the near-the-money protection.
One piece of tension worth naming: momentum flipped back to a bullish reading on September 4 — a fresh crossover — but the 20-day and 50-day trend reads are both still bearish, with price down 8.0% and 8.1% over those windows. The near-term flow and the bigger trend are not pointing the same way, which argues for shorter-dated structures rather than anything that needs weeks to work.
Expected move
The expected move is the move the options market is pricing in, derived from what straddles cost. Into the September 21 expiration, that is ±7.36%, or ±$5.22 around the $70.98 close — a $65.76 to $76.20 range. Here is the ladder of live expirations:
| Expiration | Implied move | Range around $70.98 |
|---|---|---|
| Sept 14 (3 days) | ±2.66% | $69.09 – $72.87 |
| Sept 18 (7 days) | ±6.79% | $66.16 – $75.80 |
| Sept 21 (10 days — this article's horizon) | ±7.36% | $65.76 – $76.20 |
| Oct 16 (35 days) | ±16.38% | $59.35 – $82.61 |
The rungs scale roughly the way pure time decay says they should — no single expiration juts out of line with a premium hump, which is what you would expect for a fund with no scheduled report of its own on the calendar.
Volatility
At-the-money implied volatility — the market's estimate of how much TQQQ will move, baked into option prices — sits at 51.3%. That sounds high in absolute terms, but for this ETF it is cheap: IV rank is 21.6/100, meaning today's reading is lower than roughly 78% of the past year's, and the IV percentile is even lower at 13.5. Implied vol fell 12.7% in a single session on Friday, is up just 1.6% over five days, and is down 30.5% over thirty. It sits below both its 30-day average (57.0%) and its 90-day average (65.5%). The 60-day tenor prints 55.0%. The front-month read is unavailable today because Friday was an expiry day — a calendar artifact, not missing data.
Against this ETF's own history, the striking number is realized movement: 20-day realized volatility is 37.98%, roughly two standard deviations below this fund's own recent norm. A triple-leveraged Nasdaq fund delivering under 38% annualized is an unusually quiet TQQQ. The 5-day-over-20-day realized ratio of 0.89 says the last week has been quieter still. For context on the broader vol complex, the volatility index closed at 15.84 and sits at rank 13/100 of its own 52-week range, and it has tracked this fund's implied vol closely (60-day correlation 0.83).
Premium: rich. The volatility risk premium — the gap between how much movement options are priced for and how much TQQQ has actually delivered — is +13.3 vol points (51.3% implied against 37.98% realized). When that gap is positive, option sellers have been collecting more than realized movement cost them. Where does that sit versus this fund's own recent readings? At the 79th percentile — richer than about 79% of them, and notably above its own norm on the snapshot reading too. The path matters: the gap was negative through late August (about −1.9 points on August 31), flipped firmly positive on September 1 as the ETF's daily ranges compressed, peaked near +19.9 points on September 10, and pulled back to +13.3 on Friday when implied vol dropped. So the two lenses genuinely disagree — IV rank 21.6 says options are cheap versus the past year, while a 79th-percentile premium over delivered movement says they are rich versus what the stock has actually been doing. That combination favors collecting premium in defined-risk form this window, not owning it.
Skew and sentiment
Skew measures the fact that puts and calls the same distance from the stock price don't cost the same; when puts are pricier, traders are paying up for crash protection. Here, 25-delta puts carry 61.0% implied vol against 45.3% for 25-delta calls — a 15.7 vol point gap. That is marginally flatter than this ETF's own 60-day median of 16.1 points, and close to the 14-day average of 15.9. Translation: downside protection is expensive in absolute terms, as it always is for a leveraged fund, but not unusually so right now. One caveat from the leading-positioning read: that skew has steepened by about 2.4 vol points over the past five sessions, so put demand has been quietly rebuilding even as the level stayed near normal.
Sentiment across the curve is recovery-shaped rather than uniformly directional. Our read of short-dated positioning scores the 0–7 day bucket mildly positive and the 7–30 day bucket weakly positive, with the 30–60 day window slightly negative and the longest bucket the most constructive of the four. Behind the front bucket: 25-delta risk reversals showing calls about 19.6 vol points richer relative to their own baseline, call open interest building faster than put open interest, but delta-weighted volume tilting to the put side. Those cross-currents are exactly why the composite read lands neutral.
The key levels map
One important note first: the September 21 expiration's own walls are thin. Its call wall — the strike with the biggest pile of open call contracts — is $80.00 with 3,516 contracts, and its put wall is $60.00 with only 216. Across the whole chain, the heaviest strikes are very different: $75.00 on the call side (64,709 contracts) and $65.00 on the put side (60,328). Both are quoted below, labelled.
| Level | Price | Why it matters |
|---|---|---|
| Swing resistance | $81.54 | Upper end of the recent swing-pivot cluster |
| Call wall (Sept 21 expiration) | $80.00 | Heaviest call open interest at the horizon expiry (3,516) — but sits outside the implied range |
| Swing resistance | $76.83 | Prior reaction zone |
| Top of implied range (Sept 21) | $76.20 | One standard deviation up, per straddle pricing |
| Whole chain's heaviest call strike | $75.00 | 64,709 contracts and the single largest gamma strike — the practical overhead magnet |
| Gamma flip estimate | ≈ $74.00 | Estimate only — the pivot in one rough model of market-maker hedging |
| Swing resistance | $73.71 | Nearest structural cap |
| 20-day moving average | $71.67 | Price is 0.96% below it |
| Max pain (Sept 21) | $71.00 | Where the most option value expires worthless — essentially at spot |
| 50-day moving average | $71.05 | Price is 0.10% below it — a dead heat |
| Last close | $70.98 | Friday, September 11 |
| Swing support | $70.84 / $69.57 | The two nearest shelves under the market |
| Swing support (invalidation) | $68.09 | A close below breaks the range read |
| Whole chain's heaviest put strike | $65.00 | 60,328 contracts, and where Friday's largest live OI build landed |
| Bottom of implied range (Sept 21) | $65.76 | One standard deviation down |
| Put wall (Sept 21 expiration) | $60.00 | Heaviest put open interest at the horizon expiry, but only 216 contracts — thin |
Positioning and unusual flow
Market makers hedge the options they've sold, and the direction of that hedging depends on their net position. One rough estimate here puts dealer gamma positive — the regime in which hedging tends to dampen moves rather than amplify them — both across the full chain and, separately, at the September 21 expiration itself. That estimate's pivot, the gamma flip level, sits around $74, with spot about 4% beneath it, a wider gap than this fund typically runs. Treat all of that as an estimate built on an assumed dealer positioning convention, not as observed inventory.
Three pieces of live flow stood out on Friday:
- September 14 $71 puts: 11,025 contracts traded against 155 open — a 71× turnover and $843,000 of premium. Whoever did that wanted very short-dated protection right at the money, and it was opened and mostly closed inside the session.
- September 18 $73.50 calls: 16,956 traded with open interest up 4,486 to 20,541, alongside $1.73 million of premium in the $73 calls. That is where the upside crowd is parked for this week.
- October 2 $60 puts: 9,869 traded, open interest up 2,934 to 18,129, $859,000 of premium — cheap tail protection roughly 15% below spot.
3 · Technical check
Both chart models lean mildly bullish, and both land inside the options-implied band. The 4-day model targets $71.30 by September 18 with a projected range of $68.85–$73.30. The 7-day model, which matches this article's September 21 horizon, targets $71.60 with a projected range of $68.60–$74.20. Both flag the same picture: RSI at 49.75 sitting on the midline, MACD below zero but curling up, ADX at 24.6 with the bearish directional line only narrowly ahead after a sharp compression, and Chaikin Money Flow at 0.126 showing steady accumulation through a flat tape. The most decisive read of the bunch is that money-flow divergence — buying persisted through the September 10 selloff.
Classification: mixed. Direction diverges (bullish charts against a neutral options read), but magnitude confirms — both targets sit within a dollar of max pain at $71.00, and both projected ranges nest comfortably inside the options band. That is a chart model describing a pin, not a rally.
Model vs. Market: The options market implies $65.76–$76.20 into September 21; the 7-day technical model targets $71.60 inside a $68.60–$74.20 band. The chart model is pricing roughly half the range the options are — which is the clean argument for selling the wings rather than buying direction.
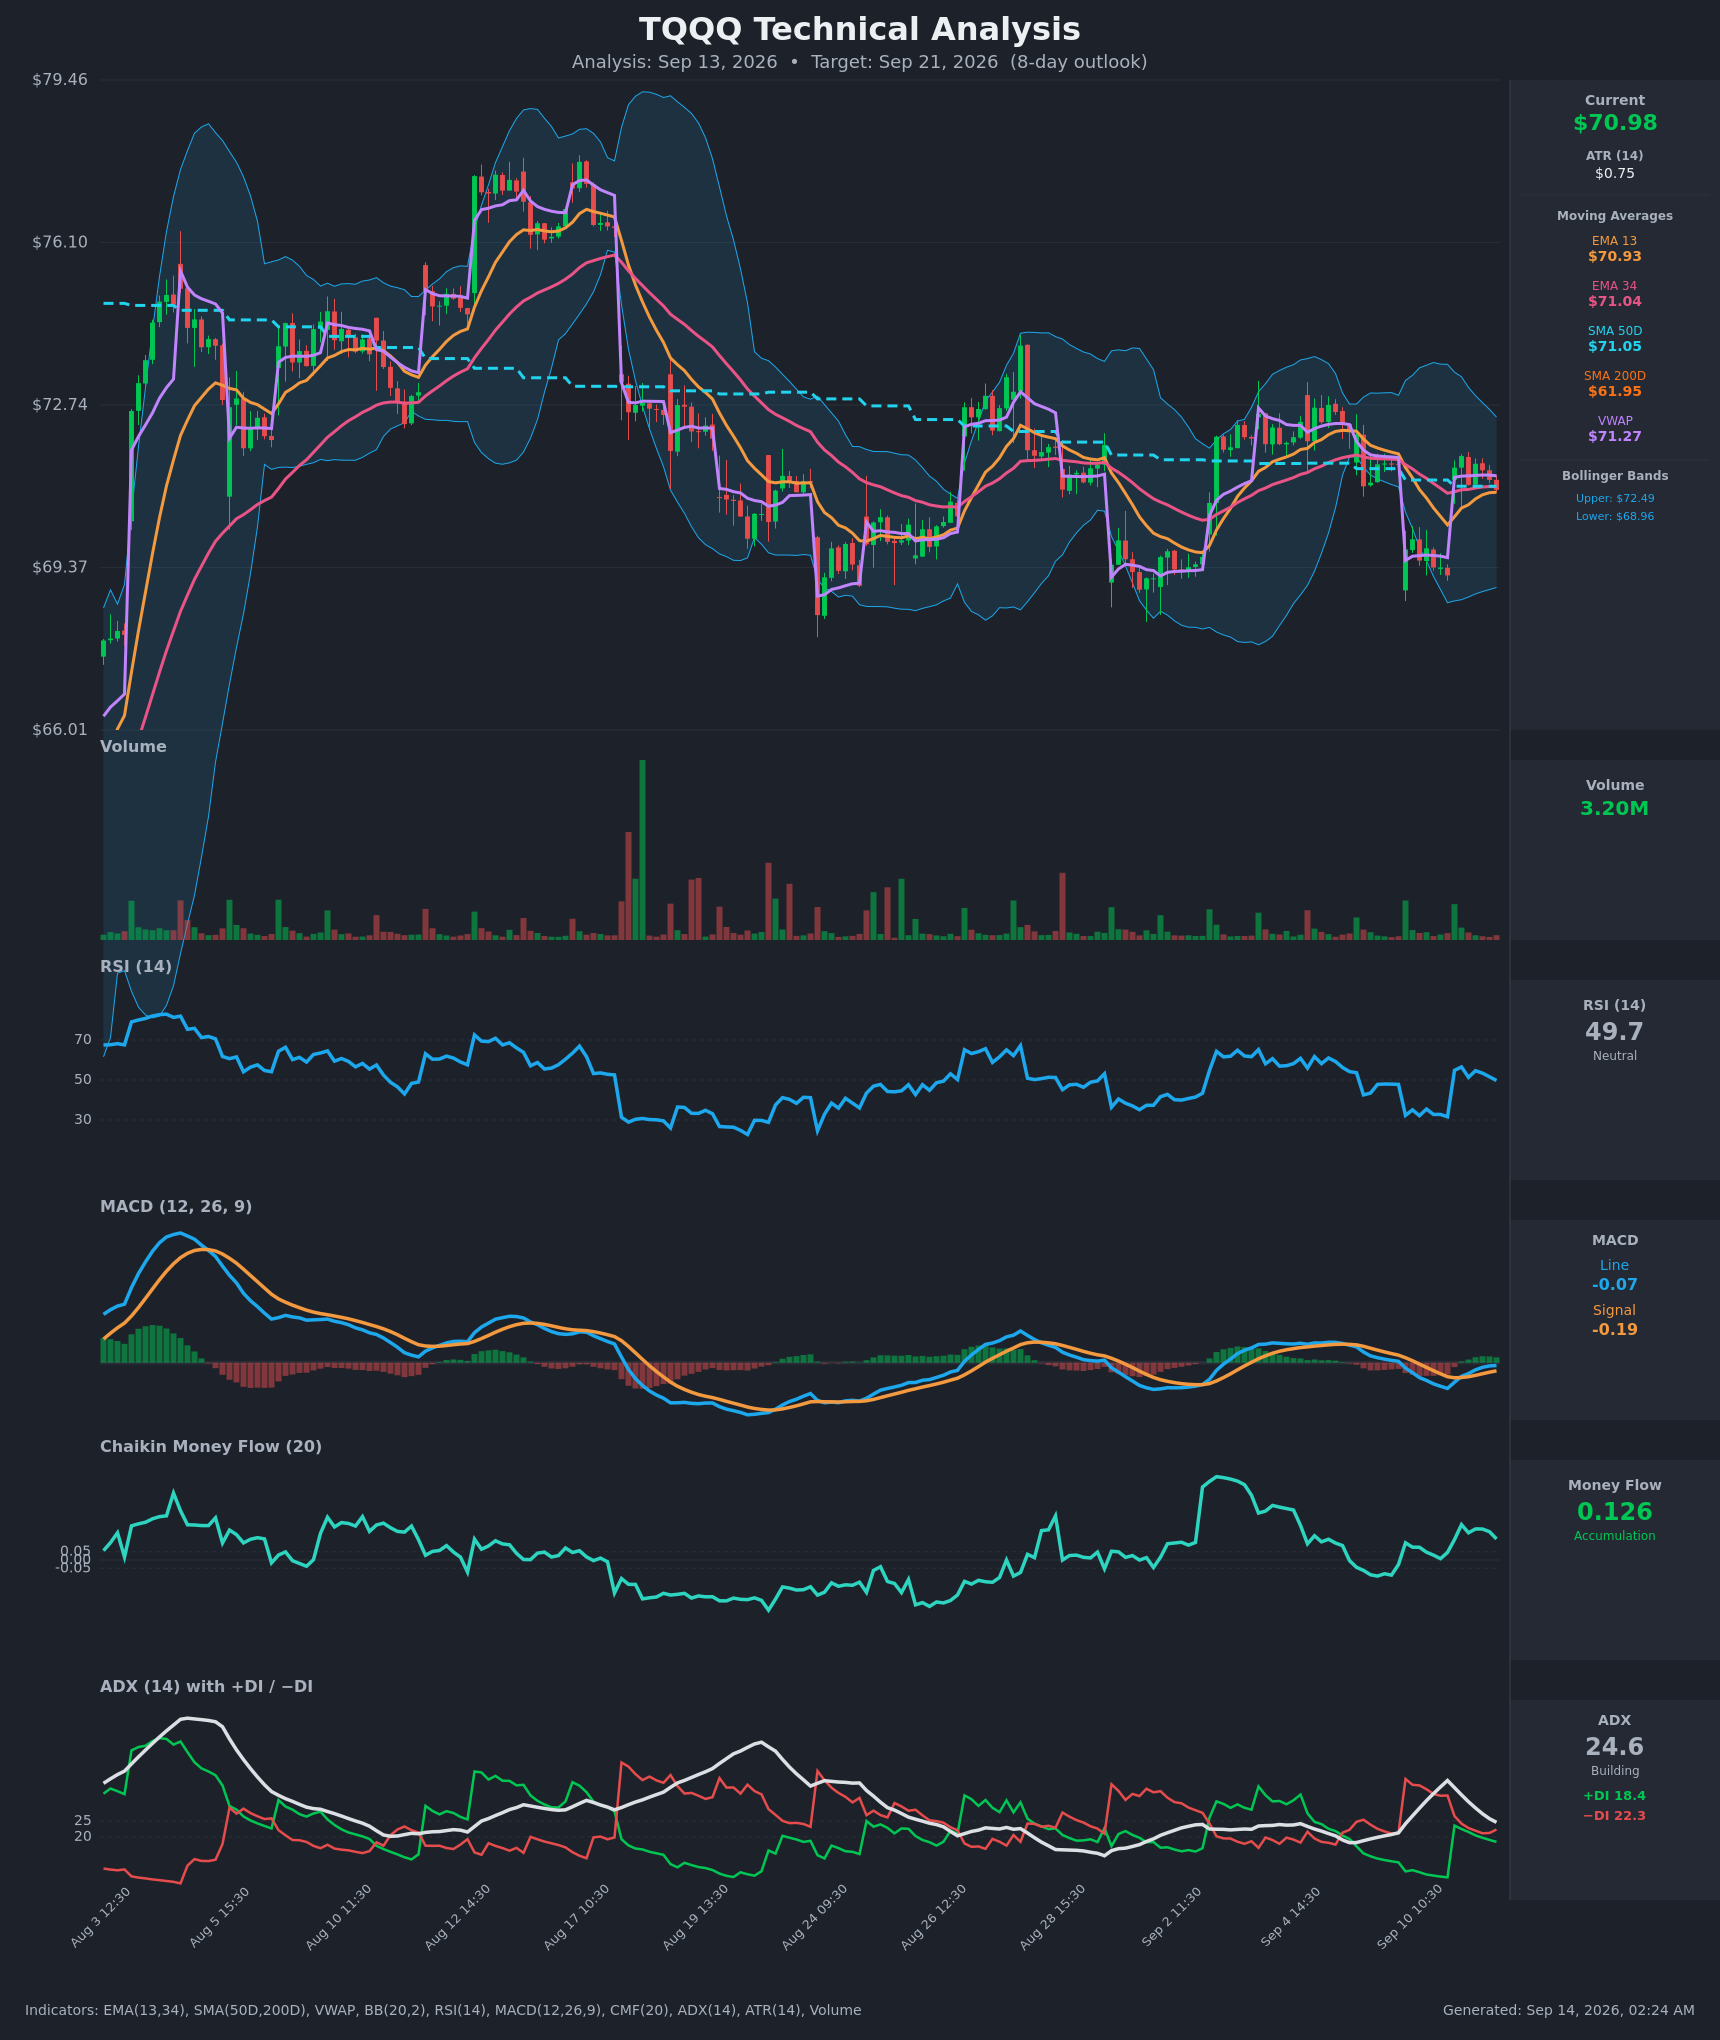
The dominant technical scenario (40% weight in the 7-day write-up) invalidates on a close below $69.20 — close enough to our own $68.09 kill switch that the two reads agree on where the range breaks. The TA did shade one thing below: the bearish call spread's short strike sits at $73, just under the $73.71 swing resistance and the $74 gamma pivot, rather than higher.
Full technical write-ups: 4-day report → · 7-day report →
4 · Three ways the next seven days can go
If TQQQ pushes above $74–$75: the gamma flip estimate (≈$74) and the chain's heaviest call strike ($75, with 64,709 contracts and the largest gamma pile on the board) are the practical ceiling. Heavy call open interest overhead tends to slow rallies as the dealers who sold it hedge into strength. Above $76.83 positioning thins out considerably — the September 21 call wall at $80.00 is the next real shelf, and it sits outside the implied range entirely.
If TQQQ drifts between the rails: this is the base case the data describes. Max pain for September 21 is $71.00 against a $70.98 close, the 50-day average is $71.05, and the estimated dealer gamma regime at that expiration is positive — the state in which hedging flows tend to pull price toward the heaviest strikes rather than away. Expiring open interest in the $70–$73 band would do the rest.
If TQQQ breaks below $68.09: the next shelves are $66.79 and $64.91, and the chain's heaviest put strike at $65.00 — reinforced by Friday's 8,597-contract build in the September 18 $65 puts — becomes the magnet. A move that direction also carries price further below the $74 flip estimate, the side of that rough model where hedging stops cushioning. Realized volatility has been unusually depressed for this fund, and compressed ranges in a leveraged product do not stay compressed forever.
5 · Three defined-risk structures
Prices are end-of-day midpoints as of 2026-09-11. All structures are hypothetical. Verify live prices before trading — these will be stale by the open.
A note on expirations before the strikes: the September 21 expiration carries this article's thesis levels, but it is a Monday expiry with thin quotes — several of its strikes trade 40–90% wide relative to their midpoint. The deep liquidity for this window sits in the September 18 Friday expiration, which settles three days before our target date. Two of the three structures below use it for that reason, and the slippage is flagged where it matters.
If you expect the range to hold: iron condor (the featured structure)
- Trade: Sell the Sept 18 $67/$65 put spread and the Sept 18 $75/$77 call spread
- Credit: $0.55 · Max profit: $55 · Max loss: $145 · Break-evens: $66.45 and $75.55
- Why it fits: Premium is running about 13.3 vol points above delivered movement, richer than roughly 79% of this ETF's own recent readings — you are selling the part of the option price that has not been earned back by actual movement. The short strikes sit essentially on the Sept 18 expected-move rails ($66.16 / $75.80), the short call is just under the chain's heaviest call strike at $75.00, and the short put is just above the heaviest put strike at $65.00. You collect $55 and risk $145 on the range holding.
- Makes sense only if: you believe the pin toward $71.00 max pain holds and realized movement stays near its current, unusually quiet level.
- Invalidated if: TQQQ closes below $68.09 or above $74.00 — either one puts a short strike inside one day's move.
- Managing it: close at roughly 50% of max credit; exit regardless by the Wednesday before expiry. A leveraged fund can traverse the entire body of this condor in two sessions, so if either short strike is breached on a closing basis, close rather than hope.
- Liquidity note: the $67 puts traded 3¢ wide on $392,000 of premium, the $65 puts 3¢ wide on 3,856 contracts, the $75 calls 5¢ wide on 4,208 contracts, and the $77 calls 3¢ wide. All four legs fill cleanly.
- Analyze this position →
If you lean bullish: short put spread at the horizon expiration
- Trade: Sell the Sept 21 $69/$66 put credit spread (you collect premium up front and keep it if TQQQ stays above $69)
- Credit: $0.86 · Max profit: $86 · Max loss: $214 · Break-even: $68.14
- Why it fits: This is the only structure that settles on the article's own target date. It leans on the max pain magnet at $71.00, the put open interest that has been thinning (the put/call OI ratio fell from 1.03 to 0.74 in five sessions), and rich front-end premium. The break-even sits just above the $68.09 invalidation shelf.
- Makes sense only if: you read Friday's 2.86% gap-up recovery and the persistent money-flow accumulation both chart models flag as real demand rather than noise.
- Invalidated if: TQQQ closes below $68.09.
- Managing it: take it off at about half the credit; because the short-term momentum turn is fighting a 20-day trend that is still 8% lower, take profits earlier than you would on a trend-aligned position rather than holding to expiry.
- Liquidity note — read this before trading it: the Sept 21 $69 puts are quoted $1.21 by $1.94, a 73¢ spread on a $1.58 midpoint, and the $66 puts are 13¢ wide. You will not get the midpoint. Work the order as a limit spread and assume the realistic credit is meaningfully below $0.86; if you can't get filled near fair value, the Sept 18 $69/$66 version (9¢ and 3¢ wide) is the cleaner execution.
- Analyze this position →
If you lean bearish: short call spread
- Trade: Sell the Sept 18 $73/$76 call credit spread
- Credit: $0.76 · Max profit: $76 · Max loss: $224 · Break-even: $73.76
- Why it fits: The short strike sits beneath three layers of resistance stacked within a dollar of each other — the $73.71 swing pivot, the ≈$74 gamma flip estimate, and the heavy $73–$73.50 call open interest (16,010 and 20,541 contracts) that dealers hedge into on rallies. The 20-day and 50-day trend reads are both still negative. You are selling rich premium into the level the market has repeatedly failed to clear.
- Makes sense only if: you think the September 11 bounce was a recovery from an oversold gap rather than the start of a push back toward $76.
- Invalidated if: TQQQ closes above $74.00 — above the gamma pivot estimate, the positioning argument for this trade stops working.
- Managing it: close at roughly 50% of max credit; exit by Wednesday, September 16 regardless, and close rather than roll if the short strike is breached on a close.
- Liquidity note: the $73 calls were the single most active contract on the board — 17,436 traded, $1.73 million of premium, 8¢ wide. The $76 calls are 4¢ wide on 3,072 contracts. Fills are easy.
- Analyze this position →
If none of these: no trade
The case for standing aside is real, even with premium this rich. The entire argument for selling options here rests on realized volatility staying near 38% — roughly two standard deviations below what this fund normally delivers. That is a mean-reversion bet dressed up as an income trade: the same compression that makes the premium look attractive is what makes a 3.7% gap down (September 10) or a 2.9% gap up (September 11) capable of blowing through a $2-wide condor in one session. This fund has produced eight gaps of 1.6% or larger in the last month. If you would not be comfortable watching a short strike get taken out overnight with no chance to adjust, the fact that the premium is 79th-percentile rich does not fix that — it just prices it. Sitting out a neutral read in a leveraged product is a legitimate choice, and it is cheaper than being right about the range and wrong about the path.
6 · Quick FAQ
What is TQQQ's expected move this week? ±$5.22, or ±7.36%, into the September 21 expiration — a $65.76 to $76.20 range around the $70.98 close, per the options market's straddle pricing as of September 11. Into the closer September 18 expiration it is ±6.79%, or $66.16 to $75.80.
Is TQQQ expected to go up or down over the next week? The honest answer is that the data describes positioning, not the future. Options positioning as of September 11 reads neutral — puts are thinning out of open interest while delta-weighted flow tilts put-side, and the composite signals cancel each other. The actionable map is the $65.76–$76.20 range, the $71.00 max pain magnet, and the $68.09 level that breaks the read.
Are TQQQ options expensive right now? Two lenses, two answers. IV rank of 21.6/100 says option prices are lower than about 78% of the past year's readings. But they are running roughly 13.3 vol points above the movement TQQQ has actually delivered over the past 20 days — richer than about 79% of this fund's own recent readings. Cheap versus history, rich versus reality; on balance that favors collecting premium in defined-risk form rather than owning it.
Where is TQQQ's biggest options support and resistance? For the September 21 expiration specifically, the put wall is $60.00 and the call wall is $80.00 — but both are thin at that expiry. Across the whole chain the heaviest strikes are $65.00 on the put side (60,328 contracts) and $75.00 on the call side (64,709), and those are the levels that actually behave like magnets inside this window.
What invalidates this week's read? A close below $68.09.
Methodology & disclosures. Data: end-of-day options-chain snapshot for TQQQ, 2026-09-11, generated 2026-09-14T02:24:27.194Z. Prices shown are midpoints and will differ from live markets. Momentum/positioning scores and volatility-premium comparisons are descriptive measurements of past option flow and past price movement — not investment advice, signals, forecasts, or guarantees. All trade structures are hypothetical. Every structure shown has a defined maximum loss; you can lose the entire max-loss amount. Options involve substantial risk and are not suitable for all investors.