TQQQ Options Outlook: Will the $60 Call Wall Hold Into November 20?
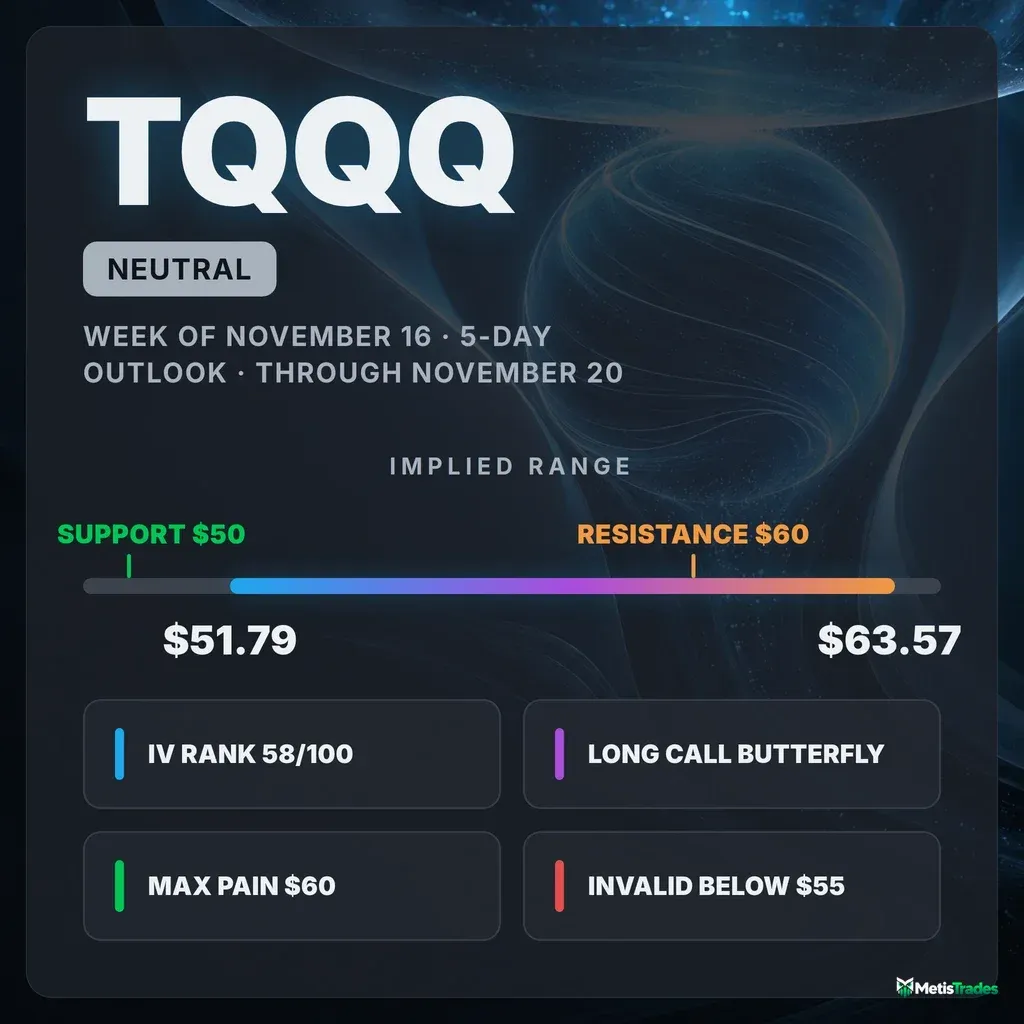
TQQQ options price roughly a $51.79–$63.57 range into the November 20 expiration. Call-heavy flow is running into a $60 wall and a bearish chart read, so our calibrated view is neutral, with three debit-only ways to trade it.
Listen to this analysis — prefer audio? This TQQQ outlook is also available as a podcast episode:
The options market implies a $51.79–$63.57 range into the November 20 expiration. Here is what's driving it, where the walls sit, and three defined-risk ways to trade it.
Published Sunday, November 15, 2026 · Data as of Friday, November 13, 2026 close
Explore the live TQQQ options data in the Detailed Options Analyzer →
Quick answer
| Item | Answer |
|---|---|
| Market bias | Neutral |
| Options-implied range (into Nov 20) | $51.79 – $63.57 (±10.22%, about ±$5.89) |
| Major support | $50.00 (Nov 20 put wall) |
| Major resistance | $60.00 (Nov 20 call wall) |
| Max pain (Nov 20) | $60.00 |
| Dealer gamma regime (estimate) | Positive for the Nov 20 expiration. Hedging tends to dampen moves. Flip level ≈ $70.00, well above spot, so this cushion is fragile. |
| Volatility condition | Elevated but easing over the week. IV rank 58/100 (ATM IV 73.79%). Premium is thin: options are priced ~35 vol pts below the movement TQQQ has actually delivered. |
| Technical check | Mixed: the chart model is bearish. 3-day target $56.70 (model range $55.20–$59.00); 5-day target $56.60 (model range $54.70–$59.20). |
| Best-fitting strategy | Long call butterfly 55/58/61 (Nov 20), if you expect a pin in the high-$50s |
| Analysis invalidated if | TQQQ closes below $55.00 |
1 · What matters today
Our read on TQQQ for the next five trading days is neutral. Short-dated traders are clearly chasing calls after a 10% bounce. But the heaviest pile of call contracts for the November 20 expiration sits just overhead at $60, and that level is also max pain, the price where the most option value would expire worthless. Expirations sometimes gravitate toward that level, and in this setup it is more likely to cap the bounce than launch it.
The options market is pricing a move of about $5.89 either way, which puts the range at roughly $51.79 to $63.57 by November 20. The level that changes the picture is $55. Below it, the pinning story breaks and the next real cushion is the $50 put wall.
The chart-based model leans modestly bearish, with a target near $56.60. That sits comfortably inside the options range.
2 · What the options market is pricing
What changed this week
TQQQ rallied 10.4% over the past five sessions to close at $57.68 on Friday. Option prices cooled as it bounced: at-the-money implied volatility fell 13.8% over five days, from 85.6% on November 6 to 73.79%. Friday alone saw a 4.1% uptick.
Positioning swung hard toward calls:
- Put/call open interest. This ratio compares contracts currently held open on puts versus calls. It now sits at 0.75, meaning three puts held for every four calls. Its 7-day average is 1.05 and its 14-day average is 1.19. A week ago puts outnumbered calls; that protection has been unwound.
- Biggest OI change. The November 20 $60 calls added 9,811 contracts in one day, nearly doubling to 20,515. The November 20 $59 calls added 7,221.
- Settled history. Into Friday's expiration, the November 13 $64 calls had added 3,529 contracts. Those expired worthless with TQQQ at $57.68.
- Flow composite. Our read of option flow turned sharply: it printed +48 on Friday against a 7-day average of −9 and a 14-day average of −18.
The short-term and longer-term trends disagree. The past week's pop runs against a market that is still down 15.4% over about a month and 19.9% over roughly two and a half months. Near-term flow and the bigger trend are pointing different ways.
Expected move
The expected move is the move the options market is pricing in, derived from what straddles cost. Into November 20, it works out to about ±10.22%, or roughly $5.89 either way from $57.68. That gives a range of $51.79 to $63.57.
A note on how we got there. Quote quality on the near-dated at-the-money contracts (November 16 through December 4) was too poor to price those rungs directly: the call and put sides disagreed sharply. So the November 20 figure scales the chain-wide ATM IV of 73.79% to seven days. As a cross-check, the November 20 $58 straddle costs about $5.30 at the midpoint, the same ballpark.
| Expiration | Implied move | Range around $57.68 |
|---|---|---|
| Nov 20 (7 days) | ±10.22% | $51.79 – $63.57 |
| Dec 11 (28 days) | ±20.51% | $45.85 – $69.51 |
| Dec 18 (35 days) | ±22.42% | $44.75 – $70.61 |
| Dec 31 (48 days) | ±26.15% | $42.60 – $72.76 |
The ladder scales roughly with the square root of time, as it normally does. There is no kink pointing to a single scheduled shock. This is simply a 3x-leveraged fund priced to swing a lot.
Volatility
Implied volatility (IV) is the market's estimate of how much TQQQ will move, baked into option prices.
- Level. At-the-money IV is 73.79%.
- IV rank: 58/100. Today's IV sits a bit above the middle of its past-year range.
- IV percentile: 85.7. Today's IV is higher than about 86% of the past year's daily readings.
- Direction. IV remains above its 30-day average (65.6%) and 90-day average (62.1%), and is up 34.2% over 30 sessions. The five-day drop shows the panic premium from early November leaking out, not disappearing.
- Front-month term structure. Comparing option prices across expiration dates, this read is unavailable today because the nearest expiration settled on Friday. The ~60-day IV reads 70.05%.
Realized movement is extreme by this fund's own standards. Twenty-day realized volatility is about 108.8%, running well above TQQQ's recent norm. ("Unusually high" here means unusual for TQQQ, not versus the broader market.) Ten-day realized vol is even hotter at 132.9%. The five-day pace has actually cooled relative to the month.
Premium rich or cheap? The volatility risk premium is the gap between how much movement options are priced for and how much TQQQ has actually delivered. When it's positive, option sellers have been collecting more than realized movement cost them.
- Right now the gap is deeply negative. Options are priced about 35 vol points below the movement TQQQ has delivered over the past 20 days.
- On a percentile basis (where today's gap sits versus this fund's own recent readings), it ranks at 6/100. That is thinner than roughly 94% of recent readings, and unusually depressed versus its own norm.
- The gap flipped from about +12 points on November 3 to negative on November 4, then deepened through the week. That happened as the early-November crash and the violent rebound days stacked into the realized-vol window.
So what? IV rank 58 combined with a 6th-percentile premium favors owning premium in defined-risk form over selling it this week. Sellers have been underpaid for the movement they've absorbed.
Skew and sentiment
Skew means puts and calls the same distance from the stock price don't cost the same. When puts are pricier, traders are paying up for crash protection.
- Skew has collapsed. 25-delta puts trade at 76.9% IV versus 68.9% for calls, a gap of 8.0 vol points. The norm for this name over the past 60 days is 15.8 points, and the 7-day average is 18.3. Downside protection has gone from expensive to relatively cheap in a week. Skew is stretched flatter than usual versus TQQQ's own history.
- Put/call volume. This ratio measures put activity relative to calls; above 1 means puts dominate. It came in at 0.68, slightly above its 7-day average of 0.55. Calls still dominate the tape, but not as lopsidedly as midweek.
- Sentiment by expiration. Positioning in options expiring within a week scored +56, and the 7–30 day window +61. Both compare with 7-day averages near +10. Longer-dated positioning (60–120 days) is flat at +1.
That shape is best summarized as a leveraged front-end chase: aggressive short-dated call buying, with no confirmation from longer-dated money. Calls are also richer than usual relative to puts in the short-dated window. That fits the pattern of traders paying up for upside rather than protecting against downside.
The key levels map
| Level | Price | Why it matters |
|---|---|---|
| 52-week high | $88.09 | TQQQ sits 34.5% below it |
| 100-day / 50-day moving average | $71.27 / $70.96 | Falling longer-term trend lines far overhead |
| Gamma flip (estimate) | $70.00 | One rough estimate's pivot; spot sits unusually far below it for this name |
| 200-day moving average | $65.71 | Long-term trend marker |
| Swing resistance | $65.01 | Nearest heuristic overhead pivot cluster |
| Expected-move ceiling (Nov 20) | $63.57 | Top of the 1σ implied range |
| 20-day moving average | $63.33 | Short-term trend line the bounce hasn't reclaimed |
| Large gamma strike (all expirations) | $63.00 | Heavy open interest across expirations |
| Nov 12 gap (unfilled) | $60.44 | Prior close before Thursday's gap down |
| Call wall + max pain (Nov 20) | $60.00 | 20,515 calls in the Nov 20 series. Also the whole chain's call wall and largest gamma strike. |
| $59 calls / Nov 18 max pain | $59.00 | 13,833 Nov 20 calls, built on Friday |
| TA resistance | $58.28 | Chart model's short-term moving-average cluster |
| Close / swing support | $57.68 / $57.59 | Price is sitting right on recent pivot support |
| Large gamma strike / Nov 16 max pain | $57.00 | Heavy two-sided open interest |
| TA support | $55.85 | Chart model's lower Bollinger Band |
| Large gamma strike (all expirations) | $55.00 | Second-largest gamma strike, with nearly 40,000 puts open; our invalidation line |
| Expected-move floor (Nov 20) | $51.79 | Bottom of the 1σ implied range |
| Swing support | $50.25 | Near the November 5 capitulation low |
| Put wall (Nov 20) | $50.00 | 13,377 Nov 20 puts. Also the whole chain's put wall, with 42,251 puts across expirations. |
| 52-week low | $37.32 | Far below the implied range |
The November 20 expiration's own walls ($60 call, $50 put) match the whole-chain walls, so there is no disagreement to reconcile this week.
Positioning and unusual flow
Market makers hedge the options they've sold. In a positive-gamma regime, their hedging tends to dampen moves.
- Nov 20 expiration. One rough estimate puts the dealer gamma regime positive, which argues for a pin, with the $60 strike as the obvious magnet.
- The caveat. The same estimate places the gamma flip level, the price below which hedging tends to accelerate selling rather than cushion it, way up at $70. On that reading, spot is already on the fragile side, and unusually far from the flip for this name. Treat the cushion as thin, not guaranteed.
Unusual contracts worth noting, all in live expirations:
- November 20 $60 calls. 2,948 traded and open interest nearly doubled to 20,515. That is fresh money stacking right at the wall and max pain.
- November 20 $57 calls. About $1.05 million in premium changed hands, the largest dollar print in any live expiration. These are at-the-money call buyers betting on follow-through.
- November 16 $53 puts. 2,741 traded against 375 open, more than 7x turnover and top of their peer group. This is cheap, short-dated crash insurance, a reminder that not everyone is chasing.
3 · Technical check
Both chart-model reads lean bearish, but modestly, and both stay well inside the options range.
- 3-day read (to November 18). Target $56.70, projected range $55.20–$59.00. The dominant scenario is a rejection at the $58.10–$58.30 moving-average cluster, invalidated by a close above $58.50.
- 5-day read (to November 20). Target $56.60, projected range $54.70–$59.20. Invalidated by a close above $59.40.
Against our neutral options read, this is mixed rather than a clean divergence. Direction tilts lower, but the magnitude is about $1, and that falls inside the pin zone between $55 and $60.
Two indicator details matter. Trend strength is weak (ADX of 18, below the 20 trend threshold), which fits a range-bound week. And money-flow readings show strong accumulation (CMF +0.30) even as momentum rolled over. That flow-versus-price split mirrors the call-chasing in the options chain.
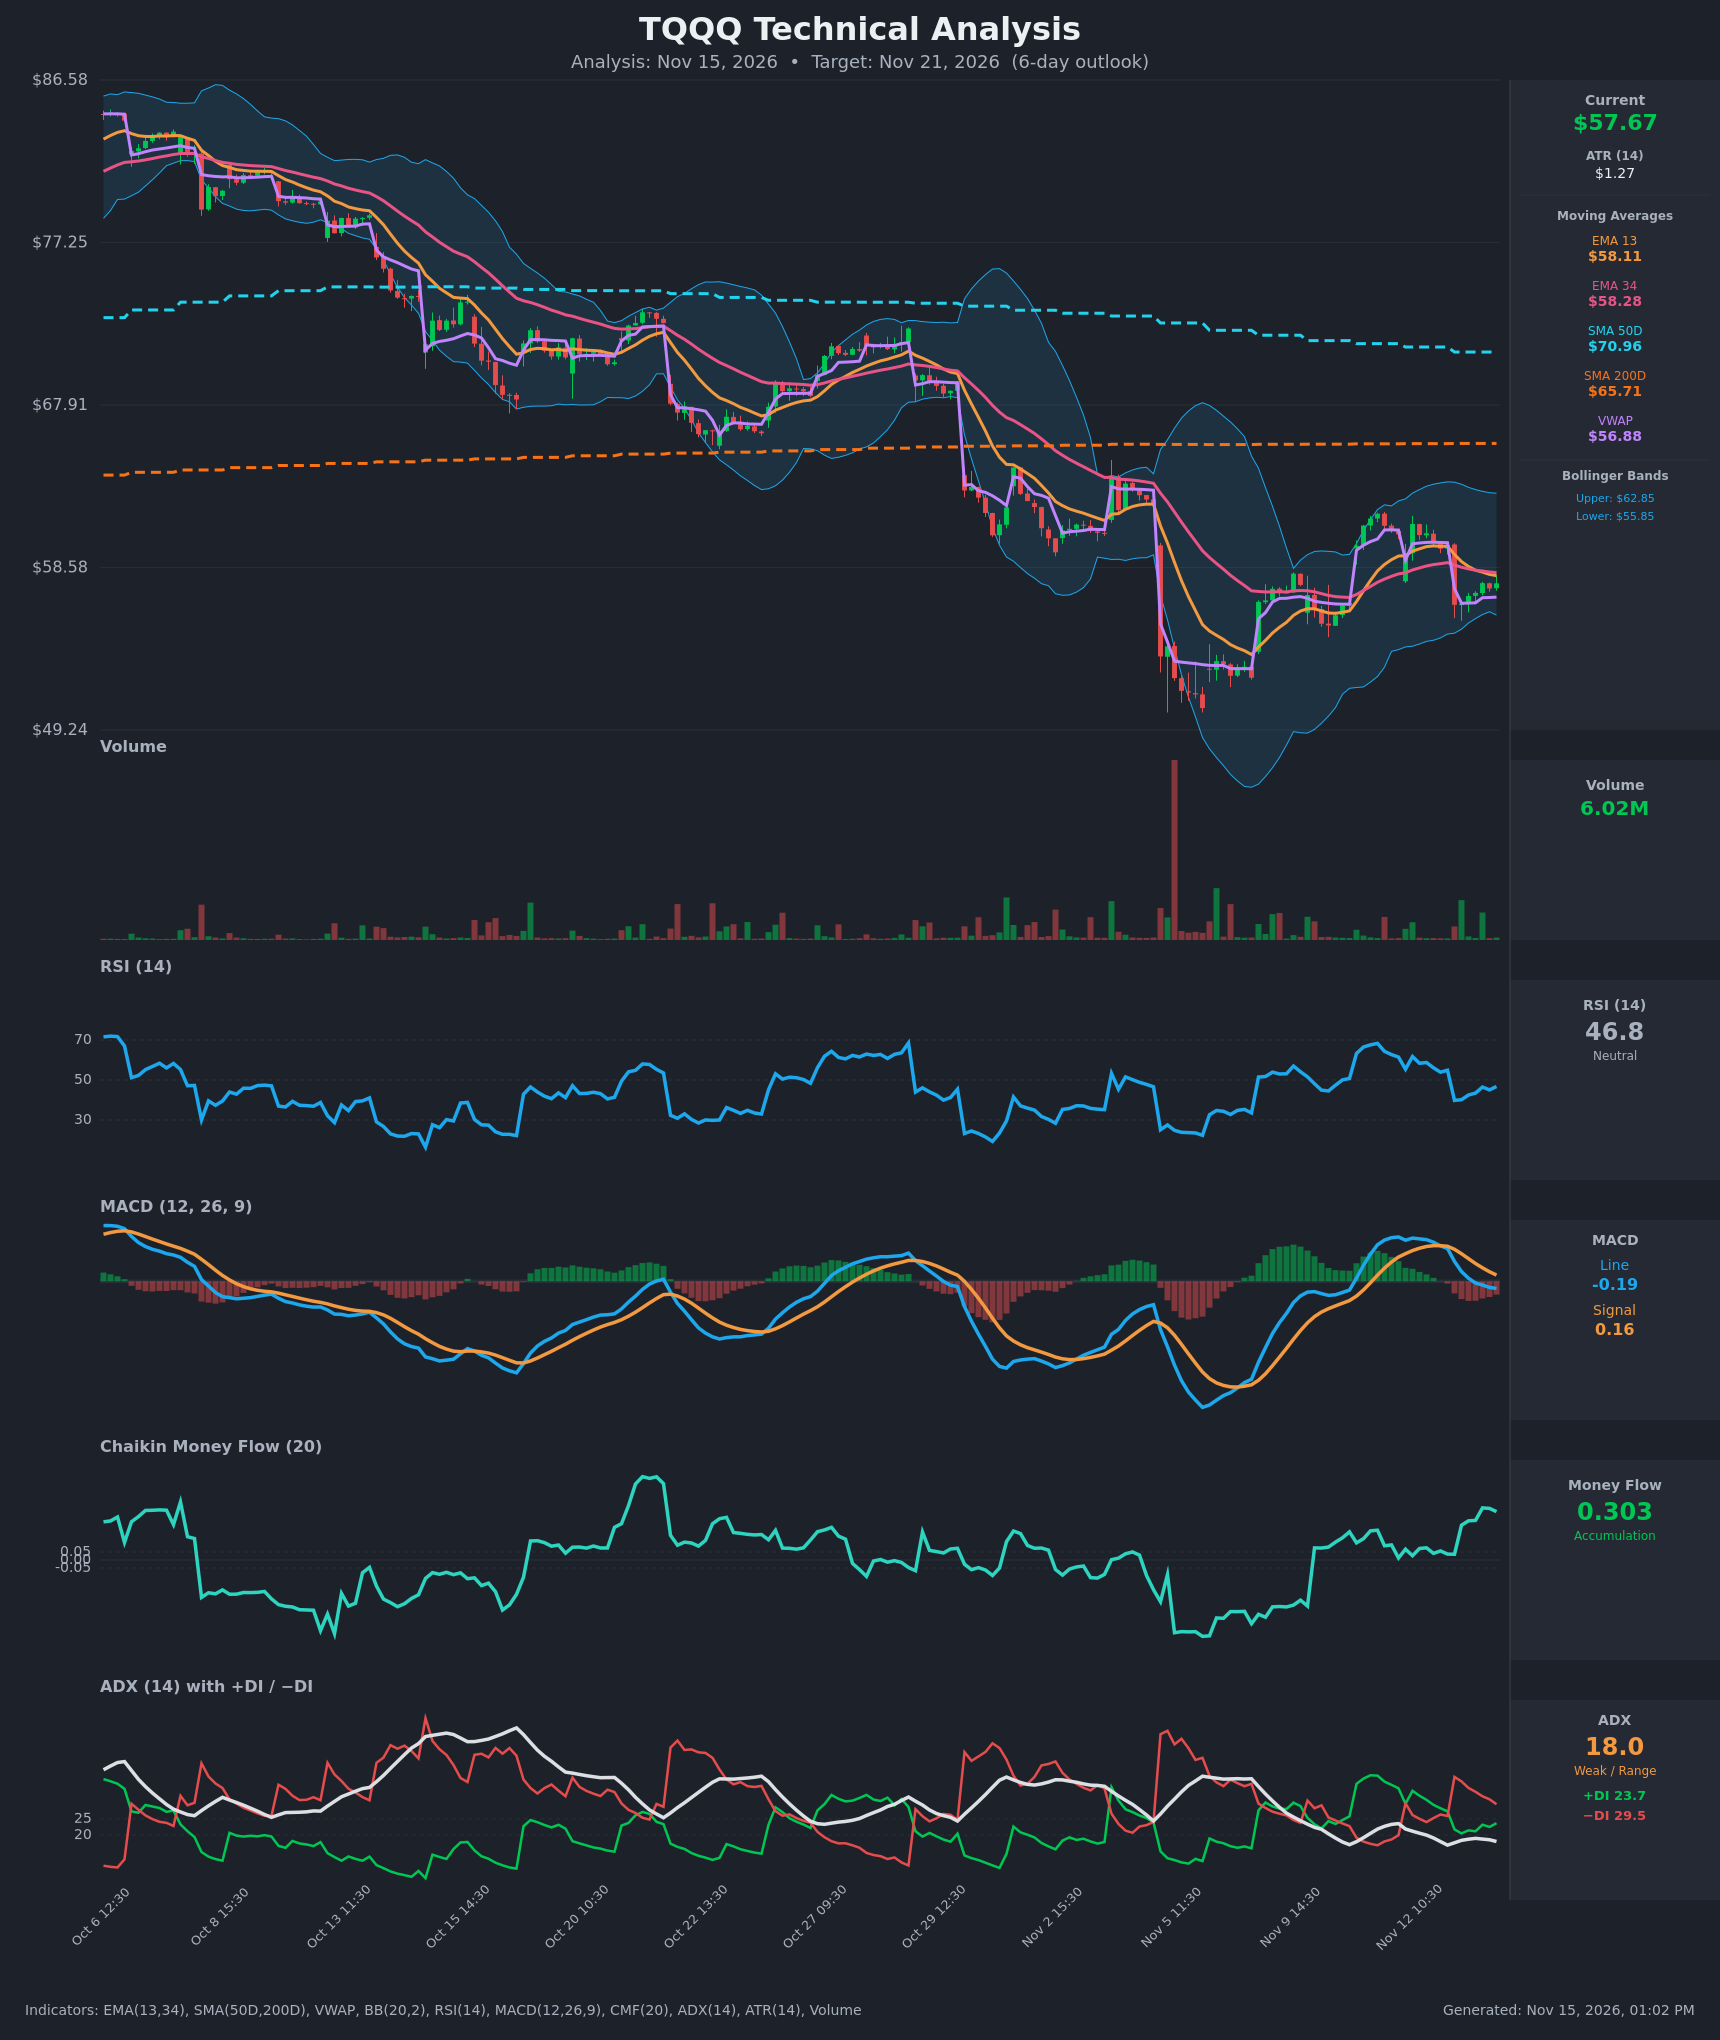
Model vs. Market: The options market implies $51.79–$63.57 into November 20; the 5-day technical model targets $56.60. The chart sees a small drift lower inside a range options are pricing as much wider, so a close under $55 would be the first sign the chart's bearish tilt is turning into something bigger.
The TA nudged strike selection. The butterfly below centers on $58, right under the model's $58.28 resistance. The bearish spread's short strike sits at $55, just below the model's $55.85 support.
Full technical write-ups: 3-day report → · 5-day report →
4 · Three ways the next five days can go
If TQQQ pushes above the call wall ($60.00): More than 20,000 November 20 calls at $60 tend to slow a rally there as hedges get adjusted. A clean break would refill the November 12 gap toward $60.44 and leave thinner positioning up to the $63 gamma strike and the $63.57 edge of the implied range.
If TQQQ drifts between the walls: This is the pin case. With max pain at $60, positive estimated gamma for the November 20 series, and heavy two-sided open interest at $57–$59, hedging flows and expiring contracts tend to keep price chopping in the high $50s into November 20.
If TQQQ breaks below $55 toward the put wall ($50.00): Losing $55, the second-largest gamma strike, would expose a gap down to the $50 put wall, the heaviest put pile in the chain. Spot already sits unusually far below the $70 gamma-flip estimate for this name. One rough estimate suggests that below the flip, market-maker hedging amplifies selling rather than cushioning it. That is how a 3x fund can travel $5 in two sessions, as it did on November 5.
5 · Three defined-risk structures
Prices are end-of-day midpoints as of November 13, 2026. All structures are hypothetical. Verify live prices before trading; these will be stale by the open.
With options priced far below delivered movement, all three ideas are debit structures: you pay a fixed amount, and that is your maximum loss. We deliberately skip credit structures this week. Selling premium that hasn't been rich lately means collecting too little for the swings this fund has been producing.
If you expect the range to hold: Long call butterfly
- Trade: Buy 1 Nov 20 $55 call, sell 2 Nov 20 $58 calls, buy 1 Nov 20 $61 call. You pay a small debit and profit most if TQQQ finishes near $58.
- Debit: $0.585 ($58.50 per butterfly) · Max profit: $241.50 at $58 · Max loss: $58.50 · Break-evens: $55.59 / $60.42
- Why it fits: The pin case: heavy open interest at $57–$60, positive estimated gamma for the Nov 20 series, and TA resistance at $58.28. The defined debit also suits thin premium better than a credit trade does.
- Makes sense only if: TQQQ keeps chopping between the $57 support zone and the $60 wall.
- Invalidated if: TQQQ closes below $55.00 or above $61.00.
- Managing it: Butterflies pay most in the final days. Consider taking profit at 50–100% of the debit if TQQQ sits near $58 by November 18, and close regardless by November 19 rather than holding through expiration day.
- Liquidity note: The $55 calls traded 20¢ wide, the $58 calls 14¢, and the $61 calls 7¢. Spreads run roughly 5–6% of mark on each leg, so work the order as a single ticket near the midpoint.
- Analyze this position →
If you lean bullish: Call debit spread
- Trade: Buy the Nov 20 $58 call, sell the Nov 20 $60 call. You pay a debit and profit if TQQQ rises toward the call wall.
- Debit: $0.915 ($91.50) · Max profit: $108.50 · Max loss: $91.50 · Break-even: $58.92
- Why it fits: Short-dated call flow and flattened skew point upward, and max pain at $60 gives the spread a natural target. Capping it at the $60 wall avoids paying for upside the positioning is likely to blunt.
- Makes sense only if: TQQQ reclaims the $58.30 moving-average cluster early in the window.
- Invalidated if: TQQQ closes below $55.00.
- Managing it: The past week's bounce is fighting a month-long downtrend, so keep it short-dated and take profits early. Close at about 50–60% of max profit, and exit by November 19 if the stock hasn't cleared $58.92.
- Liquidity note: The $58 calls traded 14¢ wide and the $60 calls 13¢ wide on heavy open interest. Fills should be manageable.
- Analyze this position →
If you lean bearish: Put debit spread
- Trade: Buy the Nov 20 $57 put, sell the Nov 20 $55 put. You pay a debit and profit if TQQQ slides toward the chart model's support.
- Debit: $0.725 ($72.50) · Max profit: $127.50 · Max loss: $72.50 · Break-even: $56.28
- Why it fits: Puts are unusually cheap relative to calls (skew at 8.0 vs a 15.8 norm), the chart model targets $56.60–$56.70, and the longer-term trend is still down.
- Makes sense only if: TQQQ fails at $58.30 and loses the $57 area.
- Invalidated if: TQQQ closes above $60.00.
- Managing it: Take profits near $55.85 (the model's support), since the $55 short strike caps further gains anyway. Close by November 19 if price is still above $57.
- Liquidity note: The $57 puts traded 14¢ wide and the $55 puts 11¢ wide, with nearly 8,900 contracts open at $55. Fills should be clean.
- Analyze this position →
If none of these: no trade
Standing aside is a perfectly defensible choice. TQQQ has been realizing more than 100% annualized volatility, so a single gap like Thursday's 4.35% open can blow through any short-dated structure's sweet spot overnight. Our read is neutral, not directional.
Credit structures are off the table because premium is thin. Debit structures, meanwhile, need either a pin or a clean break to pay. If you can't watch positions daily through November 20, the honest move is to wait for the call chase to either clear $60 or fail.
6 · Quick FAQ
What is TQQQ's expected move this week? About ±$5.89 (±10.22%) into the November 20 expiration, or roughly $51.79 to $63.57, based on options pricing as of November 13.
Is TQQQ expected to go up or down over the next week? Options positioning as of November 13 reads neutral. Short-dated traders are chasing calls, but the $60 call wall and max pain sit just overhead. That is a read of what traders have done, not a forecast. The actionable map is the $51.79–$63.57 range and the $50/$60 walls.
Are TQQQ options expensive right now? IV rank is 58/100, so option prices sit above the middle of the past year's range. But they're running about 35 vol points below the movement TQQQ has actually delivered, thinner than roughly 94% of its own recent readings. That favors buying defined-risk premium over selling it.
Where is TQQQ's biggest options support and resistance? The put wall is at $50.00 and the call wall at $60.00 for the November 20 expiration. Max pain is also $60.00.
What invalidates this week's read? A TQQQ close below $55.00.
Methodology & disclosures. Data: end-of-day options-chain snapshot for TQQQ, 2026-11-13, generated 2026-11-15T13:02:08.987Z. Prices shown are midpoints and will differ from live markets. Momentum/positioning scores and volatility-premium comparisons are descriptive measurements of past option flow and past price movement — not investment advice, signals, forecasts, or guarantees. All trade structures are hypothetical. Every structure shown has a defined maximum loss; you can lose the entire max-loss amount. Options involve substantial risk and are not suitable for all investors.