TSLA Options Outlook: Will the $400 Put Wall Hold Through November 6?
TSLA options imply a $373.70–$425.92 range into the November 6 expiration. Friday's session flipped near-term sentiment put-heavy while spot closed right on the $400 put wall, and we lay out three defined-risk ways to trade it.
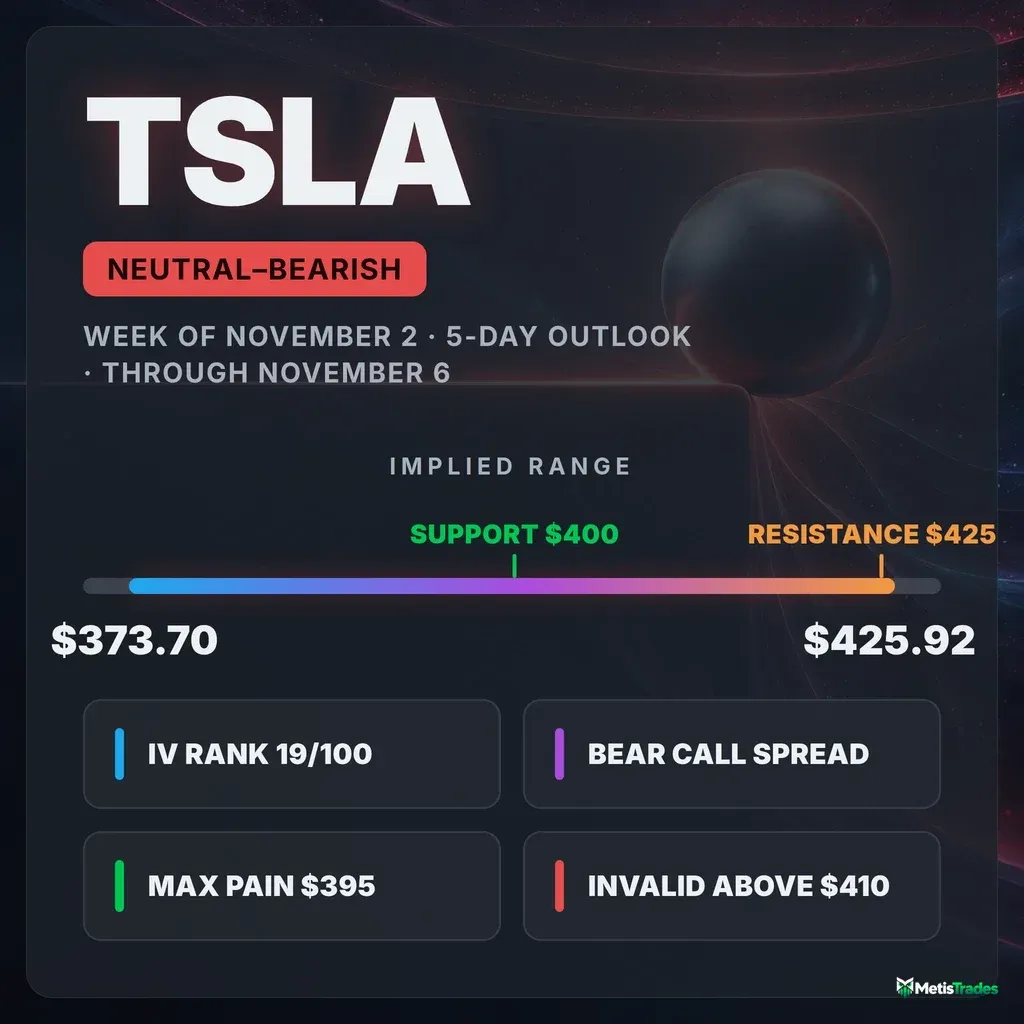
The options market implies a $373.70–$425.92 range for TSLA into the November 6 expiration. Below: what's driving that range, where the key levels sit, and three defined-risk ways to trade it.
Published Sunday, November 1, 2026 · Data as of Friday, October 30, 2026 close
Explore the live TSLA options data in the Detailed Options Analyzer →
Quick answer
| Item | Answer |
|---|---|
| Market bias | Neutral with a bearish tilt |
| Options-implied range (into Nov 6) | $373.70 – $425.92 (±$26.11, ±6.53%) |
| Major support | $400 (Nov 6 put wall) |
| Major resistance | $425 (Nov 6 call wall) |
| Max pain (Nov 6) | $395 |
| Dealer gamma regime (estimate) | Positive: hedging tends to dampen moves. Flip level ≈ $410, which sits above spot. |
| Volatility condition | Rising from a low base. IV rank 18.89/100. Premium is rich: options are priced ~5 vol pts above delivered movement. |
| Technical check | Mixed. The 3-day model is bullish (target $403.50, range $392.50–$408.00). The 5-day model is bearish (target $395.50, range $385.50–$407.00). |
| Best-fitting strategy | Bear call spread (Nov 6 $410/$420), if the tilt holds |
| Analysis invalidated if | TSLA closes above $410 |
1 · What matters today
Our read of TSLA options is neutral with a bearish tilt for the next five trading days.
The main reason is Friday's sharp change in sentiment. After a 7.4% rally over the week, traders bought puts at an unusually heavy pace, and the cost of downside protection jumped to its steepest level in weeks.
The options market is pricing a move of about $26 either way by November 6. That puts the expected range at roughly $373.70 to $425.92.
Price closed at $399.81, sitting right on the $400 strike, where the biggest pile of November 6 put contracts lives. That strike acts as a floor until it doesn't. The level that would cancel the bearish lean is a close above $410.
The two chart models split: the 3-day model leans up, and the 5-day model leans down.
2 · What the options market is pricing
What changed this week
TSLA rallied 7.4% over five sessions, peaking near $407 on October 27. Friday then opened with a 2.5% gap down from Thursday's $403.30 close and recovered to $399.81 by the bell.
The options reaction was more dramatic than the price move:
- Implied volatility jumped 12.2% in a single day.
- Put/call volume ratio hit 0.95, meaning almost one put traded for every call. That compares with a 7-day average of 0.84 and a 14-day average of 0.78. A put/call ratio measures how much put activity there is relative to calls; above 1 means puts dominate.
- Open interest held up better. Open interest is contracts currently held open. The put/call OI ratio is 0.69, below its 7-day average of 0.72 and 14-day average of 0.79. Over the week, traders actually closed out puts as the stock rose. Friday's put buying was a sudden hedge, not a slow build.
The biggest single change in open interest pointed the other way. The November 6 $425 calls added 4,576 contracts, taking open interest from 2,628 to 7,204. That made $425 the expiration's call wall. The November 6 $412.50 calls added another 4,159.
Into Friday's own expiration, flow was frantic. The October 30 $395 puts traded more than 227,000 contracts before settling. That is history now, but it shows how hard traders were hedging intraday.
The short-, medium- and long-term trend reads all still point up. The stock is up about 15.8% over the past two months. So Friday's put-heavy turn is happening inside an intact uptrend, which is one reason we keep the lean modest.
Expected move
The expected move is what the options market is pricing in, derived from what straddles cost. Into the November 6 expiration, that is ±$26.11, or ±6.53%. Around the $399.81 spot price, that gives a range of $373.70 to $425.92.
| Expiration | Implied move | Range around $399.81 |
|---|---|---|
| Nov 2 | ±2.95% | $388.02 – $411.60 |
| Nov 4 | ±5.49% | $377.86 – $421.76 |
| Nov 6 | ±6.53% | $373.70 – $425.92 |
| Nov 13 | ±8.71% | $364.99 – $434.63 |
| Nov 27 (~1 month) | ±11.49% | $353.87 – $445.75 |
The ladder has a noticeable step between rungs. Monday's November 2 contracts carry an ATM IV of only about 32.6%, while the November 4 and November 6 rungs sit near 47%. Traders are paying for more day-to-day movement in mid-week options than in Monday's.
Volatility
Implied volatility (IV) is the market's estimate of how much TSLA will move, baked into option prices. At-the-money IV closed at 41.56%.
IV rank shows where today's IV sits versus the past year. At 18.89/100, options are cheaper than about 81% of the past year's readings, and the IV percentile tells the same story at 19.
Direction is mixed:
- IV rose 12.2% on Friday and 5.2% over five days.
- It is still below its 30-day average (43.07%) and 90-day average (43.63%).
- The ~60-day IV is 41.83%.
- The front-month read is unavailable today (expiry day), so we can't quote a term-structure slope.
On the realized side, movement is picking up. The stock's 5-day realized volatility is running somewhat above its own 20-day pace, more than is typical for TSLA. The 10-day realized figure is 43%.
Is premium rich or cheap? The volatility risk premium is the gap between how much movement options are priced for and how much TSLA has actually delivered. When it's positive, option sellers have been collecting more than realized movement cost them.
- Options are currently priced about 5 vol points above the stock's 20-day realized volatility of 36.6%.
- That gap sits at the 82nd percentile versus TSLA's own recent readings, meaning it is richer than about 82% of them.
The path matters, though. In mid-October the gap was around 13 to 16 points. It shrank to slightly negative from October 27 through October 29 as the rally delivered real movement. It snapped back to +5 only on Friday's IV pop.
The combination of a cheap IV rank and a freshly rich premium over delivered movement modestly favors collecting premium this week. It's a thinner edge than the percentile alone suggests, because the richness is one session old.
Skew and sentiment
Skew means puts and calls the same distance from the stock price don't cost the same; when puts are pricier, traders are paying up for crash protection.
- TSLA's 25-delta puts closed at 43.5% IV versus 40.0% for the matching calls. That puts skew at 3.5 vol points in favor of puts.
- The 60-day norm for this name is −0.8 points, meaning calls are usually slightly richer.
- Skew's 7-day average is just 0.5 points.
Compared against this stock's own recent history, that jump is unusually large. "Unusual" here means unusual for TSLA, not versus the broader market. Friday's put-buying pace was also well above the norm for the name. Traders are paying a premium to protect against a drop.
Sentiment in short-dated options flipped in one session:
- The 0–7 day window reads −27, down from +50 on Thursday, against a 7-day average of +19.
- The 7–30 day window reads −24, down from +39 on Thursday, against a 7-day average of +2.
Every expiration window now leans bearish, which makes the overall picture broadly bearish across the curve. Our leading read of positioning swung the same way, from mildly positive Thursday to clearly negative Friday.
The counterweight is volume flow. Delta-weighted volume still favored calls, and more call contracts than puts cleared the unusual-volume bar (16 versus 10).
The key levels map
| Level | Price | Why it matters |
|---|---|---|
| Swing resistance | $432.86 | Only overhead swing-pivot cluster; it sits outside the Nov 6 range. |
| Call wall (Nov 6) | $425 | Heaviest Nov 6 call OI (7,204). It often caps rallies, and it built fast this week. |
| Call wall (whole chain) | $420 | Biggest call pile across all expirations (54,483 contracts). |
| Gamma flip (estimate) | $410 | Rough estimate of where hedging behavior shifts. It is also a top gamma strike and our invalidation level. |
| Technical resistance | $405.80 | Recent swing high cited by both chart models. |
| Friday's gap | $403.30 | Thursday's close, which is still an unfilled gap above price. |
| Put wall (Nov 6) / top gamma strike | $400 | Heaviest Nov 6 put OI (4,312) and the chain's single largest gamma concentration. Spot is sitting on it. |
| Technical support | $396.17 | Lower Bollinger Band in both chart reports. |
| Max pain (Nov 6) | $395 | The price where the most option value would expire worthless; expirations sometimes gravitate toward it. |
| Swing support | $386.48 | Nearest heuristic support cluster. |
| 200-day moving average | $385.30 | The long-term trend line. Price is 3.8% above it. |
| 20-day moving average | $380.70 | Short-term trend support. |
| Put wall (whole chain) | $380 | Biggest put pile across all expirations (34,464 contracts). |
| 50-day moving average | $369.60 | Sits below the Nov 6 implied range. |
The November 6 walls ($400 put, $425 call) and the whole-chain walls ($380 put, $420 call) disagree. For this expiration, the $400/$425 pair is the one that applies.
Positioning and unusual flow
Market makers hedge the options they've sold. In a positive-gamma regime, their hedging tends to dampen moves.
One rough estimate puts both the whole chain and the November 6 expiration in positive territory, which argues for pinning rather than acceleration. The same estimate places the gamma flip near $410, though. The gamma flip is the price below which market-maker hedging tends to accelerate selling rather than cushion it.
So spot is already a few percent below the flip. That is a typical distance for TSLA, but on the side where the cushion is thinner.
Notable live flow from Friday:
- Nov 2 $397.50 calls: 11,610 contracts traded against just 178 open, a turnover of about 65 times open interest. This was heavy, very short-dated speculation on a quick bounce.
- Nov 2 $395 puts: 20,108 contracts traded versus 1,254 open. The other side of that fight is a bet on Monday weakness.
- Nov 6 $387.50 puts: 6,301 contracts, about 10 times open interest. Fresh protection aimed just below max pain.
- Nov 6 at-the-money flow: about $12.2 million of premium changed hands in the Nov 6 $400 calls and $10.6 million in the $395 puts. Money was committed on both sides of the line.
3 · Technical check
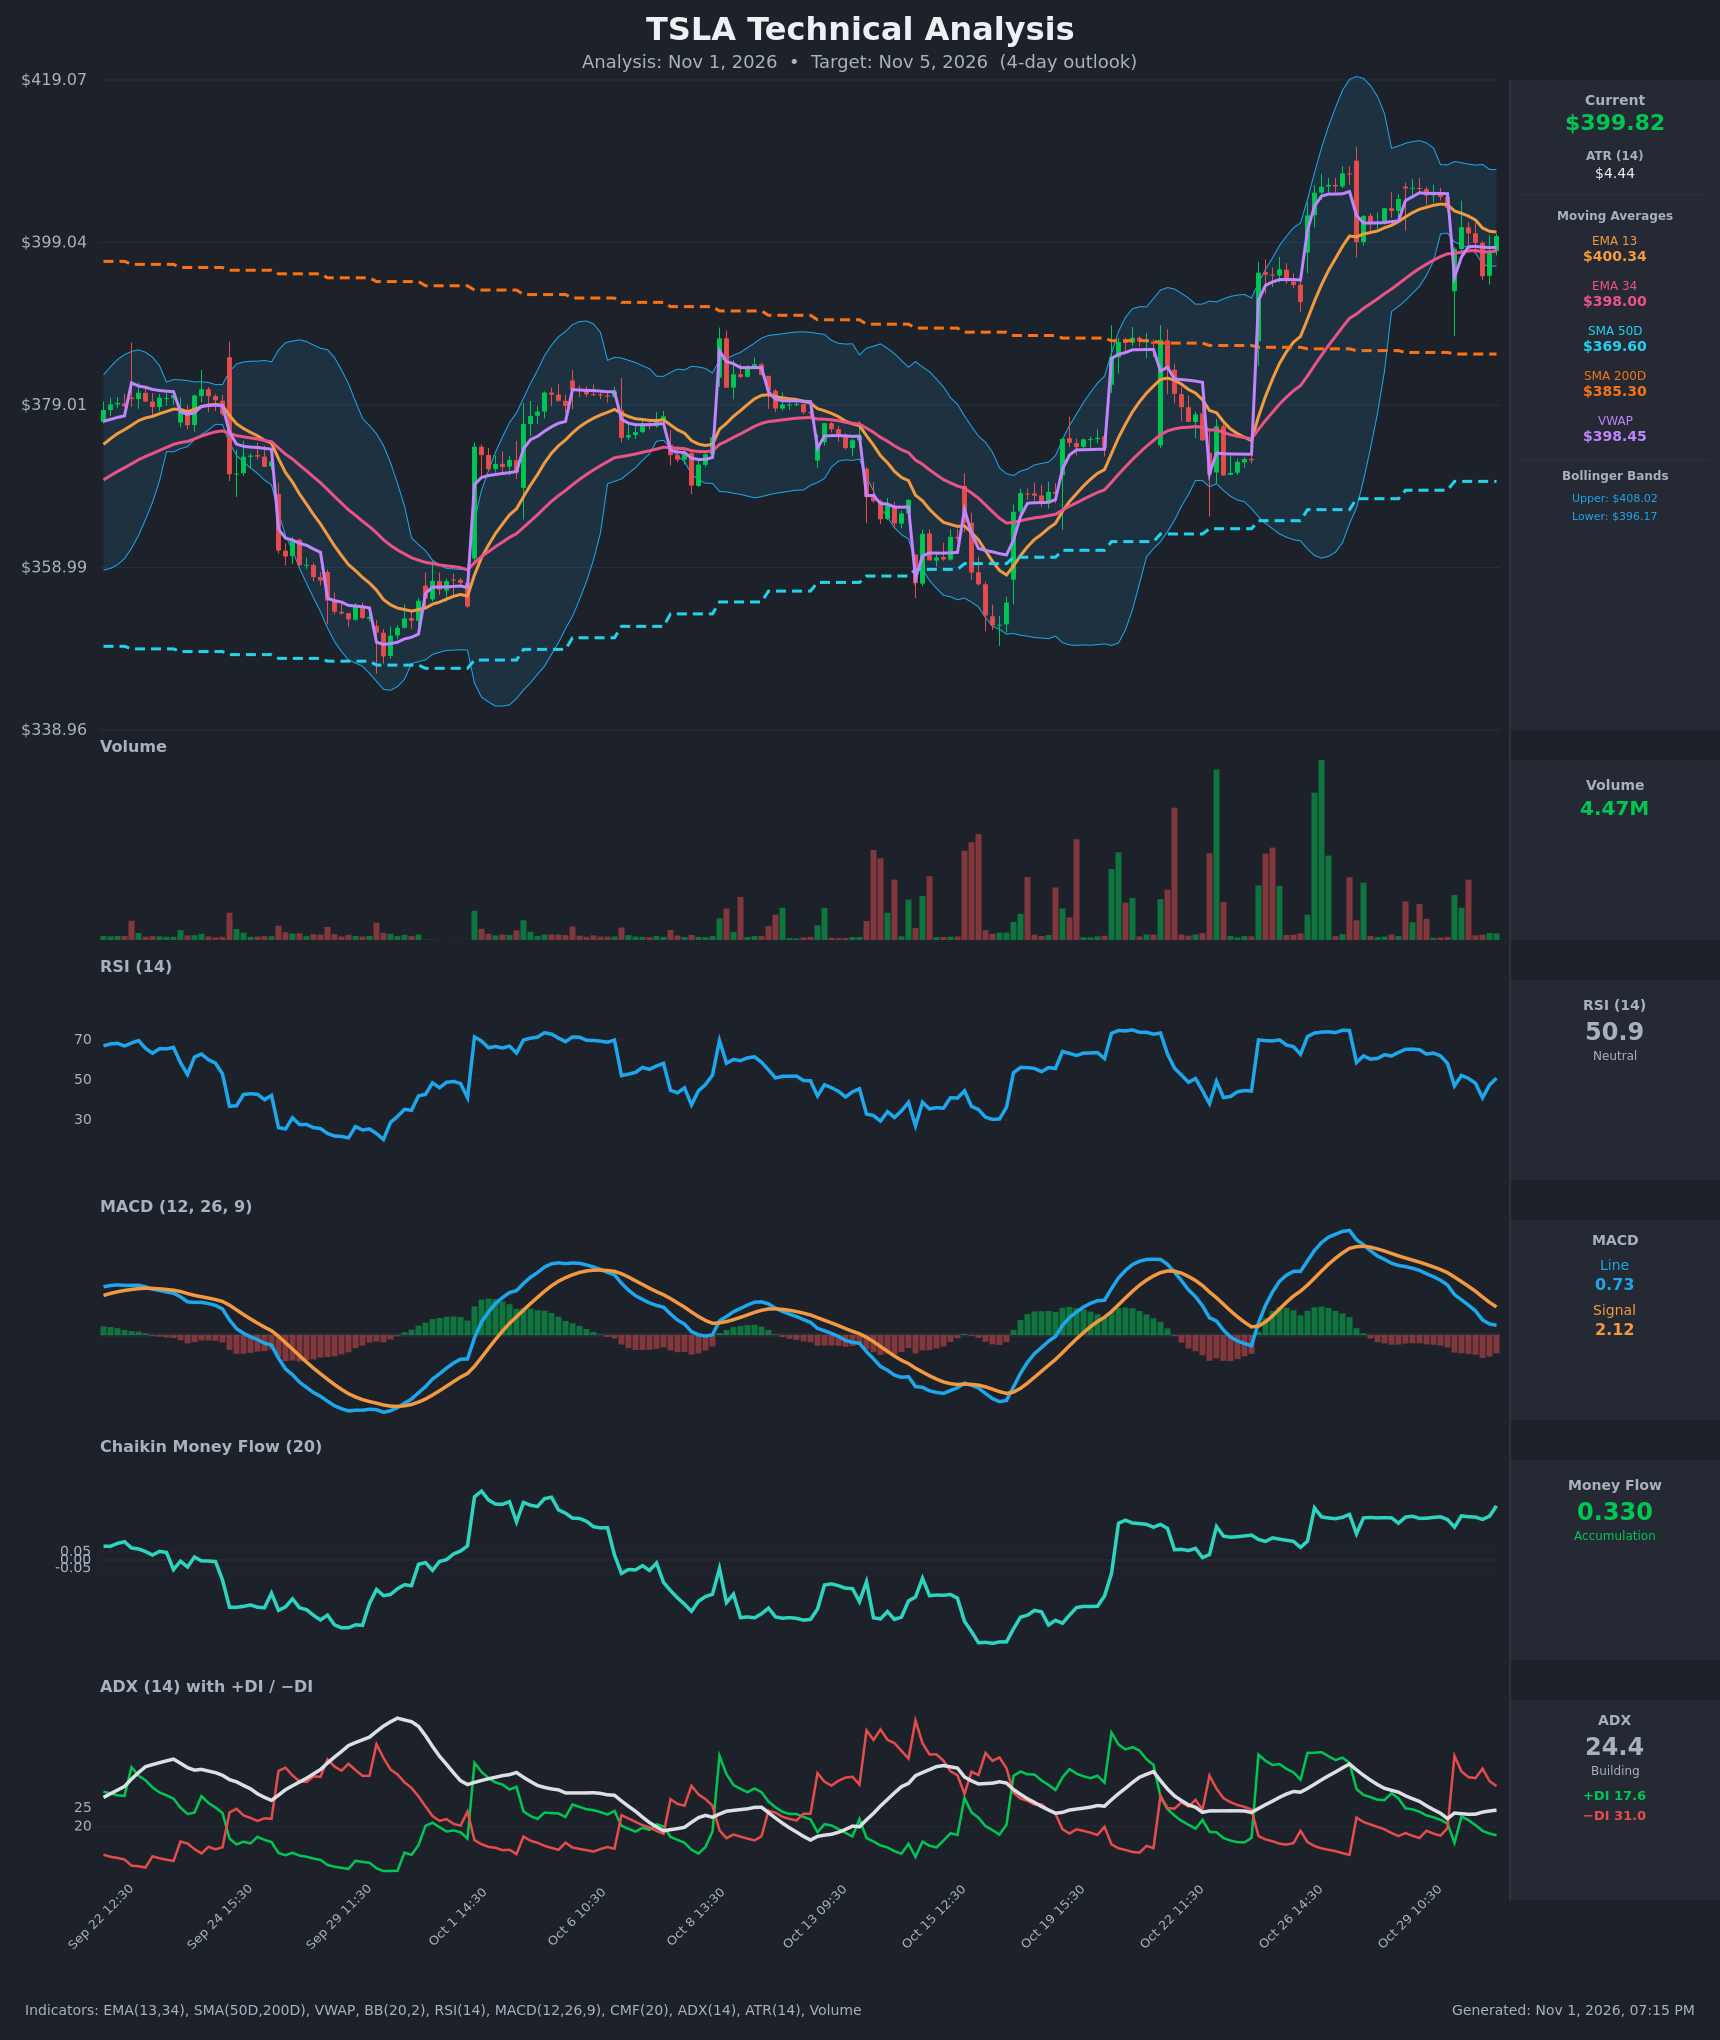
3-day model (through Nov 4): Diverges. This report is bullish, with a $403.50 target and a $392.50–$408.00 projected range. The target sits inside the options-implied Nov 4 band of $377.86–$421.76. Its direction cuts against our bearish tilt.
The model's case rests on strong money-flow accumulation that didn't confirm Friday's dip, plus a quick rejection of the $394.89 low. It invalidates on a close below $396.
5-day model (through Nov 6): Confirms. This report is bearish, with a $395.50 target and a $385.50–$407.00 range. Both sit inside the $373.70–$425.92 implied range, and the target lands almost exactly on the $395 max-pain strike. Its main evidence is a bearish MACD crossover and sellers holding directional control.
Model vs. Market: The options market implies $377.86–$421.76 into Nov 4, and the 3-day technical model targets $403.50. That is a mild up-drift well inside a much wider priced range. A close back above $405.80 would side with the bulls; a break of $394.90 would side with the 5-day bear case.
The confirming 5-day read nudged our strike selection. We centered the range trade near $400 and kept the bearish short strike at $410, above both models' upper rails.
Full technical write-ups: 3-day report → · 5-day report →
4 · Three ways the week can go
If TSLA pushes above $410 and toward the call wall ($425): A close above the ~$410 gamma flip estimate moves price to the side where hedging tends to cushion moves. It would also cancel our bearish lean. The fresh $425 call build is the next obstacle, and heavy call OI there tends to slow a rally into November 6.
If TSLA drifts between $395 and $405: This is the pin case. Spot sits on the largest gamma strike ($400), and the November 6 gamma estimate is positive. In that setup, hedging flows and expiring OI tend to pull price toward the $395–$400 zone into expiration. Max pain at $395 is the gravitational center.
If TSLA breaks below the put wall ($400) and $395: Losing $400 removes the November 6 expiration's biggest support. Below $394.90, Friday's low, both chart models point toward $388–$390. The next real structure is swing support at $386.48 and the 200-day average at $385.30. With spot already below the ~$410 flip estimate, one rough estimate suggests hedging would add to selling rather than cushion it.
5 · Three defined-risk structures
Prices are end-of-day midpoints as of October 30, 2026. All structures are hypothetical. Verify live prices before trading, because these will be stale by the open. With premium running rich versus delivered movement, credit structures lead.
If you lean bearish: Bear call spread
A bear call spread collects a credit and profits if the stock stays below the short strike through expiration.
- Trade: Sell the Nov 6 $410 call ($6.075 mid) and buy the Nov 6 $420 call ($3.225 mid).
- Credit: $2.85.
- Max profit: $285.
- Max loss: $715.
- Break-even: $412.85.
- Why it fits:
- Skew, short-dated sentiment and the leading positioning read all turned bearish Friday.
- The short strike sits at the ~$410 gamma flip estimate, above both chart models' upper rails.
- Premium is rich versus delivered movement, so the credit is fair for the risk.
- Makes sense only if: TSLA stays capped below Friday's $403.30 gap level early in the week.
- Invalidated if: TSLA closes above $410.
- Managing it:
- Close at ~50% of the credit.
- Exit by the November 4 session if it hasn't worked.
- The trend reads all still point up, so take profits early rather than holding into expiration.
- Liquidity note: The $410 and $420 calls each traded 15¢ wide. Fills should be easy.
- Analyze this position →
If you expect the range to hold: Iron condor
An iron condor sells a put spread and a call spread together. You collect a credit and keep it if the stock finishes between the short strikes.
- Trade: On the Nov 6 expiration:
- Buy the $375 put ($2.68).
- Sell the $385 put ($4.825).
- Sell the $415 call ($4.475).
- Buy the $425 call ($2.28).
- Credit: $4.34.
- Max profit: $434.
- Max loss: $566.
- Break-evens: $380.66 and $419.34.
- Why it fits:
- The November 6 gamma estimate is positive, with spot pinned on the top gamma strike.
- Max pain at $395 and the 5-day model's $395.50 target both sit near the middle of the tent.
- The long $425 call sits at the call wall.
- Makes sense only if: Friday's IV pop fades and price chops between $395 and $405.
- Invalidated if: TSLA closes below $385 or above $415.
- Managing it:
- Take 40–50% of the credit when offered.
- Close the threatened side if either short strike is touched.
- Don't hold into the final session.
- Liquidity note: The $385 puts traded 15¢ wide, the $375 puts 10¢, the $415 calls 15¢ and the $425 calls 6¢. All four legs are tight.
- Analyze this position →
If you lean bullish: Bull call spread
A bull call spread pays a debit and profits as the stock rises toward the short strike.
- Trade: Buy the Nov 6 $400 call ($10.475 mid) and sell the Nov 6 $410 call ($6.075 mid).
- Debit: $4.40.
- Max profit: $560.
- Max loss: $440.
- Break-even: $404.40.
- Why it fits:
- With IV rank at 18.89, buying premium is inexpensive versus the past year.
- The 3-day model's $403.50 target and the intact uptrend give the bull case a credible path toward $405–$410.
- Makes sense only if: TSLA reclaims $403.30 and holds above the $400 put wall.
- Invalidated if: TSLA closes below $395.
- Managing it: Take profits near $408–$410. Cut the trade if the $400 floor fails.
- Liquidity note: The $400 calls traded 25¢ wide and the $410 calls 15¢. Both are liquid.
- Analyze this position →
If none of these: no trade
Premium looks rich, but there are good reasons to wait before selling it:
- The richness is fragile. The gap over delivered movement was negative just three sessions ago and came back on a single 12% IV jump.
- Price is moving fast. Ten-day realized volatility of 43% is already above at-the-money IV, so the cushion for a premium seller is thin.
- The setup could break hard. Spot sits exactly on the $400 put wall, with put skew stretched unusually far for this stock. If that floor breaks, it could break fast.
- The signals disagree. The chart models point in opposite directions and the trend reads still point up, so a clear directional edge is missing.
Watching how price handles $400 on Monday and Tuesday costs nothing.
6 · Quick FAQ
What is TSLA's expected move this week? ±$26.11 (±6.53%) into the November 6 expiration, per straddle pricing as of the October 30 close. That gives a range of $373.70–$425.92.
Is TSLA expected to go up or down over the next week? Options positioning as of October 30 leans neutral with a bearish tilt, driven by a sudden jump in put demand and steeper skew. That is a read of what traders have done, not a forecast. The actionable map is the $373.70–$425.92 range and the $400/$425 levels.
Are TSLA options expensive right now? Only partly. IV rank of 18.89/100 means option prices are lower than about 81% of the past year's readings. On top of that, they're running about 5 vol points above the movement TSLA has actually delivered, which is richer than 82% of this stock's recent readings. That richness only appeared on Friday.
Where is TSLA's biggest options support and resistance? For November 6, the put wall is $400 and the call wall is $425. Max pain is $395.
What invalidates this week's read? A TSLA close above $410.
Methodology & disclosures. Data: end-of-day options-chain snapshot for TSLA, 2026-10-30, generated 2026-11-01T19:15:50.152Z. Prices shown are midpoints and will differ from live markets. Momentum/positioning scores and volatility-premium comparisons are descriptive measurements of past option flow and past price movement — not investment advice, signals, forecasts, or guarantees. All trade structures are hypothetical. Every structure shown has a defined maximum loss; you can lose the entire max-loss amount. Options involve substantial risk and are not suitable for all investors.