USO Options Are Pricing a ±$12.79 Move Into Friday — The Chart Model Sees a Third of That
Options on USO imply a $142.11–$167.69 range into the September 18 expiration, while both chart models look for a tight drift toward $157.50. Here's what the positioning actually shows, the levels that matter, and three defined-risk ways to trade the gap.

The options market implies a $142.11–$167.69 range into the September 18 expiration; here's what's driving that unusually wide band and three defined-risk ways to trade it.
Published Sunday, September 13, 2026 · Data as of the September 11, 2026 close
Explore the live USO options data in the Detailed Options Analyzer →
Quick answer
| Item | Answer |
|---|---|
| Market bias | Neutral |
| Options-implied range (into Sep 18) | $142.11 – $167.69 (±8.26%, or about ±$12.79 on a $154.90 close) |
| Major support | Put wall $115.00 (Sep 18 expiration) — 26% below spot, so the practical floor references this week are max pain at $145.00 and swing support at $154.08 |
| Major resistance | $160.00 — the Sep 18 call wall |
| Max pain (Sep 18) | $146.00 |
| Dealer gamma regime (estimate) | Positive — in this regime market-maker hedging tends to dampen moves; flip level ≈ $152 (estimate) |
| Volatility condition | Rising — ATM IV 55.8%, up 29.4% in five sessions · IV rank 29/100 · premium rich: options priced about 17 vol points above delivered movement |
| Technical check | Mixed — both chart models read bullish ($157.00 at 3 days, $157.50 at 5 days), but their targets sit deep inside the options-implied range |
| Best-fitting strategy | Iron condor (Sep 18 $145/$138 puts + $160/$165 calls), conditional on the range holding |
| Analysis invalidated if | USO closes below $146.00 |
1 · What matters today
USO closed at $154.90 after a 9.0% five-day run, and the options market is bracing for more of the same: the September 18 expiration prices a move of roughly ±$12.79, or ±8.26% — that's the move implied by what at-the-money straddles cost, and it works out to a $142.11–$167.69 band in a single week. Our read of the flow, though, is genuinely balanced. Positioning, momentum, near-dated sentiment and wall placement disagree with each other, and the composite lands at neutral rather than pretending otherwise.
The single most important level is $160.00 — the strike with the biggest pile of open call contracts for Friday's expiration, and the level that has historically acted like a ceiling into expiry. Below, max pain sits at $146.00. Both chart models lean bullish toward roughly $157.50, which fits inside the options range rather than fighting it. A close below $146.00 breaks this read.
2 · What the options market is pricing
What changed this week
Price did the moving: USO is up 9.0% over five sessions and 23.9% over twenty, and it closed within 2.5% of its 52-week high of $158.88. Implied volatility — the market's estimate of how much USO will move, baked into option prices — followed it up, with chain-wide ATM IV at 55.8%, a 29.4% jump over five days, and now sitting above both its 30-day average (47.6%) and its 90-day average (53.9%). IV rank has climbed to 29/100 against a 7-day average of 20.7 and a 14-day average of 18.5.
Underneath, the positioning is split. Put volume ran at 0.68 contracts per call on Thursday — below the 14-day average of 0.80, so daily flow is actually call-tilted versus its own recent norm — but open interest moved the other way: the put/call open-interest ratio rose to 0.82 from a 7-day average of 0.70, with put open interest adding 73,927 contracts against 24,263 on the call side in a single session. That is an unusually heavy one-day put build for this name. The biggest forward-looking open-interest change was the October 16 $151 calls, up 4,011 contracts; on Friday's expiration itself, the $160 calls had added 4,494 contracts before settling worthless — settled history, not a live level.
The short- and long-term trend reads agree for once: price and flow both lean bullish over the 5-, 20- and 50-day windows. The one wrinkle is a fresh crossover on September 8, when the fast option-flow composite dropped below its slower version — the first stall signal since the rally began.
Expected move
Into September 18, options price a ±8.26% move — about ±$12.79 around the $154.90 close. Here is the ladder (Friday, September 11 has already expired and is excluded):
| Expiration | Implied move | Range around $154.90 |
|---|---|---|
| Sep 16 (5 days) | ±6.82% | $144.34 – $165.46 |
| Sep 18 (7 days) | ±8.26% | $142.11 – $167.69 |
| Sep 25 (14 days) | ±11.55% | $137.01 – $172.79 |
| Oct 16 (35 days) | ±17.04% | $128.50 – $181.30 |
The ladder rises smoothly with time rather than stepping up at any one rung — there's no single dated event the chain is pricing around, just a broadly elevated volatility regime across the curve.
Volatility
ATM IV of 55.8% puts IV rank at 29/100 — option prices are cheaper than 71% of the past year's readings, which sounds calm until you notice that IV is up 29.4% in a week and slipped only 4.2% on the final session. The comparison against the past year is being flattered by a much more violent stretch earlier in the cycle. The front-month read is unavailable in this snapshot because the nearest expiration was a same-day expiry, an artifact that resolves the next session.
Two observations versus USO's own recent history are worth flagging. Twenty-day realized volatility is 38.7% — actually below this stock's own recent norm despite the headline rally. But the 5-day-to-20-day realized ratio is 1.21, meaningfully above its norm: movement is accelerating inside a month that had been comparatively orderly.
Premium rich or cheap. The volatility risk premium — the gap between how much movement options are priced for and how much USO has actually delivered — is running at roughly 17 vol points in favor of sellers. That reading is richer than about 96% of this stock's own recent readings, which is as stretched as this gauge gets. The path matters too: the gap was negative as recently as September 4 (options cheaper than delivered movement) and flipped hard positive over the following week as IV chased the rally. That combination — IV rank 29 but a 96th-percentile premium over delivered movement — favors collecting premium rather than owning it this week, with the caveat that a premium this rich usually reflects real movement risk rather than a gift.
Skew and sentiment
The 25-delta skew comparison — how much more puts cost than calls at the same distance from spot — isn't computable in this snapshot because there was no valid 25-delta call reading. What the near-dated curve does show runs the other way from typical crash-protection behavior: in the nearest expirations, 25-delta calls are priced about 11.4 vol points richer than the equivalent puts, against a roughly 4.0-point norm for this name. Traders are paying up for upside, not downside.
Sentiment in short-dated options scores +25 in the 0–7 day bucket and +28 in the 7–30 day bucket, both flipped positive from 7-day averages of −6 and −10. The longer end disagrees: the 60–120 day bucket sits at −41 on steady put building. The overall regime label is "Mixed," and that's fair — the front of the curve is leaning with the rally while the back is hedging against it.
The key levels map
| Level | Price | Why it matters |
|---|---|---|
| Top of implied range (Sep 18) | $167.69 | Upper rail of the one-week move options are pricing |
| Heavy call strike (Sep 18) | $165.00 | 6,103 calls open; the next shelf above the wall |
| Call wall (Sep 18) | $160.00 | 10,182 calls open — also the chain's heaviest call strike overall at 38,471; the aggregate and the expiration agree here |
| 52-week high | $158.88 | Price closed 2.5% below it |
| Gap zone / chart resistance | $158.38 | Prior close before Friday's −3.71% opening gap; the chart models put resistance at $158.40–$158.50 |
| Spot | $154.90 | Chain-snapshot close |
| Swing support | $154.08 | Nearest heuristic swing-pivot cluster (estimate) |
| Gamma flip level | ≈$152 | Estimate only — below this, one rough model suggests hedging amplifies selling rather than cushioning it |
| Largest gamma strike (all expirations) | $150.00 | Heaviest combined gamma in the chain; a natural magnet on a pullback |
| Max pain (Sep 18) | $146.00 | Where the most option value would expire worthless — expirations sometimes gravitate toward it |
| Bottom of implied range (Sep 18) | $142.11 | Lower rail of the priced move |
| Swing support | $141.88 | Next structural shelf below |
| 20-day moving average | $137.11 | Price is 13.0% above it — the rally is extended |
| Put wall (Sep 18) | $115.00 | 10,119 puts open, but 26% below spot — legacy protection, not a live floor this week |
Positioning and unusual flow
For the September 18 expiration, the dealer-gamma estimate is positive — under that model's assumptions, market-maker hedging leans against moves rather than accelerating them, which argues for chop inside the walls rather than a clean trend. The whole-chain estimate agrees. Treat both as estimates, not observed inventory. One caveat: spot sits only about 1.9% above the estimated flip level, a thinner cushion than is normal for this name.
Three flow items stand out, all in live contracts. The September 18 $154 calls traded 3,995 contracts against 637 open — roughly 6× turnover and $2.21 million of premium, classic same-week directional positioning right at the money. The September 18 $145 puts traded 6,315 contracts, the top of their peer group, for $881,000 of premium. And the single largest dollar-premium line in the entire chain wasn't near-dated at all: the October 16 $150 puts moved 4,068 contracts for $3.12 million — someone is buying a month of downside insurance while the front week chases calls.
3 · Technical check
Both chart models read bullish. The 3-day model targets $157.00 with a projected range of $151.50–$158.50; the 5-day model, which lands exactly on our September 18 expiration, targets $157.50 with a projected range of $150.50–$159.50. Both lean on the same evidence: price holding above its fast moving average with strongly positive money flow, ADX at 32.8 with the bullish directional line dominant, and a tight consolidation under the September 10 high of $158.36 that reads as a continuation pause. Both also flag the same counterweight — MACD has crossed below its signal line and RSI has fallen from 87 to 63.
Direction-wise that's a lean our options read doesn't share, so we class it as Mixed rather than confirming. But the more interesting divergence is magnitude, not direction.
Model vs. Market: The options market implies $142.11–$167.69 into September 18 — a $25.58-wide band. The 5-day technical model projects $150.50–$159.50, a $9.00 band around a $157.50 target. Options are pricing roughly three times the movement the chart expects, which is precisely why premium selling, not premium buying, is the structure family that fits this week.
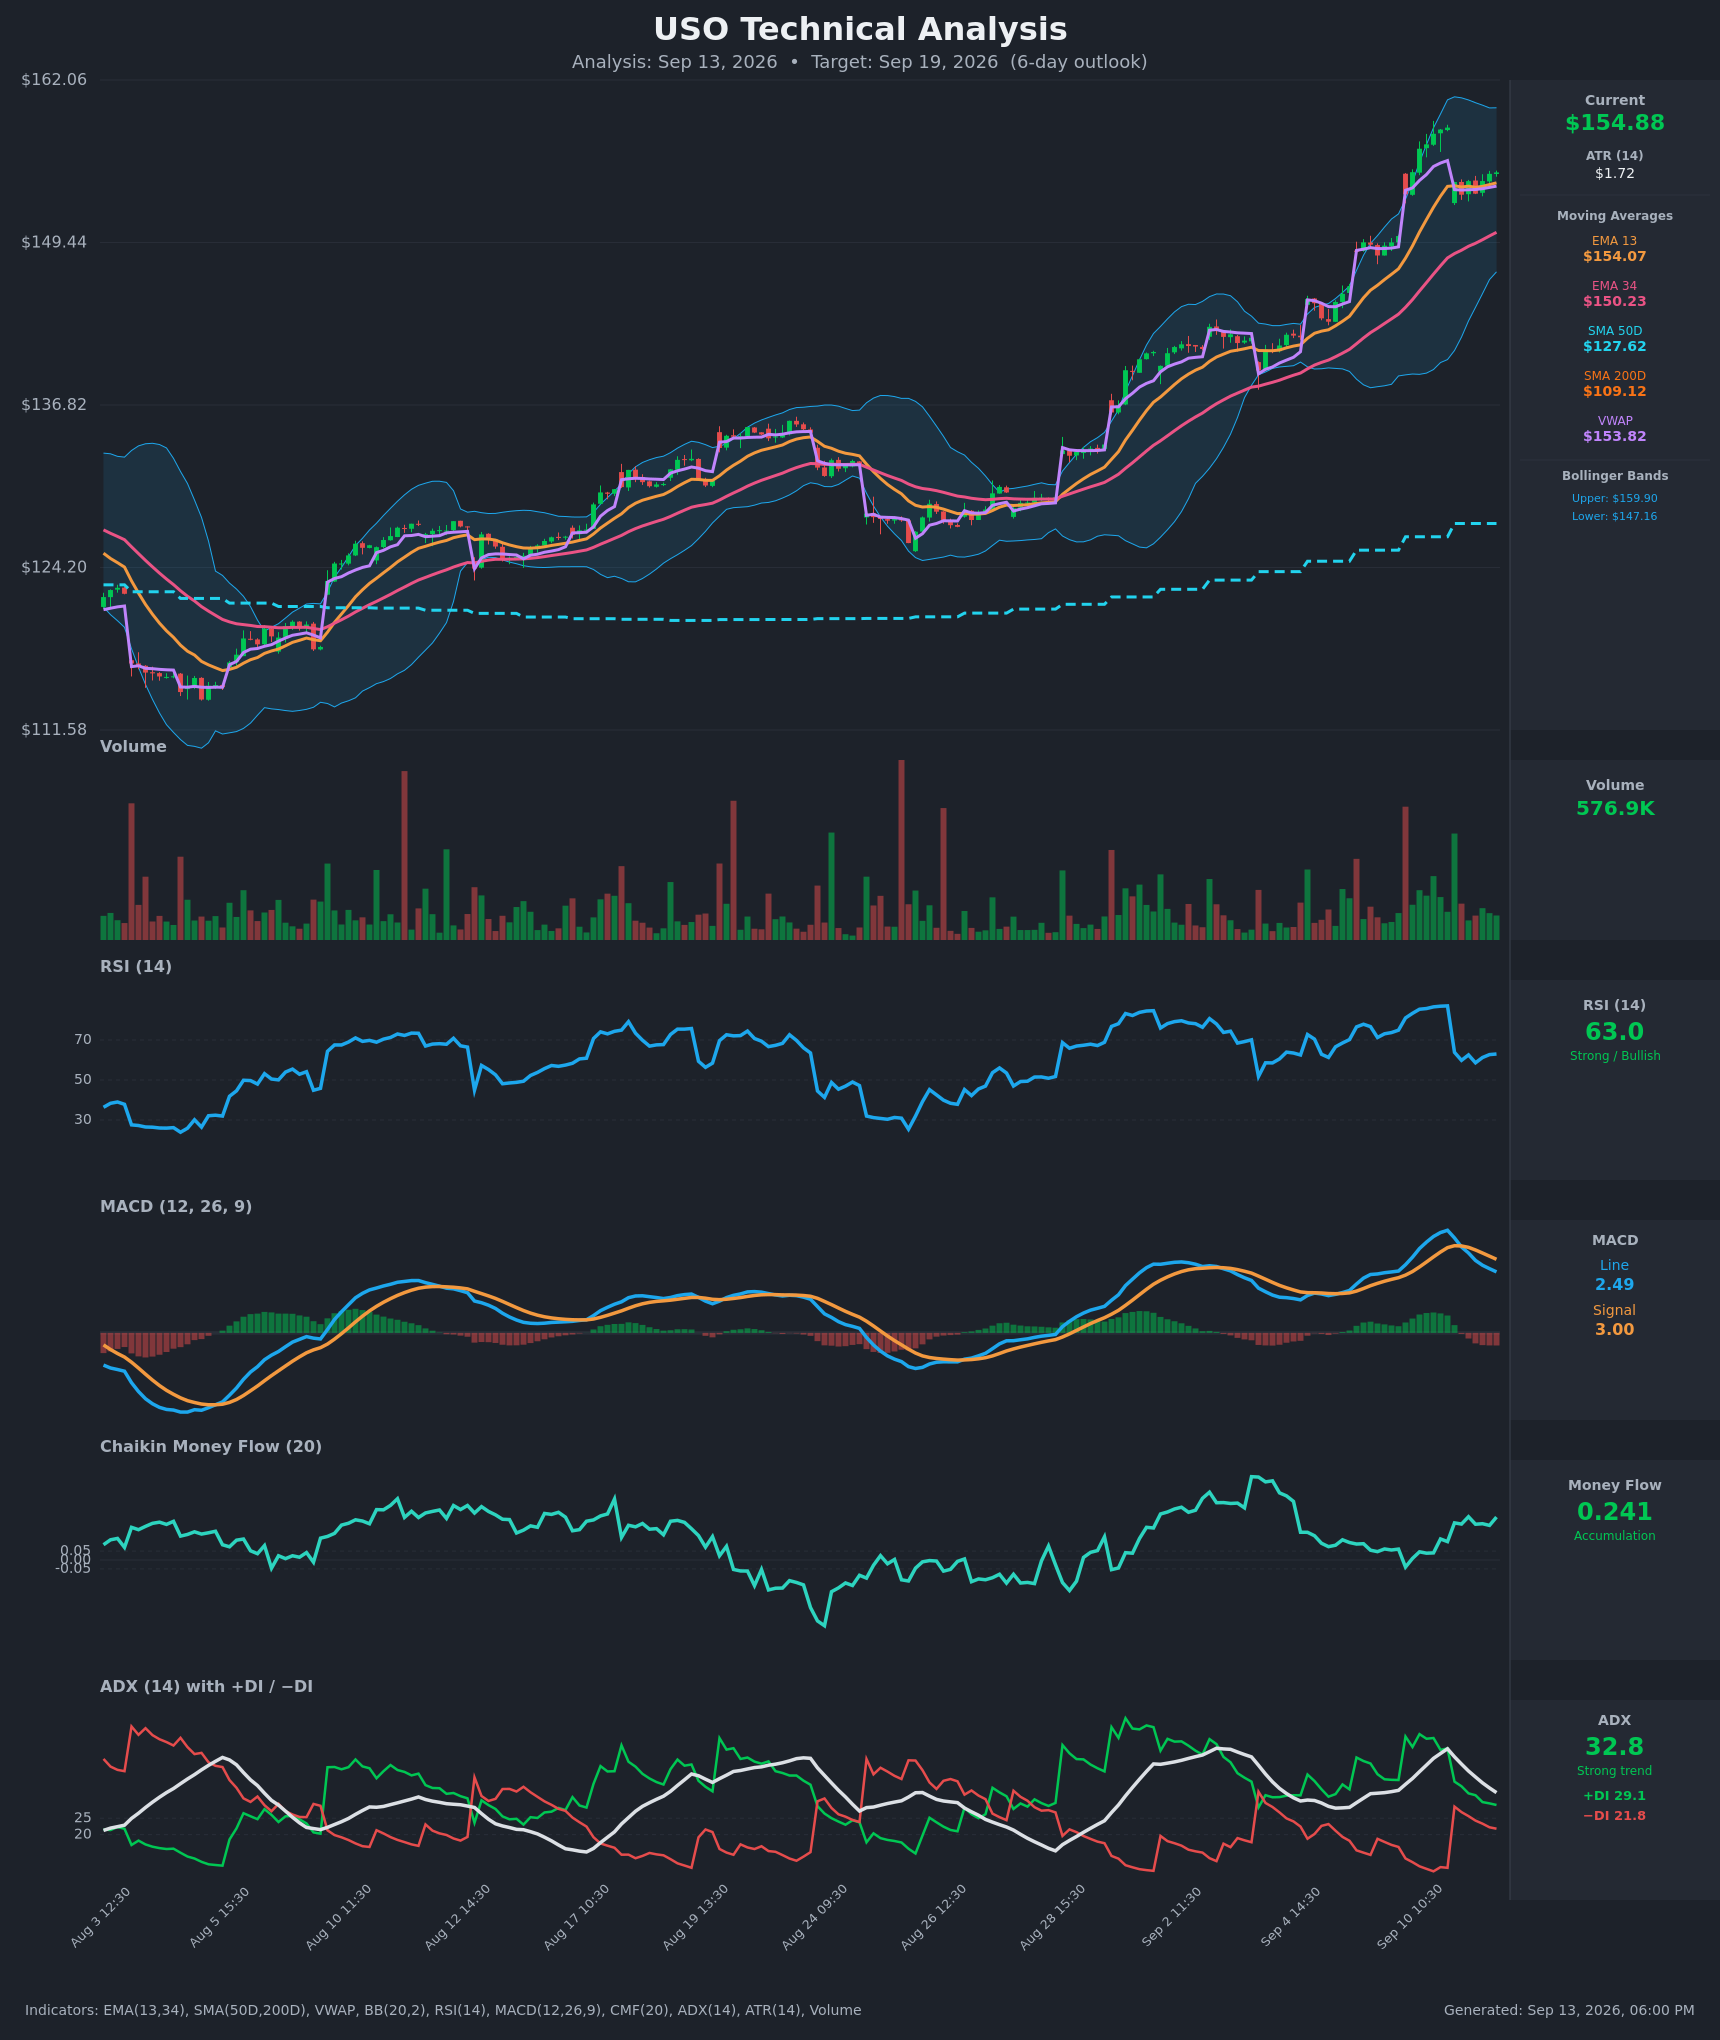
Practically, the TA nudged one thing: the bullish structure's short strike sits at $148, comfortably below both models' invalidation levels ($151.50 and $150.20), rather than up near the money.
Full technical write-ups: 3-day report → · 5-day report →
4 · Three ways the next five days can go
If USO pushes above the call wall ($160.00): That strike carries 10,182 open calls for Friday alone and 38,471 across the chain — the heaviest overhead cluster by a wide margin, and the kind of concentration that tends to slow rallies as hedging flows lean against them. A clean break through leaves thinner positioning until $165.00 (6,103 calls open) and then the implied-range ceiling at $167.69.
If USO drifts between the levels: This is what a positive dealer-gamma estimate describes — hedging that dampens rather than amplifies, with price chopping between the $154.08 swing shelf and the $160.00 wall. Note that max pain for this expiration sits at $146.00, below spot, so the expiring-open-interest math tugs gently downward rather than upward; that pull is usually only visible in the last day or two before expiry.
If USO breaks below $152: That's the estimated gamma flip level, and spot sits unusually close to it for this name — below there, one rough estimate suggests market-maker hedging starts amplifying selling instead of cushioning it. The next references are the $150 gamma cluster, max pain at $146.00, and then the implied-range floor at $142.11 alongside swing support at $141.88. Do not expect the $115.00 put wall to do any work; it is far too deep to matter this week.
5 · Three defined-risk structures
Prices are end-of-day midpoints as of September 11, 2026. All structures are hypothetical. Verify live prices before trading — these will be stale by the open.
If you expect the range to hold: iron condor
- Trade: Sell the Sep 18 $145/$138 put spread and the Sep 18 $160/$165 call spread (four legs, one condor)
- Credit: ~$2.09 ($209) · Max profit: $209 · Max loss: $491 on the put side, $291 on the call side · Break-evens: $142.92 and $162.09
- Why it fits: A credit spread pays you up front and wins if price stays away from your short strikes. With premium running about 17 vol points above delivered movement — richer than 96% of this stock's own recent readings — and both chart models projecting a band roughly a third as wide as the options-implied one, this is the structure the data points at. The short call sits exactly on the $160.00 call wall; the short put sits below max pain at $146.00.
- Makes sense only if: you accept that a 9% weekly move just happened and can happen again — the lower break-even at $142.92 is barely outside the implied floor.
- Invalidated if: USO closes below $146.00 or above $160.00.
- Managing it: Close at roughly 50% of max credit; exit regardless by Thursday's close rather than carrying pin risk into Friday. If either short strike is breached on a closing basis, close that side instead of hoping.
- Liquidity note: The $145 puts traded 7¢ wide on 6,315 contracts and the $160 calls 15¢ wide on 6,205 — both easy fills. The $138 long put is the weak leg at 11¢ wide on a 41.5¢ mid, so work the whole package as one limit order rather than legging in.
- Analyze this position →
If you lean bullish: short put spread
- Trade: Sell the Sep 18 $148 put, buy the Sep 18 $144 put
- Credit: ~$0.99 ($99) · Max profit: $99 · Max loss: $301 · Break-even: $147.02
- Why it fits: You collect premium and keep it as long as USO stays above $148 — a level that sits below both chart models' invalidation triggers ($151.50 and $150.20) and below the estimated gamma flip at $152. Near-dated sentiment in the 0–7 and 7–30 day buckets has flipped positive, and short-dated 25-delta calls are pricing about 11.4 vol points over equivalent puts against a ~4.0-point norm, so the front of the curve is leaning the same way.
- Makes sense only if: the bull-flag read is right and last week's 9% advance consolidates rather than unwinds.
- Invalidated if: USO closes below $148.00.
- Managing it: Take 50–60% of max credit and leave. Because the short- and long-horizon flow reads recently crossed against each other, this is a take-profit-early structure, not a hold-to-expiry one.
- Liquidity note: The $148 puts traded 15¢ wide on 2,170 contracts, the $144 puts 8¢ wide on 3,093 — acceptable, but the short leg's spread is about 7% of its mid, so price the package, not the legs.
- Analyze this position →
If you lean bearish: short call spread
- Trade: Sell the Sep 18 $160 call, buy the Sep 18 $165 call
- Credit: ~$1.11 ($111) · Max profit: $111 · Max loss: $389 · Break-even: $161.11
- Why it fits: This is the condor's upper wing standing alone, for anyone who thinks the rally is exhausted. It sells the heaviest call open interest on the board and keeps full value as long as USO finishes below $160.00. Max pain at $146.00 sits well below, and the longer-dated sentiment buckets are building puts, not calls.
- Makes sense only if: $158.36–$158.88 (the September 10 high and the 52-week high) caps the advance — the cooling RSI and MACD crossover both chart models flagged are the supporting evidence.
- Invalidated if: USO closes above $160.00.
- Managing it: Close at 50% of max credit; a decisive break of the 52-week high on volume is a reason to exit immediately rather than wait for the short strike.
- Liquidity note: The $160 calls traded 15¢ wide on 6,205 contracts against 10,182 open; the $165 calls 8¢ wide on 2,814. This is the most liquid pair on the expiration.
- Analyze this position →
If none of these: no trade
Premium being rich is not the same as premium being free, and this is the week to say so. The 17-vol-point gap between implied and delivered movement exists because USO just moved 9% in five sessions and 23.9% in twenty, with the 5-day realized pace running 21% above its own monthly pace. Sellers are being paid more than usual precisely because the delivered move has a real chance of catching up. A ±8.26% weekly expected move means a single gap — and there have been six gaps of 1.8% or larger in the past month, including a −3.71% opener on Friday — can blow through a short strike overnight. If you can't size these to survive the full max loss, or you can't watch them intraday, standing aside is the better trade. Nothing in the neutral read demands a position.
6 · Quick FAQ
What is USO's expected move this week? About ±$12.79, or ±8.26%, into the September 18 expiration — a $142.11–$167.69 range around the $154.90 close, per straddle pricing as of September 11.
Is USO expected to go up or down over the next five days? Options positioning as of September 11 reads genuinely neutral — near-dated sentiment and call-side pricing lean up while the leading positioning composite and heavy put open-interest building lean down — and that's a description of what traders have done, not a forecast. The actionable map is the $142.11–$167.69 range with $160.00 overhead and $146.00 below.
Are USO options expensive right now? Two lenses, two answers. IV rank of 29/100 says option prices are lower than 71% of the past year's readings. But they're running about 17 vol points above the movement USO has actually delivered over the past month — richer than roughly 96% of this stock's own recent readings. On balance, that favors collecting premium over owning it, as long as you respect how fast this name has been moving.
Where is USO's biggest options support and resistance? Resistance is the $160.00 call wall for September 18 (10,182 contracts open). The nominal put wall is $115.00, far too deep to function as support this week — the levels that matter below are max pain at $146.00 and swing support at $154.08.
What invalidates this week's read? A close below $146.00.
Methodology & disclosures. Data: end-of-day options-chain snapshot for USO, 2026-09-11, generated 2026-09-13T18:00:38Z. Prices shown are midpoints and will differ from live markets. Momentum/positioning scores and volatility-premium comparisons are descriptive measurements of past option flow and past price movement — not investment advice, signals, forecasts, or guarantees. All trade structures are hypothetical. Every structure shown has a defined maximum loss; you can lose the entire max-loss amount. Options involve substantial risk and are not suitable for all investors.