USO Options Are Pricing a ±$9.61 Move Into Sept 25 — But the Pin Target Sits Above the Tape
The options market implies a $144.21–$163.43 range for USO into the September 25 expiration, with the heaviest put open interest parked at $150 and the call wall — and max pain — both sitting at $160. Here's what the positioning says, where the technical read disagrees, and three defined-risk ways to trade the next six days.
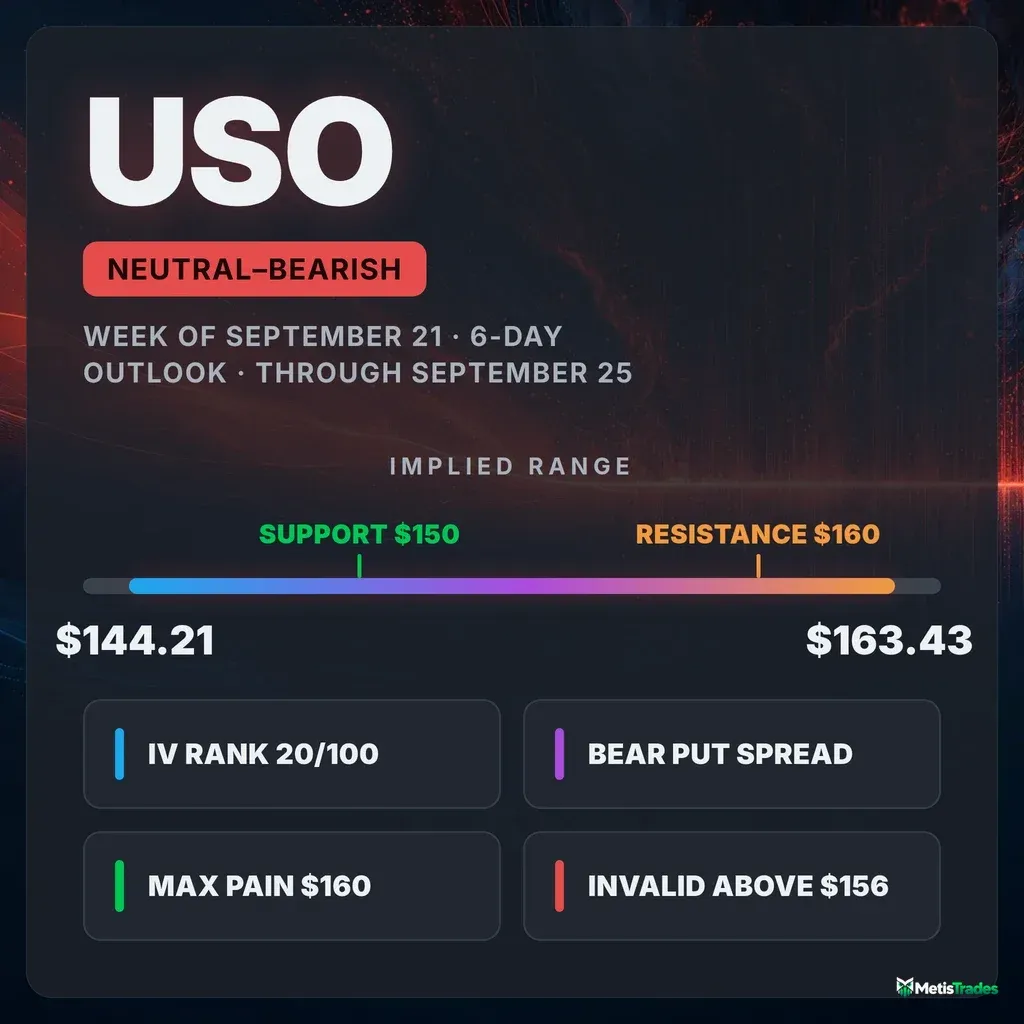
The options market implies a $144.21–$163.43 range into the September 25 expiration; here's what's driving it, where the chart model disagrees, and three defined-risk ways to trade it.
Published Saturday, September 19, 2026 · Data as of Friday, September 18, 2026 close
Explore the live USO options data in the Detailed Options Analyzer →
Quick answer
| Item | Answer |
|---|---|
| Market bias | Neutral with a bearish tilt |
| Options-implied range (into Sept 25) | $144.21 – $163.43 (±6.25%, or ±$9.61 around the $153.82 close) |
| Major support | $150.00 (Sept 25 put wall) |
| Major resistance | $160.00 (Sept 25 call wall) |
| Max pain (Sept 25) | $160.00 |
| Dealer gamma regime (estimate) | Negative — hedging tends to amplify moves; a flip level could not be estimated from today's chain |
| Volatility condition | Falling — IV rank 20/100 · premium fair: options priced about 4.3 vol points above delivered movement |
| Technical check | Confirms (bearish, both the 3-day and 6-day models) |
| Best-fitting strategy | Bear put spread — $153/$148, September 25 expiration |
| Analysis invalidated if | USO closes above $156.00 |
1 · What matters today
USO closed Friday, September 18 at $153.82 after a 0.7% slide over five sessions — a pause inside a run that still has the fund up 14.3% over twenty sessions. Our read of option flow leans mildly negative: put open interest has been building faster than call open interest, and sentiment in short-dated options has turned broadly bearish. But the lean is mild, and it fights a bigger picture that is still firmly up, so treat it as a tilt rather than a call.
The options market is pricing a move of roughly ±$9.61 (±6.25%) through Friday, September 25 — that's derived from what straddles cost at that expiration — which frames a $144.21–$163.43 range. Inside that, two levels matter: the biggest pile of open put contracts at $150, and the biggest pile of calls at $160. A close above $156.00 kills the bearish tilt. The 3- and 6-day technical models both point lower, which is the one place chart and flow agree.
2 · What the options market is pricing
What changed this week
The clearest shift is in who is holding what. Put open interest relative to call open interest went from 0.82 to 1.08 over five sessions — for every call contract held open there are now 1.08 puts, against a 14-day average of 0.76 and a 7-day average of 0.88. Traders added downside protection at a steady clip, and the single biggest change was the September 25 $147 puts, which gained 2,367 contracts of open interest to 2,527. Day-over-day, call open interest fell by 2,256 contracts while put open interest rose by 10,805.
Volatility went the other way. At-the-money implied volatility — the market's estimate of how much USO will move, baked into option prices — finished at 46.6%, down 4.0% on the day and 16.4% over five sessions, and now sits just below its 30-day average of 47.4% and well under its 90-day average of 52.8%. Total option volume ran 1.42× its 20-day average, so this was an active session, not a quiet one. Put volume relative to call volume came in at 0.84 — still call-tilted in absolute terms, but 29% above this name's own 60-day median of 0.65.
The multi-horizon trend read is aligned bullish over the medium (+14.3% over roughly twenty sessions) and long (+41.1% over roughly fifty) windows, with the past week flat — so the short-term flow deterioration is happening inside an intact uptrend, not against a broken one. The flow read did flip from bullish to bearish on September 16, which is a fresh turn worth watching rather than a settled one.
For context on what just settled: into Friday's expiration, the $155 puts shed 1,996 contracts of open interest and the $150 puts shed 1,109 — history now, not actionable.
Expected move
Into September 25, the options market is pricing a move of ±6.25%, or about ±$9.61 around the $153.82 close — a $144.21 to $163.43 range. Here is the ladder across the next several expirations:
| Expiration | Implied move | Range around $153.82 |
|---|---|---|
| Sept 23 (5 days) | ±5.25% | $145.74 – $161.90 |
| Sept 25 (7 days) | ±6.25% | $144.21 – $163.43 |
| Sept 30 (12 days) | ±7.97% | $141.56 – $166.08 |
| Oct 16 (28 days) | ±12.89% | $133.99 – $173.65 |
The rungs scale smoothly with time — there is no kink or step-up anywhere on the ladder, which is what you'd expect from a commodity fund with no scheduled single-event risk in the window. At-the-money implied vol is nearly identical at every rung (45.2% at September 25, 46.5% at October 16), so the market is not pricing any particular date as special.
Volatility
At-the-money implied volatility of 46.6% carries an IV rank of 20/100 — meaning today's reading is cheaper than about 80% of the past year's readings — with an IV percentile of 52. The two measures disagree because USO spent most of the past year at far higher volatility with occasional spikes; the rank says option prices are near the low end of the annual range, the percentile says today is a typical day. IV is falling on every window we measure: down 4.0% in a day, 16.4% in five sessions, 13.5% in thirty. The front-month read is unavailable today (expiry day), so the term-structure comparison across expirations has to come from the ladder above rather than an interpolated slope.
Realized movement is easing too, though less dramatically: 20-day realized volatility of 42.4% is below this stock's own recent norm — compared against USO's own history, that counts as a calm stretch for this name — and the 5-day-versus-20-day movement ratio is 0.95, essentially typical. The broad-market volatility index sits near the floor of its own 52-week range (rank 8/100) and has tracked USO's implied vol reasonably closely over the past 60 sessions, so there's no cross-asset stress bid feeding these option prices.
Premium rich or cheap? The volatility risk premium — the gap between how much movement options are priced for and how much USO has actually delivered — sits at about 4.3 vol points (46.6% implied against 42.4% realized over 20 days). When that gap is positive, option sellers have been collecting more than realized movement cost them. Today's gap ranks at the 54th percentile versus this stock's own recent readings, meaning richer than about 54% of them — squarely middle-of-the-road, and modestly above its own norm on the intensity read. The path matters more than the level: that gap peaked near 19 vol points on September 10 and has collapsed by three-quarters since, as implied vol drained while realized movement stayed put. Combination verdict — IV rank 20 and a 54th-percentile premium over delivered movement — means neither side of the premium trade has a real edge this week, with a slight nod toward owning premium rather than selling it, because the absolute level of implied vol is near the bottom of its annual range.
Skew and sentiment
The 25-delta skew comparison — how much more expensive puts are than equidistant calls — could not be computed from Friday's chain, so the cleanest "are traders paying up for crash protection" read is unavailable today. What we do have is positioning. Sentiment in short-dated options reads broadly bearish: the 0–7 day bucket scores −9, the 7–30 day bucket −30, 30–60 day −21 and 60–120 day −14. Every bucket leans the same direction, and none dominates — which is the signature of steady hedging rather than one desperate trade. Note the 7-day average for the front bucket was +8, so this front-end negativity is new, not entrenched.
The composite flow read sits at −25 on a −100/+100 scale, dragged there by put-side open-interest building and mild price weakness, and partly offset by call-side sweeps (16 call contracts versus 15 puts cleared the unusual-volume bar). Both the open-interest drift and the net-new-open-interest readings are running more put-tilted than their own recent norms for this name, while the raw put-to-call volume ratio is about typical. In plain terms: traders are holding more puts than usual, but they are not trading them unusually hard.
The key levels map
| Level | Price | Why it matters |
|---|---|---|
| Top of Sept 25 implied range | $163.43 | Upper edge of the move the options market is pricing |
| 52-week high | $163.35 | 5.8% above Friday's close; USO sits at the 90th percentile of its annual range |
| Call wall (Sept 25) + max pain | $160.00 | Heaviest call open interest for the expiration (2,463) — and the strike where the most option value would expire worthless. The whole chain's heaviest call strike is also $160 (31,338), so aggregate and expiration agree |
| Upper Bollinger Band (estimate) | $157.73 | Where the mid-September rally failed |
| Technical resistance / invalidation | $156.00 | The 3-day chart model's stated resistance; a close above it ends the bearish tilt |
| Gamma cluster | $155.00 | Fourth-largest gamma-weighted open interest strike in the chain |
| Swing resistance | $154.08 | Nearest heuristic price-structure level above the close |
| Friday's close | $153.82 | Reference for everything above and below |
| Lower Bollinger Band (estimate) | $153.34 | Price is hugging it; a decisive break is the chart model's bearish trigger |
| Largest gamma strike in the chain | $150.00 | Biggest gamma-weighted open interest anywhere on the board |
| Put wall (Sept 25) | $150.00 | Heaviest put open interest for the expiration (4,554) — the level that supports downside |
| Biggest new positioning | $147.00 | Friday's largest single open-interest build: +2,367 puts at the Sept 25 expiration |
| Second gamma cluster | $145.00 | Heavy October open interest on both sides; the Oct 16 $145 puts were the day's biggest premium trade |
| Bottom of Sept 25 implied range | $144.21 | Lower edge of the priced move |
| 20-day moving average | $143.65 | Price sits 7.1% above it |
| First swing support | $141.88 | Nearest heuristic price-structure support below |
| 50-day moving average | $132.53 | Price is 16.1% above — the multi-month uptrend is not remotely in question |
One caveat on the aggregate view: summed across all expirations, the heaviest put strike in the chain is $100 (39,671 contracts, concentrated in October). That is a deep out-of-the-money structural cluster, not a live support level for the next six days — for this week, the $150 put wall from the September 25 expiration's own book is the number that matters.
Positioning and unusual flow
One rough estimate of dealer positioning puts the September 25 expiration in a negative gamma regime — in that state, market-maker hedging tends to amplify moves rather than cushion them. The chain-wide aggregate estimate is negative too, so the two agree; a usable flip level could not be estimated from Friday's data, so treat "amplify" as a directionless warning about sharper moves, not a directional call. Note that the October 16 expiration's estimate flips positive, meaning the amplification read is a near-dated phenomenon.
Three pieces of flow stood out, all non-expired:
- Sept 25 $156 calls — 4,282 contracts traded against just 310 held open, $1.23 million of premium. That's roughly 14 contracts traded for every one previously open: fresh, aggressive upside positioning right at the top of the current chop zone.
- Sept 25 $161 calls — 4,087 traded against 202 open, 20× turnover and top-percentile volume versus comparable contracts, $572,000 of premium. Someone is paying for a move through the call wall.
- Oct 16 $145 puts — 4,976 contracts and $1.97 million of premium, the largest single dollar figure on the board, with open interest up 521 to 4,790. That's the hedging side of the ledger, and it's a month out, not this week.
The picture is two-sided: short-dated call buyers chasing a bounce, longer-dated put holders paying for insurance. That is exactly why the composite read lands near neutral rather than firmly negative.
3 · Technical check
Both chart models point the same way. The 3-day model (target date September 22) is bearish, with a target of $152.60 and a projected range of $150.50 to $155.50. The 6-day model (target date September 25 — the same date this article is built around) is also bearish, targeting $150.75 within a projected $148.50 to $157.50 band. Both cite the same evidence: a fresh short-term moving-average crossover to the downside, a MACD line below its signal with a widening negative histogram, and the directional-movement indicators showing sellers in tactical control even though the overall trend-strength reading (ADX 18.4) says this market isn't really trending at all. Both reports are equally clear that price remains far above its 50- and 200-day averages, so they class this as a corrective pullback, not a reversal.
That's a confirm on direction and a notable narrowing on magnitude. The 6-day model's entire projected range fits inside the options-implied range with room to spare — the chart tool expects roughly a third less movement than option prices are paying for.
Model vs. Market: The options market implies $144.21–$163.43 into September 25; the 6-day technical model targets $150.75 inside a $148.50–$157.50 band. The gap says option buyers are paying for tail risk the chart model doesn't expect to materialize — which is an argument for spreads with sold wings rather than outright long options.
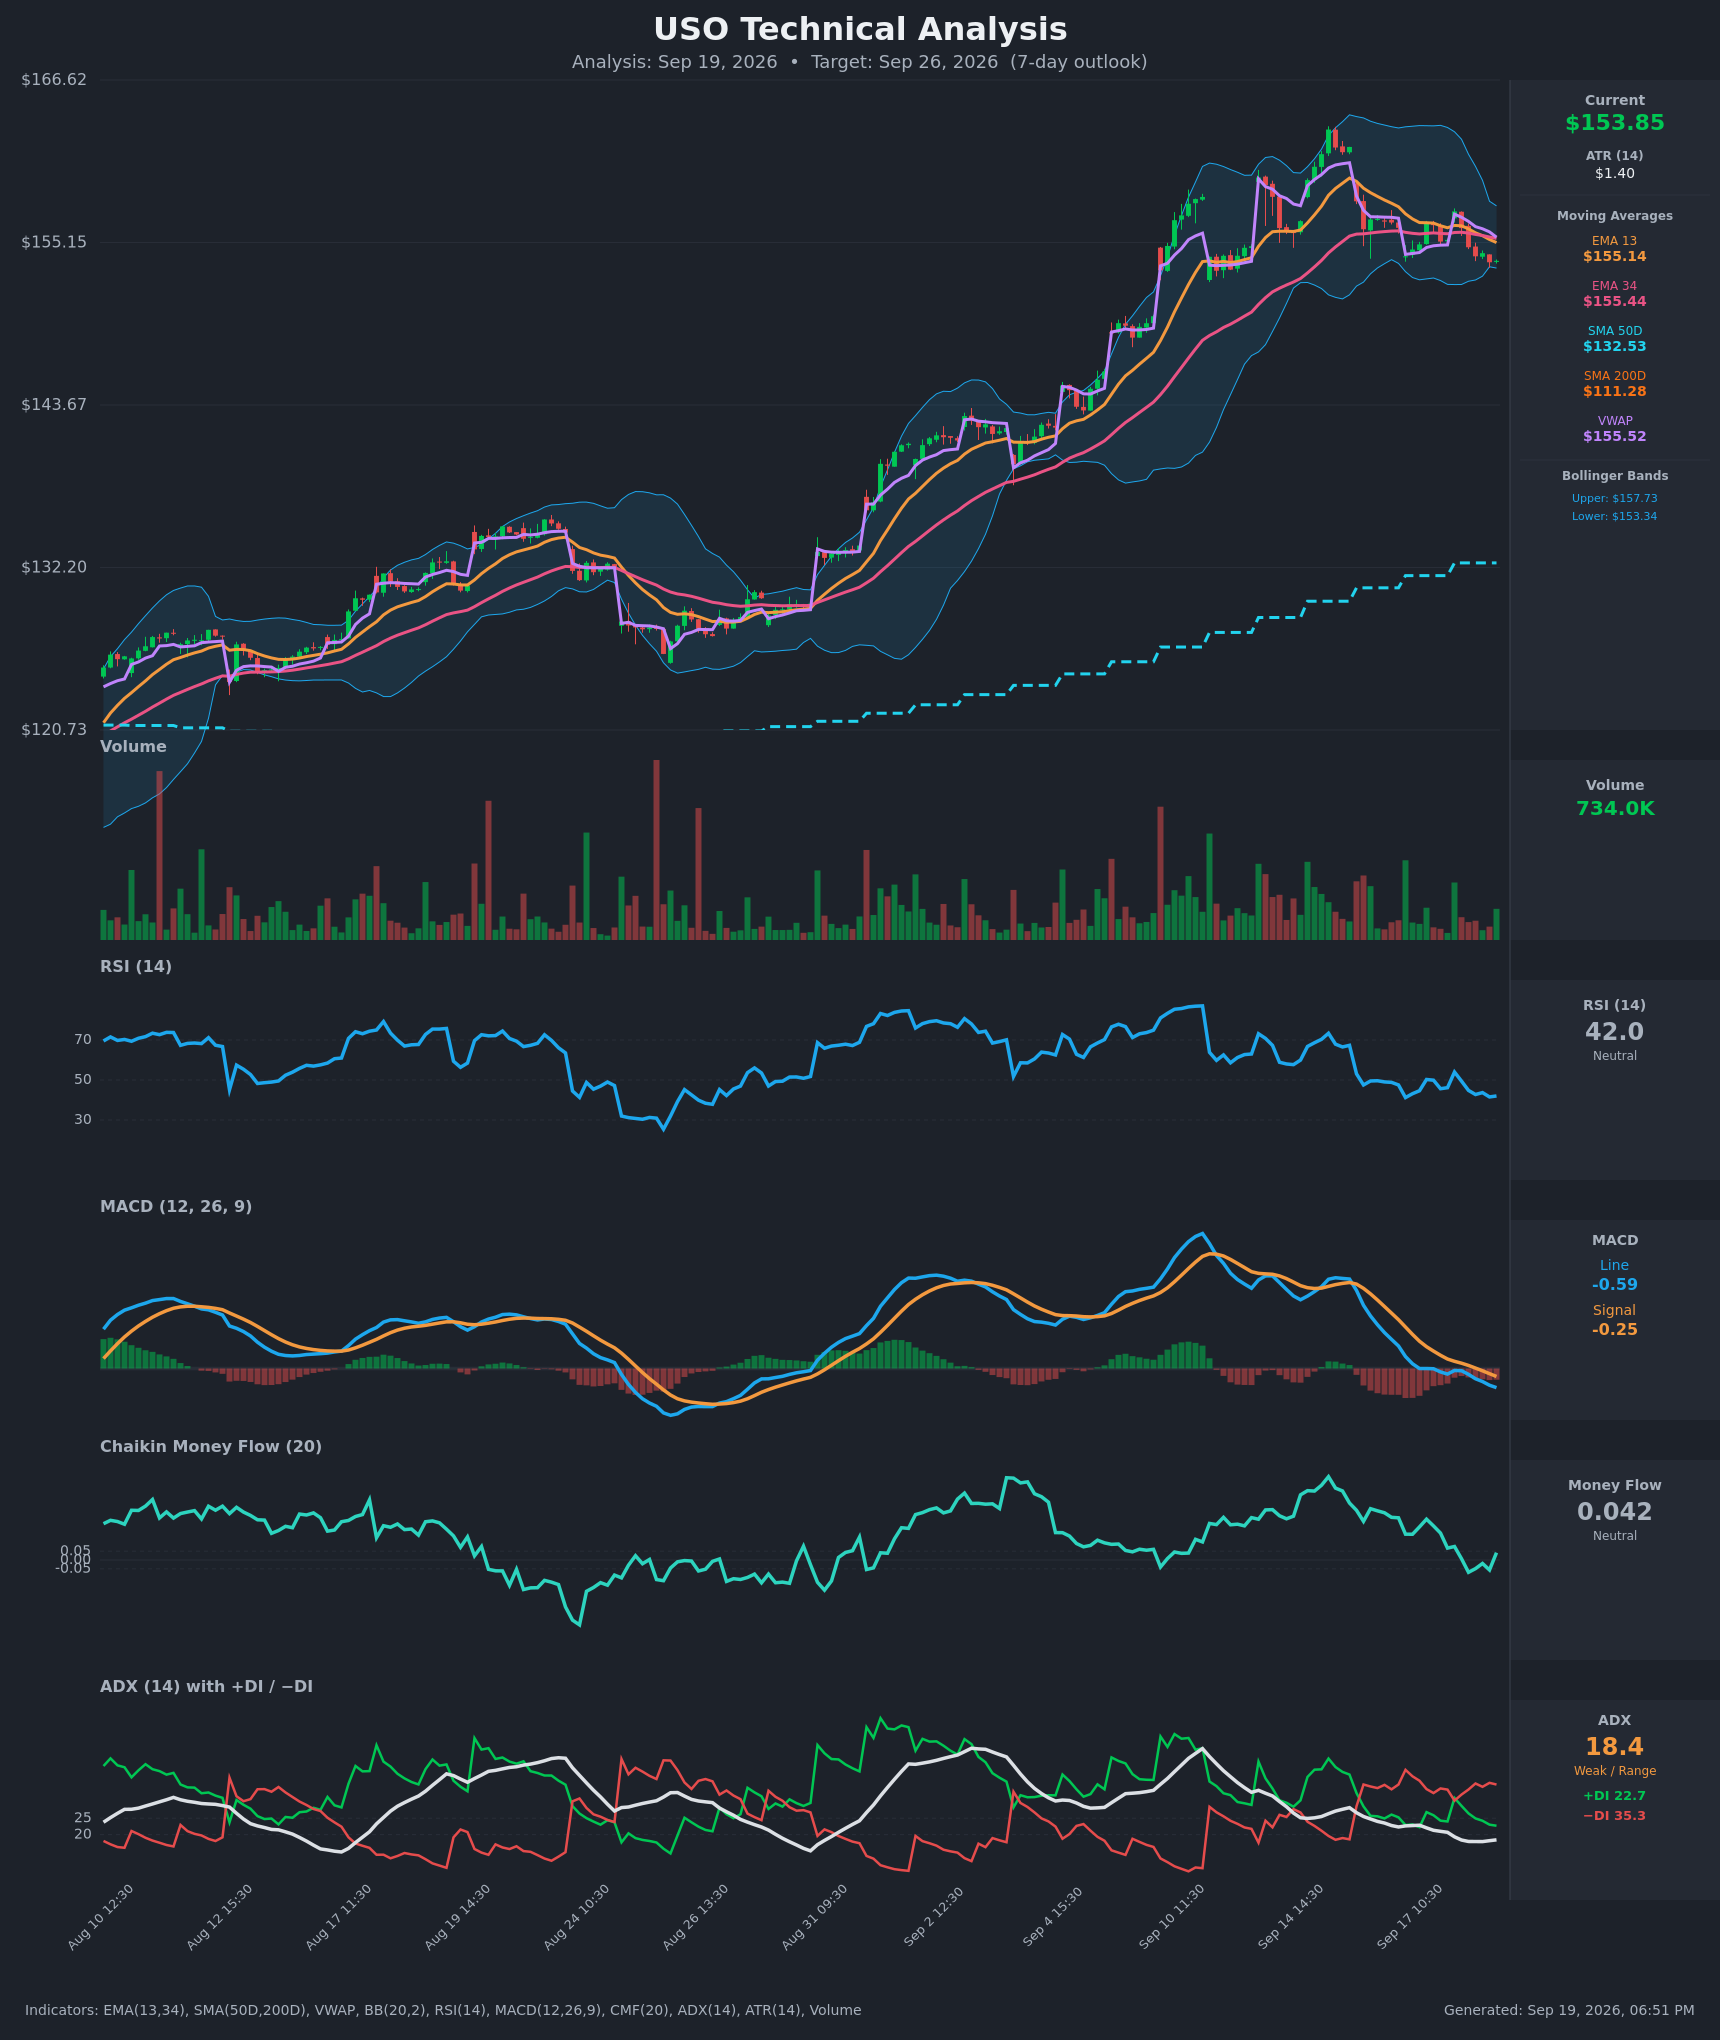
Practically, the technical read shaded the bearish structure's short strike toward $148 — just under the 6-day model's $150.00–$148.50 target zone — rather than parking it at the $150 put wall, where a pin would cap the payoff.
Full technical write-ups: 3-day report → · 6-day report →
4 · Three ways the next six days can go
If USO pushes above the call wall ($160): that strike carries the heaviest call open interest for the September 25 expiration and the heaviest in the chain overall, and dense call open interest overhead has a habit of slowing rallies as it is hedged. A clean break through it leaves thinner positioning until the $163.35 52-week high and the $163.43 top of the implied range, which sit essentially on top of each other. Short-dated call turnover at $156 and $161 says some traders are already positioned for exactly this.
If USO drifts between the walls ($150–$160): this is the awkward branch, and worth stating plainly. Max pain for September 25 sits at $160.00 — the same strike as the call wall, and $6 above Friday's close. Expirations sometimes gravitate toward max pain, so the pinning mechanic here argues for drift higher, not lower, which cuts directly against the flow tilt. With the dealer-gamma estimate negative for this expiration, hedging is more likely to exaggerate whatever move starts than to hold price in a band, so the pin case is the weakest of the three.
If USO breaks below the put wall ($150): $150 is simultaneously the expiration's biggest put strike and the largest gamma-weighted strike in the whole chain, so it is the level where hedging flows are densest. Below it, the next clustered positioning is $147 — where Friday's largest open-interest build landed — then $145 and the $144.21 floor of the implied range. In an estimated negative-gamma regime, a break through that kind of cluster tends to accelerate rather than cushion.
5 · Three defined-risk structures
Prices are end-of-day midpoints as of September 18, 2026. All structures are hypothetical. Verify live prices before trading — these will be stale by the open.
If you lean bearish: September 25 $153/$148 bear put spread
- Trade: Buy the Sept 25 $153 put, sell the Sept 25 $148 put
- Debit: $1.68 ($3.375 − $1.70) · Max profit: $3.32 per spread ($332) · Max loss: $168 · Break-even: $151.33
- Why it fits: It expresses the same bearish tilt the flow read and both chart models share, and it buys premium at an IV rank of 20/100 rather than selling it — the one thing the volatility picture genuinely favors. The $148 short strike sits inside the 6-day model's $150.75 target zone, so the spread reaches most of its value in the scenario the chart actually projects.
- Makes sense only if: you think the $150 put wall gives way rather than holds. If you expect $150 to act as a floor, this is the wrong structure.
- Invalidated if: USO closes above $156.00.
- Managing it: Take profit if USO trades into the $149–$150 zone; the spread will have captured most of its value there and gamma risk rises into expiration. Exit by September 24 regardless — the short-term flow deterioration is running against a still-bullish medium- and long-term trend, which argues for taking the money rather than holding to the last session.
- Liquidity note: the $153 puts quoted 15¢ wide (about 4% of mid) and the $148 puts 12¢ wide; both fill reasonably with a limit at the mid.
- Analyze this position →
If you expect the range to hold: September 25 $144/$147/$161/$164 iron condor
- Trade: Sell the $147 put / buy the $144 put, and sell the $161 call / buy the $164 call, all September 25. (An iron condor collects premium and pays off if the underlying finishes between the two short strikes.)
- Credit: $1.02 · Max profit: $102 · Max loss: $198 · Break-evens: $145.98 and $162.02
- Why it fits: The short strikes bracket both walls — $147 is where Friday's biggest put build landed, $161 is a dollar above the call wall — and both sit inside the $144.21–$163.43 implied range. That is the trade in one sentence: you are betting USO delivers less movement than option prices are paying for, which is exactly what the 6-day chart model projects.
- Makes sense only if: you're comfortable that the volatility premium is only middling (54th percentile versus this stock's own recent readings) — you are not being paid unusually well to sell this range, just adequately.
- Invalidated if: USO closes outside $147–$161 at any point before expiration; at that stage the position is managed, not held.
- Managing it: Close at roughly 50% of the max credit; exit the whole structure by September 24 rather than carrying pin risk into the final session, which matters more than usual given the negative dealer-gamma estimate for this expiration.
- Liquidity note: the short strikes are fine — the $147 puts traded 7¢ wide and the $161 calls 10¢ — but both long wings quote wide: the $144 puts 25¢ (27% of mid) and the $164 calls 16¢ (16% of mid). Work the order as a package with a limit, and expect the fill to come in below the quoted midpoint credit.
- Analyze this position →
If you lean bullish: September 25 $150/$145 put credit spread
- Trade: Sell the Sept 25 $150 put, buy the Sept 25 $145 put. (You collect a credit up front and keep it if USO stays above $150.)
- Credit: $1.12 · Max profit: $112 · Max loss: $388 · Break-even: $148.88
- Why it fits: The short strike sits precisely at the September 25 put wall — 4,554 open put contracts, and the single largest gamma-weighted strike in the entire chain. If you think the flow tilt is hedging inside an uptrend (medium-term trend +14.3%, long-term +41.1%) rather than genuine conviction, this is the structure that gets paid for that view. Max pain at $160 also sits above spot, which is the one positioning fact pointing higher.
- Makes sense only if: $150 holds. The risk/reward is unforgiving — you risk $3.88 to make $1.12 — so this only works if your conviction on that level is real.
- Invalidated if: USO closes below $150.00.
- Managing it: Close at roughly 50% of max credit; if USO closes through $150, close the spread rather than hoping for a recovery — a 3.5:1 loss ratio punishes hope quickly.
- Liquidity note: the $150 puts traded 6¢ wide (2.6% of mid) — among the tightest contracts in the expiration — and the $145 puts 10¢ wide. Easy fills.
- Analyze this position →
If none of these: no trade
There is a real case for standing aside here. Implied volatility sits at the 20th percentile of its past year, which is a thin place to sell premium, while the premium over delivered movement is only middling — so neither the buy-premium nor the sell-premium case is strong. On direction, the flow tilt is mild (the composite lands just over the neutral boundary), the max-pain magnet points the opposite way from the tilt, and the medium- and long-term trends are both still up. That is three signals arguing with each other inside a six-day window. If none of the three structures above matches a view you actually hold, waiting for either a decisive break of $150 or a reclaim of $156 — both of which would resolve the argument — costs nothing but patience.
6 · Quick FAQ
What is USO's expected move this week? About ±$9.61 (±6.25%) into the September 25 expiration, per the options market's straddle pricing as of the September 18 close — a $144.21 to $163.43 range.
Is USO expected to go up or down over the next six days? Options positioning as of September 18 leans mildly bearish — put open interest has outpaced calls and short-dated sentiment reads broadly negative — but that's a read of what traders have done, not a forecast. The actionable map is the $144.21–$163.43 range and the $150 / $160 levels that bracket it.
Are USO options expensive right now? Two lenses, same answer. IV rank of 20/100 says option prices are lower than 80% of the past year's readings; on top of that, they're running about 4.3 vol points above the movement USO has actually delivered, which is richer than roughly 54% of this stock's own recent readings. Net: fairly priced, with a slight edge to owning premium rather than selling it because the absolute level is low.
Where is USO's biggest options support and resistance? For the September 25 expiration: the put wall is $150.00 and the call wall is $160.00. Max pain for that expiration also sits at $160.00.
What invalidates this read? A close above $156.00.
Methodology & disclosures. Data: end-of-day options-chain snapshot for USO, 2026-09-18, generated 2026-09-19T18:50:54.612Z. Prices shown are midpoints and will differ from live markets. Momentum/positioning scores and volatility-premium comparisons are descriptive measurements of past option flow and past price movement — not investment advice, signals, forecasts, or guarantees. All trade structures are hypothetical. Every structure shown has a defined maximum loss; you can lose the entire max-loss amount. Options involve substantial risk and are not suitable for all investors.