WMT Options Are Pricing a $3.10 Move Into Friday — With Premium Near Its Cheapest in Months
Walmart's options market implies a $104.05–$110.25 range into the September 18 expiration, and near-dated flow has turned decisively call-heavy even as the 20-day price trend stays negative. Here's the positioning map and three defined-risk ways to trade it.

The options market implies a $104.05–$110.25 range into the September 18 expiration; here's what's driving it and three defined-risk ways to trade it.
Published Sunday, September 13, 2026 · Data as of Friday, September 11, 2026 close
Explore the live WMT options data in the Detailed Options Analyzer →
Quick answer
| Item | Answer |
|---|---|
| Market bias | Bullish |
| Options-implied range (into Sept 18) | $104.05 – $110.25 (±2.89%, about ±$3.10) |
| Major support | $105.00 — the Sept 18 put wall |
| Major resistance | $120.00 — the Sept 18 call wall; the nearer ceiling is $110.00, the heaviest call strike across the whole chain |
| Max pain (Sept 18) | $108.00 |
| Dealer gamma regime (estimate) | Positive — hedging tends to dampen moves; flip level ≈ $110.00 (whole-chain estimate) |
| Volatility condition | Falling — IV rank 18/100 · premium thin: options are priced about 17 vol points below the movement WMT has actually delivered |
| Technical check | Confirms (bullish, 3-day and 5-day chart models) |
| Best-fitting strategy | Sept 18 $107/$110 call debit spread |
| Analysis invalidated if | WMT closes below $105.00 |
1 · What matters today
Walmart closed Friday, September 11 at $107.15, and the options market is pricing a move of roughly $3.10 in either direction over the next five days — a $104.05 to $110.25 range into the September 18 expiration. That figure comes from what straddles cost: it is the market's own estimate of how far the stock travels, not a target.
The read is bullish, and the reason is flow rather than price. Call open interest grew by 33,002 contracts on Friday against just 1,104 new put contracts, put volume fell to 26 puts per 100 calls, and short-dated sentiment is the most call-tilted it has been in weeks. Two independent chart models agree, both projecting a close near $108.50 by Friday. The level that changes everything is $105.00 — the strike with the heaviest put open interest at this expiration, and the floor this whole thesis rests on. A close below it and the read is dead.
2 · What the options market is pricing
What changed this week
The flow rotated decisively toward calls. Put/call volume finished Friday at 0.26 — 26 puts traded for every 100 calls — against a 7-day average of 0.34 and a 14-day average of 0.33, making it the most call-skewed session of the past two weeks. Open interest tells the same story more slowly: the put/call open-interest ratio (contracts currently held open) slid to 0.52 from a 14-day average of 0.65, meaning traders have been letting downside hedges expire rather than replacing them. Friday's single-session build was lopsided — 33,002 new call contracts versus 1,104 new put contracts.
Volatility kept bleeding out. At-the-money implied volatility — the market's estimate of how much WMT will move, baked into option prices — sits at 22.3%, up 3.3% over five sessions but down 30.0% over thirty, and well under both its 30-day average of 26.7% and its 90-day average of 27.2%. Into Friday's expiration, the biggest open-interest change of the day was the $109 calls adding 18,958 contracts, but those contracts have since settled — that is history, not a live magnet. Among contracts that still trade, the largest builds were 3,004 new $115 puts at the October 30 expiration, 1,440 new $125 calls at September 18, and 858 new $108 calls at September 18.
One tension worth naming: the short- and long-term trend reads are flat while the medium-term read is clearly negative — the stock is down 7.4% over the past twenty trading days and down 1.2% over the past five, even as near-term option flow has turned bullish. This is a bounce inside a heavier tape, and it argues for shorter-dated directional structures and earlier profit-taking rather than patient positions.
Expected move
Into September 18, the options market is pricing about ±$3.10 on a $107.15 stock — a 2.89% move derived from straddle pricing. Here is how that scales out across the covered expirations:
| Expiration | Implied move | Range around $107.15 |
|---|---|---|
| Sept 18 (7 DTE) | ±2.89% | $104.05 – $110.25 |
| Sept 25 (14 DTE) | ±4.22% | $102.63 – $111.67 |
| Oct 2 (21 DTE) | ±5.23% | $101.55 – $112.75 |
| Oct 9 (28 DTE) | ±6.17% | $100.54 – $113.76 |
The ladder steps up smoothly — no kink, no hump, no single date the chain is bracing for. ATM implied volatility rises gently from 20.9% at the front rung to 22.3% four weeks out, which is the shape of a calm chain rather than one pricing an event.
Volatility
IV rank is 18/100 — today's implied volatility is cheaper than about 82% of the past year's readings — and the IV percentile of 23 says roughly the same thing. That is barely changed from the 7-day average rank of 20 and the 14-day average of 20, so this is a settled condition, not a fresh collapse. Friday was an expiration day, so the front-month read is unavailable today; the 60-day tenor prints at 25.3%.
Underneath that, the stock's own recent behavior is unusual. Twenty-day realized volatility — how much WMT has actually been moving — is running at 39.3%, well above this stock's own recent norm, almost entirely because of one day: a 6.9% downside gap on August 20 that still sits inside the 20-day window. The 5-day-to-20-day realized ratio has collapsed to 0.40, an unusually depressed reading for this name, which is the data's way of saying the stock has gone quiet since.
Premium rich or cheap? The volatility risk premium — the gap between how much movement options are priced for and how much WMT has actually delivered — is negative by about 17 vol points. When that gap is positive, option sellers have been collecting more than realized movement cost them; here it is the reverse, and by a wide margin: today's reading is thinner than all but roughly 9% of this stock's own recent readings, and it has been negative in every session of the past three weeks. Read that carefully, though. The gap is mechanical — it exists because one gap day is inflating the realized leg. Ten-day realized volatility is 17.8%, comfortably below today's 22.3% implied. The honest verdict: this is not a week to sell premium for its own sake. With IV rank at 18/100 and the priced-versus-delivered gap in the bottom tenth of its own range, owning defined-risk long premium is the cleaner expression, and any credit structure has to earn its place on positioning rather than on richness.
Skew and sentiment
Skew is flat. Puts and calls the same distance from the stock price don't normally cost the same — when puts are pricier, traders are paying up for crash protection. Here the 25-delta put prints 22.36% against the 25-delta call at 22.22%, a gap of 0.14 vol points, sitting essentially on the stock's own 60-day median of 0.14 vol points. Nobody is paying up for downside insurance.
The flow readings are where the bullish tilt lives. Friday's put/call volume of 0.26 is an unusually call-tilted print versus this stock's own recent history, and the net new open interest reading — calls building, puts flat — is likewise well above its norm. Sentiment in short-dated options is the most one-sided piece of the file: the 0–7 day bucket scores 91 on a −100-to-+100 scale, driven by 23,774 contracts of call open interest added against 1,089 puts removed, while the 7–30 day bucket sits at a milder +21. Every expiration bucket leans the same way; the overall regime reads as broadly bullish, and the 7-day average of the front bucket (39) confirms this isn't a one-day artifact — it's an acceleration of a lean that's already been there.
The key levels map
| Level | Price | Why it matters |
|---|---|---|
| Call wall (Sept 18) | $120.00 | Heaviest call open interest at this expiration (24,081 contracts) — far out of reach this week, which is why the chain's practical ceiling sits lower |
| 200-day moving average | $118.72 | Price structure; close sits 9.8% below it |
| Swing resistance | $115.29 | Heuristic swing-pivot level; also a 6,074-contract put strike at Sept 18 |
| Swing resistance | $112.73 | Heuristic swing-pivot cluster |
| 50-day moving average | $110.33 | The overhead trend line both chart models flag as the first real barrier |
| Whole-chain heaviest call strike / gamma flip (estimate) | $110.00 | 81,411 call contracts across all expirations and the largest gamma strike in the file; one rough estimate also puts the dealer gamma pivot here |
| Swing resistance | $108.95 | Heuristic swing level, just above max pain |
| Max pain (Sept 18) | $108.00 | The price where the most option value expires worthless — expirations sometimes gravitate toward it |
| 20-day moving average | $107.29 | Price is essentially on it (−0.1%) |
| Spot / Friday close | $107.15 | Anchor for every figure above and below |
| Swing support | $107.02 | Nearest heuristic support cluster |
| Put wall (Sept 18) | $105.00 | Heaviest put open interest at this expiration (14,465 contracts) — the week's floor, and the invalidation line |
| Lower rail of the implied range | $104.05 | One standard deviation down, per straddle pricing |
| Swing support | $102.21 | Second heuristic support cluster |
| Whole-chain heaviest put strike | $100.00 | 46,428 put contracts across all expirations — the structural floor beyond this week |
| 52-week low | $98.88 | Price sits 8.4% above it; 22.8% up the 52-week range |
Note the disagreement worth flagging: the September 18 expiration's own call wall is $120.00, a lottery-ticket strike nobody expects to reach, while the whole chain's heaviest call strike is $110.00. For this week, treat $110 as the functional ceiling and $120 as a statistic.
Positioning and unusual flow
Market makers hedge the options they've sold, and in a positive-gamma regime that hedging tends to dampen moves rather than amplify them. One rough estimate built from the September 18 chain puts that expiration in a positive regime, matching the whole-chain estimate, with the pivot around $110.00. Spot sits about 2.7% below that pivot — and for this name, that distance is unusually stretched toward the fragile side of the estimate. Treat all of that as an estimate built on an assumed dealer convention, not observed inventory.
Three live flow items stood out on Friday. The September 18 $104 puts traded 2,169 contracts against 1,542 open — more than one turn of the existing position, at a 15-delta strike, which is the profile of fresh downside protection being bought cheaply rather than conviction bearishness. The September 18 $107 calls traded 2,988 against 2,286 open, with $404,874 of premium changing hands at the money. And across the chain, the biggest dollar-premium print of the day in a live contract was the October 16 $110 calls at $655,512 — traders reaching for the same $110 level the gamma map already flags.
3 · Technical check (the 20%)
Both chart models read bullish, and both land inside the options-implied range — a clean confirmation. The 3-day model (target date September 16) projects $108.30 with a range of $105.50 to $110.00. The 5-day model (target date September 18, matching this article's window) projects $108.60 with a range of $105.30 to $109.90. Set beside the options-implied $104.05–$110.25, the chart models are describing a tighter, higher-centered version of the same box.
The decisive indicator reads are a fresh MACD crossover above its signal line and a short-term EMA crossover that occurred on September 11 itself, with money-flow readings in steady accumulation and trend strength building but not yet mature. The counterweight, which both write-ups concede, is that price remains well below the 50-day ($110.33) and 200-day ($118.72) averages — this is a bounce inside a larger downtrend, which lines up exactly with the medium-term trend tension noted above. The dominant scenario in the 5-day report invalidates on a close back below $106.30.
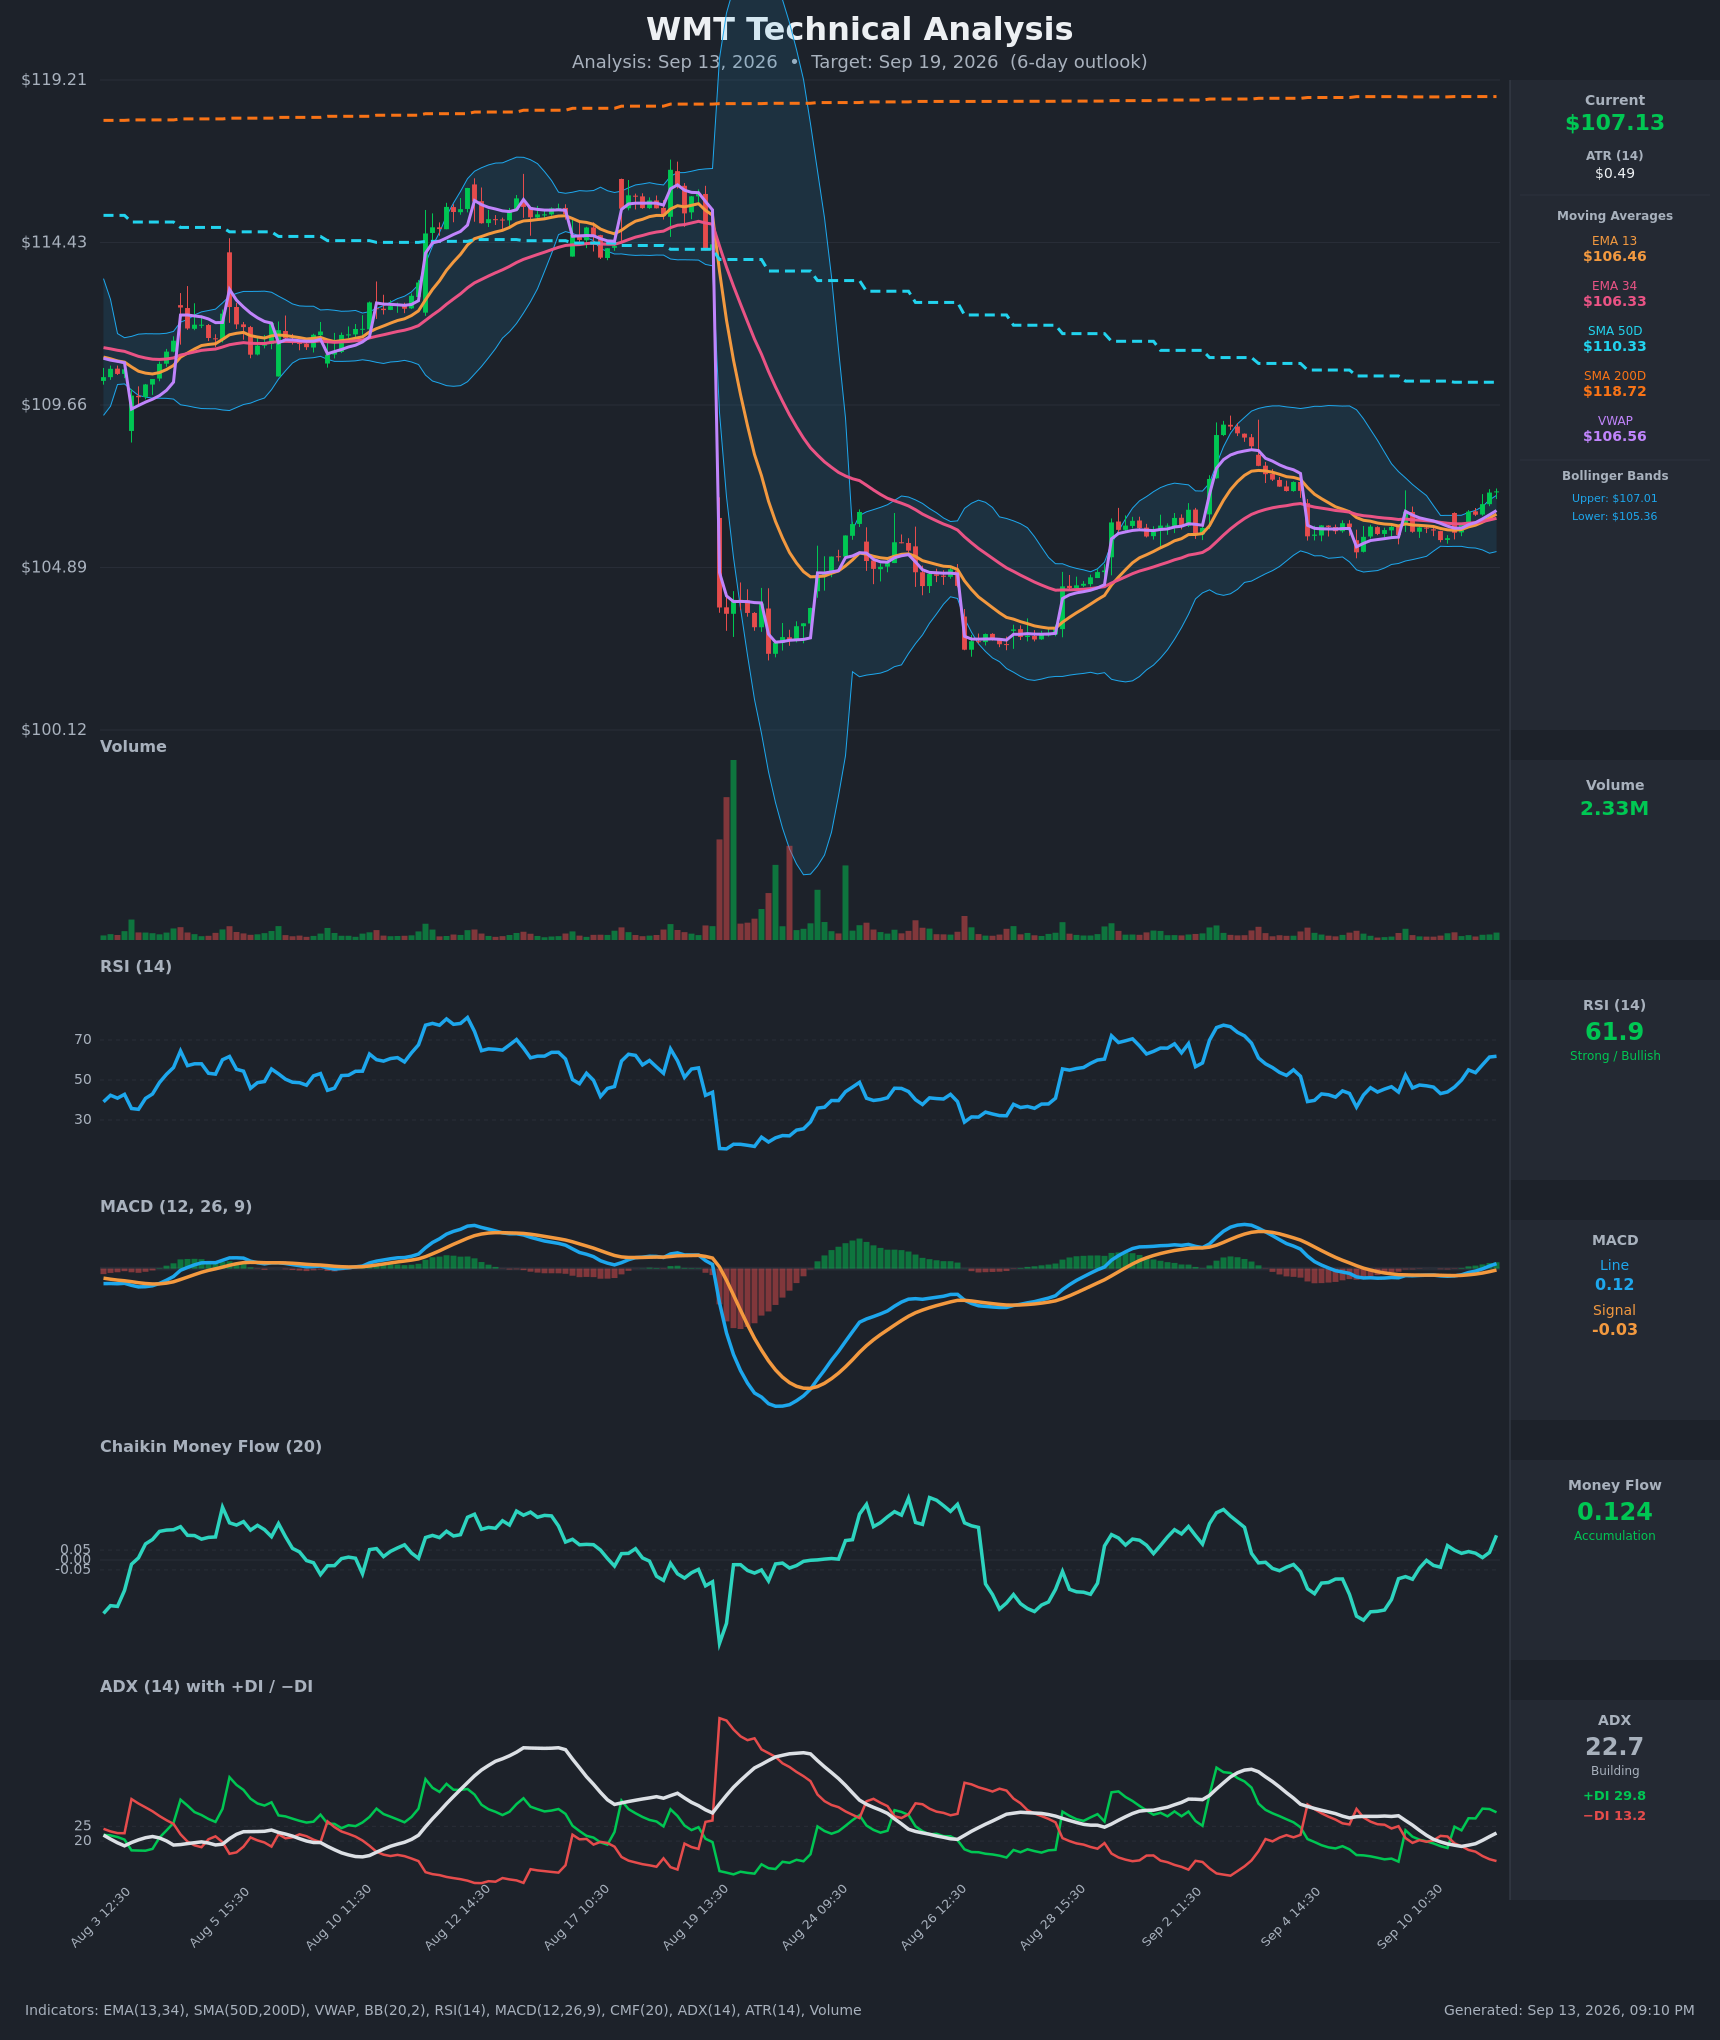
Model vs. Market: The options market implies $104.05–$110.25 into Friday; the 5-day technical model targets $108.60 with a $105.30–$109.90 range. The chart model is not fighting the options market — it is picking the upper half of the same box, which is why the structures below shade long rather than neutral.
The one place the technicals moved a strike: the chart models' $109.60–$110.33 resistance shelf sits right on the chain's heaviest call cluster, so the short strike of both the bullish spread and the range structure below is pinned at $110 rather than stretched to the top of the implied range.
Full technical write-ups: 3-day report → · 5-day report →
4 · Three ways the next five days can go
If WMT pushes above $110.00: That is where the chain's heaviest call open interest sits and where one rough estimate places the dealer gamma pivot. Heavy call positioning overhead tends to slow rallies as hedging supply meets them, and the 50-day average at $110.33 sits immediately above. A clean break through both leaves thinner positioning until the $112.73 swing shelf.
If WMT drifts between $105.00 and $110.00: This is the path the positioning most naturally supports. Max pain for September 18 is $108.00, a dollar above Friday's close, and the estimated positive-gamma regime at this expiration implies hedging that leans against moves in both directions. In that world the stock grinds toward $108 into Friday and the biggest premium decay happens in the strikes traders are currently crowding.
If WMT breaks below $105.00: The put wall goes from floor to trapdoor, and the lower rail of the implied range at $104.05 becomes the next reference. Spot already sits below the whole-chain gamma flip estimate near $110 — by an unusually wide margin for this name — so the cushion the positive-gamma estimate implies is thinner here than the headline regime label suggests. Below $104, the next meaningful structure is the $102.21 swing cluster, then the $100.00 put concentration.
5 · Three defined-risk structures
Prices are end-of-day midpoints as of Friday, September 11, 2026. All structures are hypothetical. Verify live prices before trading — these will be stale by the open.
If you lean bullish: Sept 18 $107/$110 call debit spread
- Trade: Buy the September 18 $107 call, sell the September 18 $110 call
- Debit: $1.02 · Max profit: $198 per spread · Max loss: $102 per spread · Break-even: $108.02
- Why it fits: This is the structure the volatility data points to. With IV rank at 18/100 and the priced-versus-delivered gap in the bottom tenth of its own recent range, you are buying cheap optionality rather than selling thin premium — and a debit spread caps what that cheapness can cost you. The short strike sits exactly on the chain's heaviest call cluster and the 50-day average, which is where the chart models expect the advance to stall anyway.
- Makes sense only if: you believe Friday's call-buying acceleration carries through the week and the stock can clear $108 — the max-pain magnet — on the way.
- Invalidated if: WMT closes below $105.00.
- Managing it: Take profit at roughly 60–70% of maximum value rather than waiting for full expansion — the medium-term trend is still down 7.4% over twenty sessions, and bounces inside heavier tapes rarely get the last dollar. Exit regardless by Thursday's close; a debit spread this close to expiry becomes a coin flip on Friday morning.
- Liquidity note: The $107 calls quoted 7¢ wide (1.32/1.39) on $404,874 of traded premium; the $110 calls quoted 2¢ wide (0.33/0.35) against 19,198 contracts of open interest. Both fill easily on limit orders.
- Analyze this position →
If you expect the range to hold: Sept 18 $103/$105/$110/$112 iron condor
- Trade: Sell the $105 put / buy the $103 put, and sell the $110 call / buy the $112 call, all September 18
- Credit: $0.51 · Max profit: $51 per condor · Max loss: $149 per condor · Break-evens: $104.49 and $110.51
- Why it fits: The short strikes are the two walls, not arbitrary picks — $105 carries 14,465 put contracts and $110 is the chain's heaviest call strike, with max pain at $108 sitting almost dead center between them. The estimated positive-gamma regime at this expiration is the mechanical argument for the middle holding.
- Health warning: you are selling premium that hasn't been rich lately. At IV rank 18/100 and a priced-versus-delivered gap in the bottom tenth of its own range, the compensation for taking this risk is unusually thin — a 1-to-2.9 reward-to-risk ratio that leaves no room for a sloppy fill.
- Makes sense only if: you specifically want to bet on stillness and accept the poor payout ratio for the higher hit rate.
- Invalidated if: WMT closes outside $105.00–$110.00 — at that point the structure is already fighting the wall it was built against.
- Managing it: Close at about 50% of max credit, or roughly 25¢. Exit entirely by Thursday regardless of price. If either short strike trades through on a closing basis, close the tested side rather than hoping for a reversal.
- Liquidity note: The $105 puts quoted 4¢ wide (0.42/0.46) with 14,465 contracts open — tight in cents but 9% of mid, so use limits. The $112 calls are the loosest leg at 5¢ wide (0.09/0.14) on a 12¢ mid; it's a protective wing, so paying the ask there is acceptable.
- Analyze this position →
If you lean bearish: Sept 18 $107/$104 put debit spread
- Trade: Buy the September 18 $107 put, sell the September 18 $104 put
- Debit: $0.85 · Max profit: $215 per spread · Max loss: $85 per spread · Break-even: $106.15
- Why it fits: The bearish case isn't in the flow — it's in the trend. WMT is down 7.4% over twenty sessions, sits 2.9% below its 50-day average and 9.8% below its 200-day, and Friday's bounce happened on volume 39% below the 20-day norm. Cheap implied volatility makes the long-premium version of that view the affordable one, and the short strike sits just under the put wall so you're paid for the move the walls would have to break to deliver.
- Makes sense only if: you read Friday's call build as short-dated positioning rather than accumulation, and you expect the $105 wall to fail.
- Invalidated if: WMT closes above $108.95 — through max pain and the nearest swing resistance, which would confirm the bullish read instead.
- Managing it: This fights the week's positioning, so treat it as a short-leash trade: take profit at roughly half of max value, and exit by Wednesday's close if the stock is holding above $107. Size it smaller than the bullish structure.
- Liquidity note: The $107 puts quoted 6¢ wide (1.09/1.15), about 5% of mid; the $104 puts quoted 4¢ wide (0.25/0.29) on 2,169 contracts of volume — the day's heaviest turnover-to-open-interest print in the expiration. Both fill.
- Analyze this position →
If none of these: no trade
There is a legitimate case for standing aside. The bullish read rests almost entirely on one day of flow — a single session's 33,002-contract call build and a front-bucket sentiment score that spiked from 27 to 91 in one day. Meanwhile the stock is 7.4% lower over twenty sessions and below every moving average that matters. A five-day window that requires one day's positioning to hold is a thin edge, and with implied volatility at the 18th percentile of its year there's no volatility-crush tailwind to fall back on either. If you take the range structure instead, understand you're collecting 51¢ to risk $149 in the cheapest premium environment this stock has offered in months — the walls have to hold, because the payout gives you no cushion if they don't. Waiting for either a decisive break of $110.00 or a failure at $105.00 costs you nothing but a week.
6 · Quick FAQ
What is WMT's expected move this week? About ±$3.10, or ±2.89%, into the September 18 expiration — a $104.05 to $110.25 range, per the options market's straddle pricing as of the September 11 close.
Is WMT expected to go up or down over the next five days? Options positioning as of September 11 leans bullish — call open interest grew 33,002 contracts in a single session against 1,104 new puts, and short-dated sentiment is strongly call-tilted — but that is a read of what traders have done, not a forecast. The actionable map is the $104.05–$110.25 range with $105.00 as support and $110.00 as the nearer ceiling.
Are WMT options expensive right now? No. IV rank of 18/100 says option prices are lower than about 82% of the past year's readings, and on top of that they're running roughly 17 vol points below the movement WMT has actually delivered over the past twenty days — thinner than all but about 9% of this stock's own recent readings. Note that the realized side is inflated by a single 6.9% gap day on August 20 still sitting inside the window; 10-day realized volatility is 17.8%, below today's implied. Net: buying defined-risk premium beats selling it this week.
Where is WMT's biggest options support and resistance? For the September 18 expiration, the put wall is $105.00 (14,465 contracts) and the call wall is $120.00 (24,081 contracts). Because $120 is far out of reach this week, the practical ceiling is $110.00 — the heaviest call strike across the whole chain and the largest gamma strike in the file.
What invalidates this week's read? A close below $105.00.
Methodology & disclosures. Data: end-of-day options-chain snapshot for WMT, 2026-09-11, generated 2026-09-13T21:10:12.887Z. Prices shown are midpoints and will differ from live markets. Momentum/positioning scores and volatility-premium comparisons are descriptive measurements of past option flow and past price movement — not investment advice, signals, forecasts, or guarantees. All trade structures are hypothetical. Every structure shown has a defined maximum loss; you can lose the entire max-loss amount. Options involve substantial risk and are not suitable for all investors.