WMT Options Are Pricing a ±$3.35 Move Into September 25 — Our Chart Model Sees $105.55
Walmart's options market implies a $103.38–$110.08 range into the September 25 expiration, with a $110 call wall capping upside and max pain at $106. Here's what the positioning says, where the chart model disagrees, and three defined-risk ways to trade it.
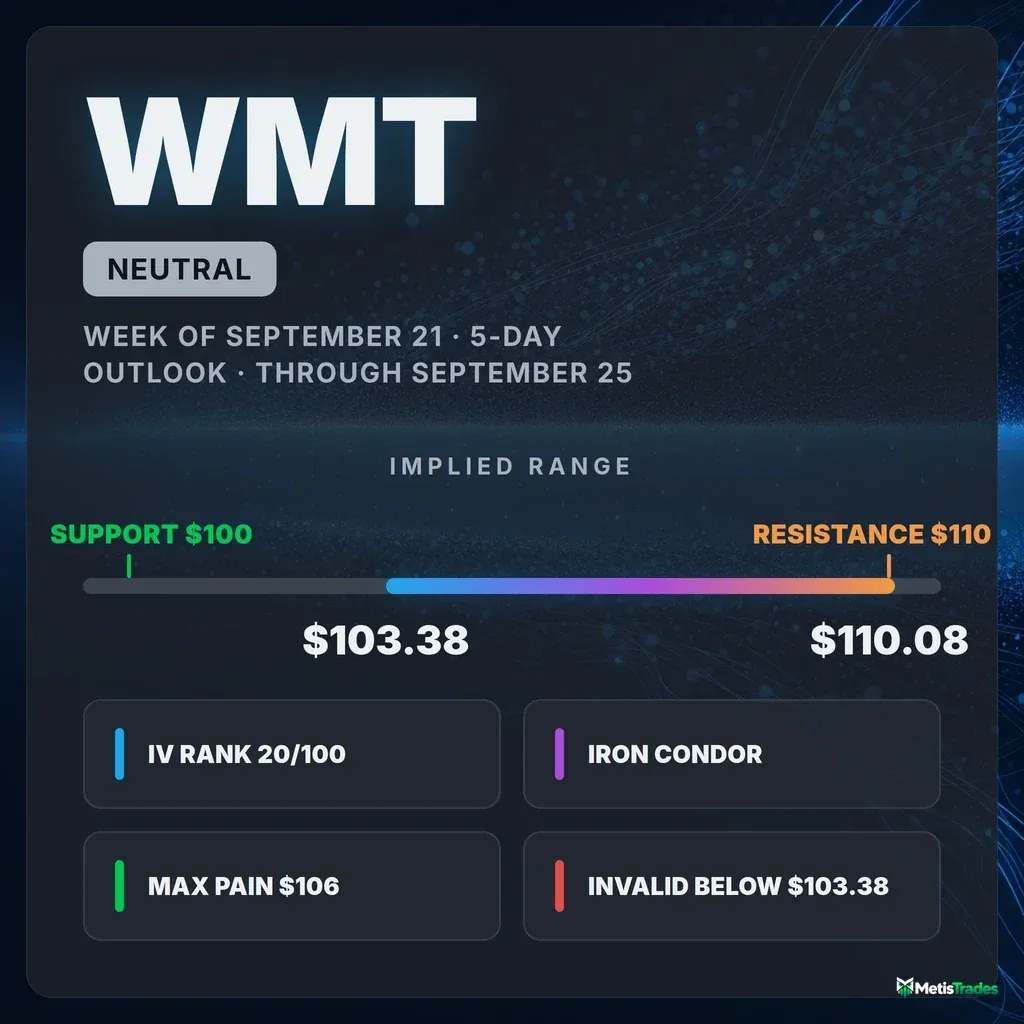
The options market implies a $103.38–$110.08 range into the September 25 expiration; here's what's driving it and three defined-risk ways to trade it.
Published Sunday, September 20, 2026 · Data as of Friday, September 18 close
Explore the live WMT options data in the Detailed Options Analyzer →
Quick answer
| Item | Answer |
|---|---|
| Market bias | Neutral |
| Options-implied range (into Sep 25) | $103.38 – $110.08 (±3.14%, or ±$3.35) |
| Major support | $100.00 (Sep 25 put wall); nearest structural shelf $105.16 |
| Major resistance | $110.00 (Sep 25 call wall) |
| Max pain (Sep 25) | $106.00 |
| Dealer gamma regime (estimate) | Positive — hedging tends to dampen moves; flip level ≈ $60.00 (estimate) |
| Volatility condition | Falling — IV rank 19.9/100 · premium modestly rich: options priced ~2.8 vol points above delivered movement |
| Technical check | Mixed (bearish, 3-day and 5-day chart models) |
| Best-fitting strategy | Iron condor (Sep 25 $102/$104 puts, $110/$112 calls) |
| Analysis invalidated if | WMT closes below $103.38 |
1 · What matters today
Walmart closed Friday, September 18 at $106.73, and the options market is pricing a fairly tame five-day move: about $3.35 up or down, or a $103.38–$110.08 band into the September 25 expiration. That figure comes from what at-the-money straddles cost — the move the options market is pricing in. Our read of the flow lands squarely neutral: the leading positioning signals, the momentum blend, and sentiment across expirations essentially cancel each other out, and the one clear structural feature is a heavy $110 call wall — the strike with the biggest pile of open call contracts, which tends to act like a ceiling — sitting right at the top of that implied range. Max pain for the week is $106, a dollar under spot. Two chart models lean bearish toward $105.55, inside the range but below max pain. A close below $103.38 breaks the whole picture.
2 · What the options market is pricing
What changed this week
The underlying barely moved: WMT is down 0.39% over the past five sessions and still up 2.78% over the past 20. Positioning did move. The put/call open-interest ratio — how many puts are held open for every call — went from 0.52 to 0.68 over five days, a 29% jump, against a 14-day average of 0.61 and a 7-day average of 0.59. Day over day, traders added 15,121 puts of open interest versus 9,539 calls. Put volume share told the same story: Friday's put/call volume ratio of 0.65 sits above the 7-day average of 0.51 and well above the 14-day 0.43 — more downside hedging than this name has been running lately, even though total option volume was quiet at 0.59× its 20-day average.
The single largest forward-looking open-interest build was in the October 16 $110 calls: up 1,366 contracts to 12,086, on 4,549 lots traded and $661,880 of premium — the heaviest dollar flow anywhere in the chain. Into Friday's expiration, by contrast, the settled $104 puts added 10,355 contracts of open interest on 9,655 lots; that's history now, not a live level. Implied volatility drifted: flat on the day (−0.1%), up 1.4% over five sessions, down 28.7% over 30. Our momentum read crossed from bullish to bearish on September 17, but it's a shallow cross — the composite sits at −9 against a 7-day average of +6. The multi-horizon trend read is flat across every window it can measure: −0.4% over the past week, +2.8% over the past month, −4.9% over the past two months, with no horizon showing a real directional score. Nothing here is trending.
Expected move
Into September 25, the chain prices a 1σ move of ±3.14%, or about ±$3.35 around the $106.73 spot — a $103.38 to $110.08 band.
| Expiration | Implied move | Range around $106.73 |
|---|---|---|
| Sep 25 (7 DTE) | ±3.14% | $103.38 – $110.08 |
| Oct 2 (14 DTE) | ±4.36% | $102.08 – $111.38 |
| Oct 16 (28 DTE) | ±6.25% | $100.06 – $113.40 |
The ladder scales almost exactly with the square root of time — no bump, no kink, no expiration pricing in an extra event. That flatness is itself information: the chain is not bracing for anything specific inside the next month.
Volatility
At-the-money implied volatility — the market's estimate of how much WMT will move, baked into option prices — is 22.6%. IV rank is 19.9/100, meaning today's reading is cheaper than roughly 80% of the past year's; the percentile measure says only 23% of the past year's sessions closed below it. Current IV sits under both the 30-day average (25.1%) and the 90-day average (26.7%). The front-month read is unavailable today because September 18 was itself an expiration day, so there's no term-structure comparison across dates to quote.
On the realized side, WMT has delivered 15.7% annualized volatility over 10 days and 19.8% over 20, versus 33.6% over 30 — the longer window still carries the August 20 gap-down. Twenty-day realized volatility is running unusually low compared against this stock's own recent history; "unusual" here means unusual for WMT, not versus the broader market. Share volume on Friday was a different matter — 45.3 million shares, 1.78× the 20-day average, which is what an expiration session looks like.
Premium rich or cheap. The volatility risk premium — the gap between how much movement options are priced for and how much WMT has actually delivered — is about +2.8 vol points, and it sits at the 64th percentile of this stock's own recent readings, meaning richer than roughly two-thirds of them. One clause of caution on the path: a week ago that same gap was about −17 vol points, and the flip is mechanical, not a signal. The August 20 gap-down finally rolled out of the trailing 20-day realized-volatility window, collapsing the realized leg from the 30s to 19.8% overnight; option prices barely moved. So the honest verdict is a mild one: IV rank 19.9 with a 64th-percentile premium over delivered movement leans toward collecting premium rather than owning it, but the richness came from the denominator shrinking, not from options getting expensive. Size accordingly.
Skew and sentiment
Skew — the fact that puts and calls the same distance from the stock price don't cost the same — is running backwards for a defensive name. The 25-delta put trades at 22.4% implied volatility against 23.1% for the 25-delta call, so the put-minus-call gap is −0.72 vol points versus a 60-day median of +0.14. Puts are about 0.9 vol points cheaper relative to calls than this stock's own norm: nobody is paying up for crash protection here, which reads as complacency rather than fear.
Against that, the pace at which put open interest is building relative to calls is the single most stretched reading in the whole positioning snapshot — far outside this stock's recent norm. That combination (lots of new puts, no urgency in their pricing) usually describes methodical hedging into a quiet tape, not conviction selling.
Sentiment across expirations splits by term. The 0–7d bucket reads −21 — front-end flow leaning put-side, driven by that open-interest build. The 7–30d bucket is essentially flat at +3. The 30–60d bucket is the outlier at +62, an isolated pocket of call-side positioning further out. Our leading positioning composite — the early-read measure built only from flow, skew, and term structure — is flat at −4 with no divergence firing. Front-end caution, back-end optimism, nothing decisive in between.
The key levels map
| Level | Price | Why it matters |
|---|---|---|
| Oct 16 call wall | $115.00 | 20,426 calls open — beyond this window, but the next real ceiling above $110 |
| Top of 5-day implied range | $110.08 | 1σ upside boundary into Sep 25 |
| Call wall (Sep 25) | $110.00 | 31,322 calls open at this strike; the whole chain's heaviest call strike (87,778) and largest gamma pile sit here too — the two agree |
| 50-day moving average | $109.91 | Price is 2.89% below it; a declining average overhead |
| Swing resistance | $109.22 | Heuristic pivot cluster from recent price structure |
| Chart-model resistance | $107.40 | Both technical reports flag this as the rejection zone |
| Swing resistance | $107.02 | Nearest overhead pivot |
| Spot / Friday close | $106.73 | Reference for every figure above and below |
| 20-day moving average | $106.05 | Price is 0.64% above it — the one average WMT is holding |
| Max pain (Sep 25) | $106.00 | Where the most option value would expire worthless; expirations sometimes gravitate toward it |
| Swing support | $105.16 | First structural shelf below spot |
| Bottom of 5-day implied range | $103.38 | 1σ downside boundary — and this article's invalidation line |
| Swing support | $102.21 | Second shelf |
| Put wall (Sep 25) | $100.00 | Biggest pile of open puts for the week (3,144) and for the whole chain (60,037) — but thin for this expiration specifically |
| 52-week low | $98.88 | Price sits 7.94% above it, 21.03% below the 52-week high of $135.16 |
| Gamma flip (estimate) | $60.00 | One rough estimate of where dealer hedging would flip from dampening to amplifying — a long way below spot |
The asymmetry worth noting: the week's call wall is enormous (31,322 contracts) while the week's put wall holds only 3,144. The ceiling at $110 is real and specific; the floor at $100 is mostly a whole-chain artifact, not a September 25 feature. Downside, in other words, has less options-based scaffolding under it than upside has resistance above it.
Positioning and unusual flow
One rough estimate of dealer positioning puts both the whole chain and the September 25 expiration in a positive-gamma regime — market makers hedge the options they've sold, and in this regime their hedging tends to dampen moves rather than amplify them. That fits the $106 max pain and the tight implied range. Treat it as an estimate built on an assumed sign convention, not observed inventory.
Three live flow items stood out on Friday. The September 25 $107 calls traded 4,933 contracts against 2,053 open — 2.4× turnover and $609,225 of premium, the biggest single-contract flow in the week's expiration, right at the money. The September 25 $108 calls traded 3,672 on 1,955 open ($288,252). On the other side, the October 9 $99 puts turned over 435 contracts against just 45 open — a nearly 10× turnover day in a strike nobody was using, and the October 9 $103 puts traded 528 against 152 open. Short-dated call speculation at the money, cheap downside insurance a few weeks out. That is exactly the split the skew and open-interest data described.
3 · Technical check
Both chart models lean the same way, and both lean against the drift-higher case. The 3-day report (target date September 23) is bearish with a target of $105.60 and a projected range of $104.10 to $108.30; the 5-day report (target date September 25) is bearish with a target of $105.55 and a projected range of $103.70 to $108.20. The reasoning is consistent across the two: price trades below the short-term EMAs, the 50-day ($109.91) and the 200-day ($118.70); the 14-day RSI rolled over from ~51 to 42.4 after a failed bounce; money-flow turned to distribution at −0.05; and ADX is building off 20 with −DI above +DI. Both name $107.40 as the level that invalidates the bearish case on a sustained close above it.
Classify this as mixed rather than a clean divergence: the technical targets sit comfortably inside the options-implied range, so the two frameworks aren't contradicting each other on magnitude — only on tilt. The options chain says "$106 pin, ceiling at $110." The chart says "$105.55, and the ceiling is $107.40, much lower." The reconciling question is whether the September 25 $107 call buyers or the October $99–$103 put buyers are right.
Model vs. Market: The options market implies $103.38–$110.08 into September 25; the 5-day technical model targets $105.55. Both fit inside one range — but the chart's ceiling ($107.40) sits $2.60 below the chain's ($110.00), and a decisive close above $107.40 would resolve the argument in the options market's favor.
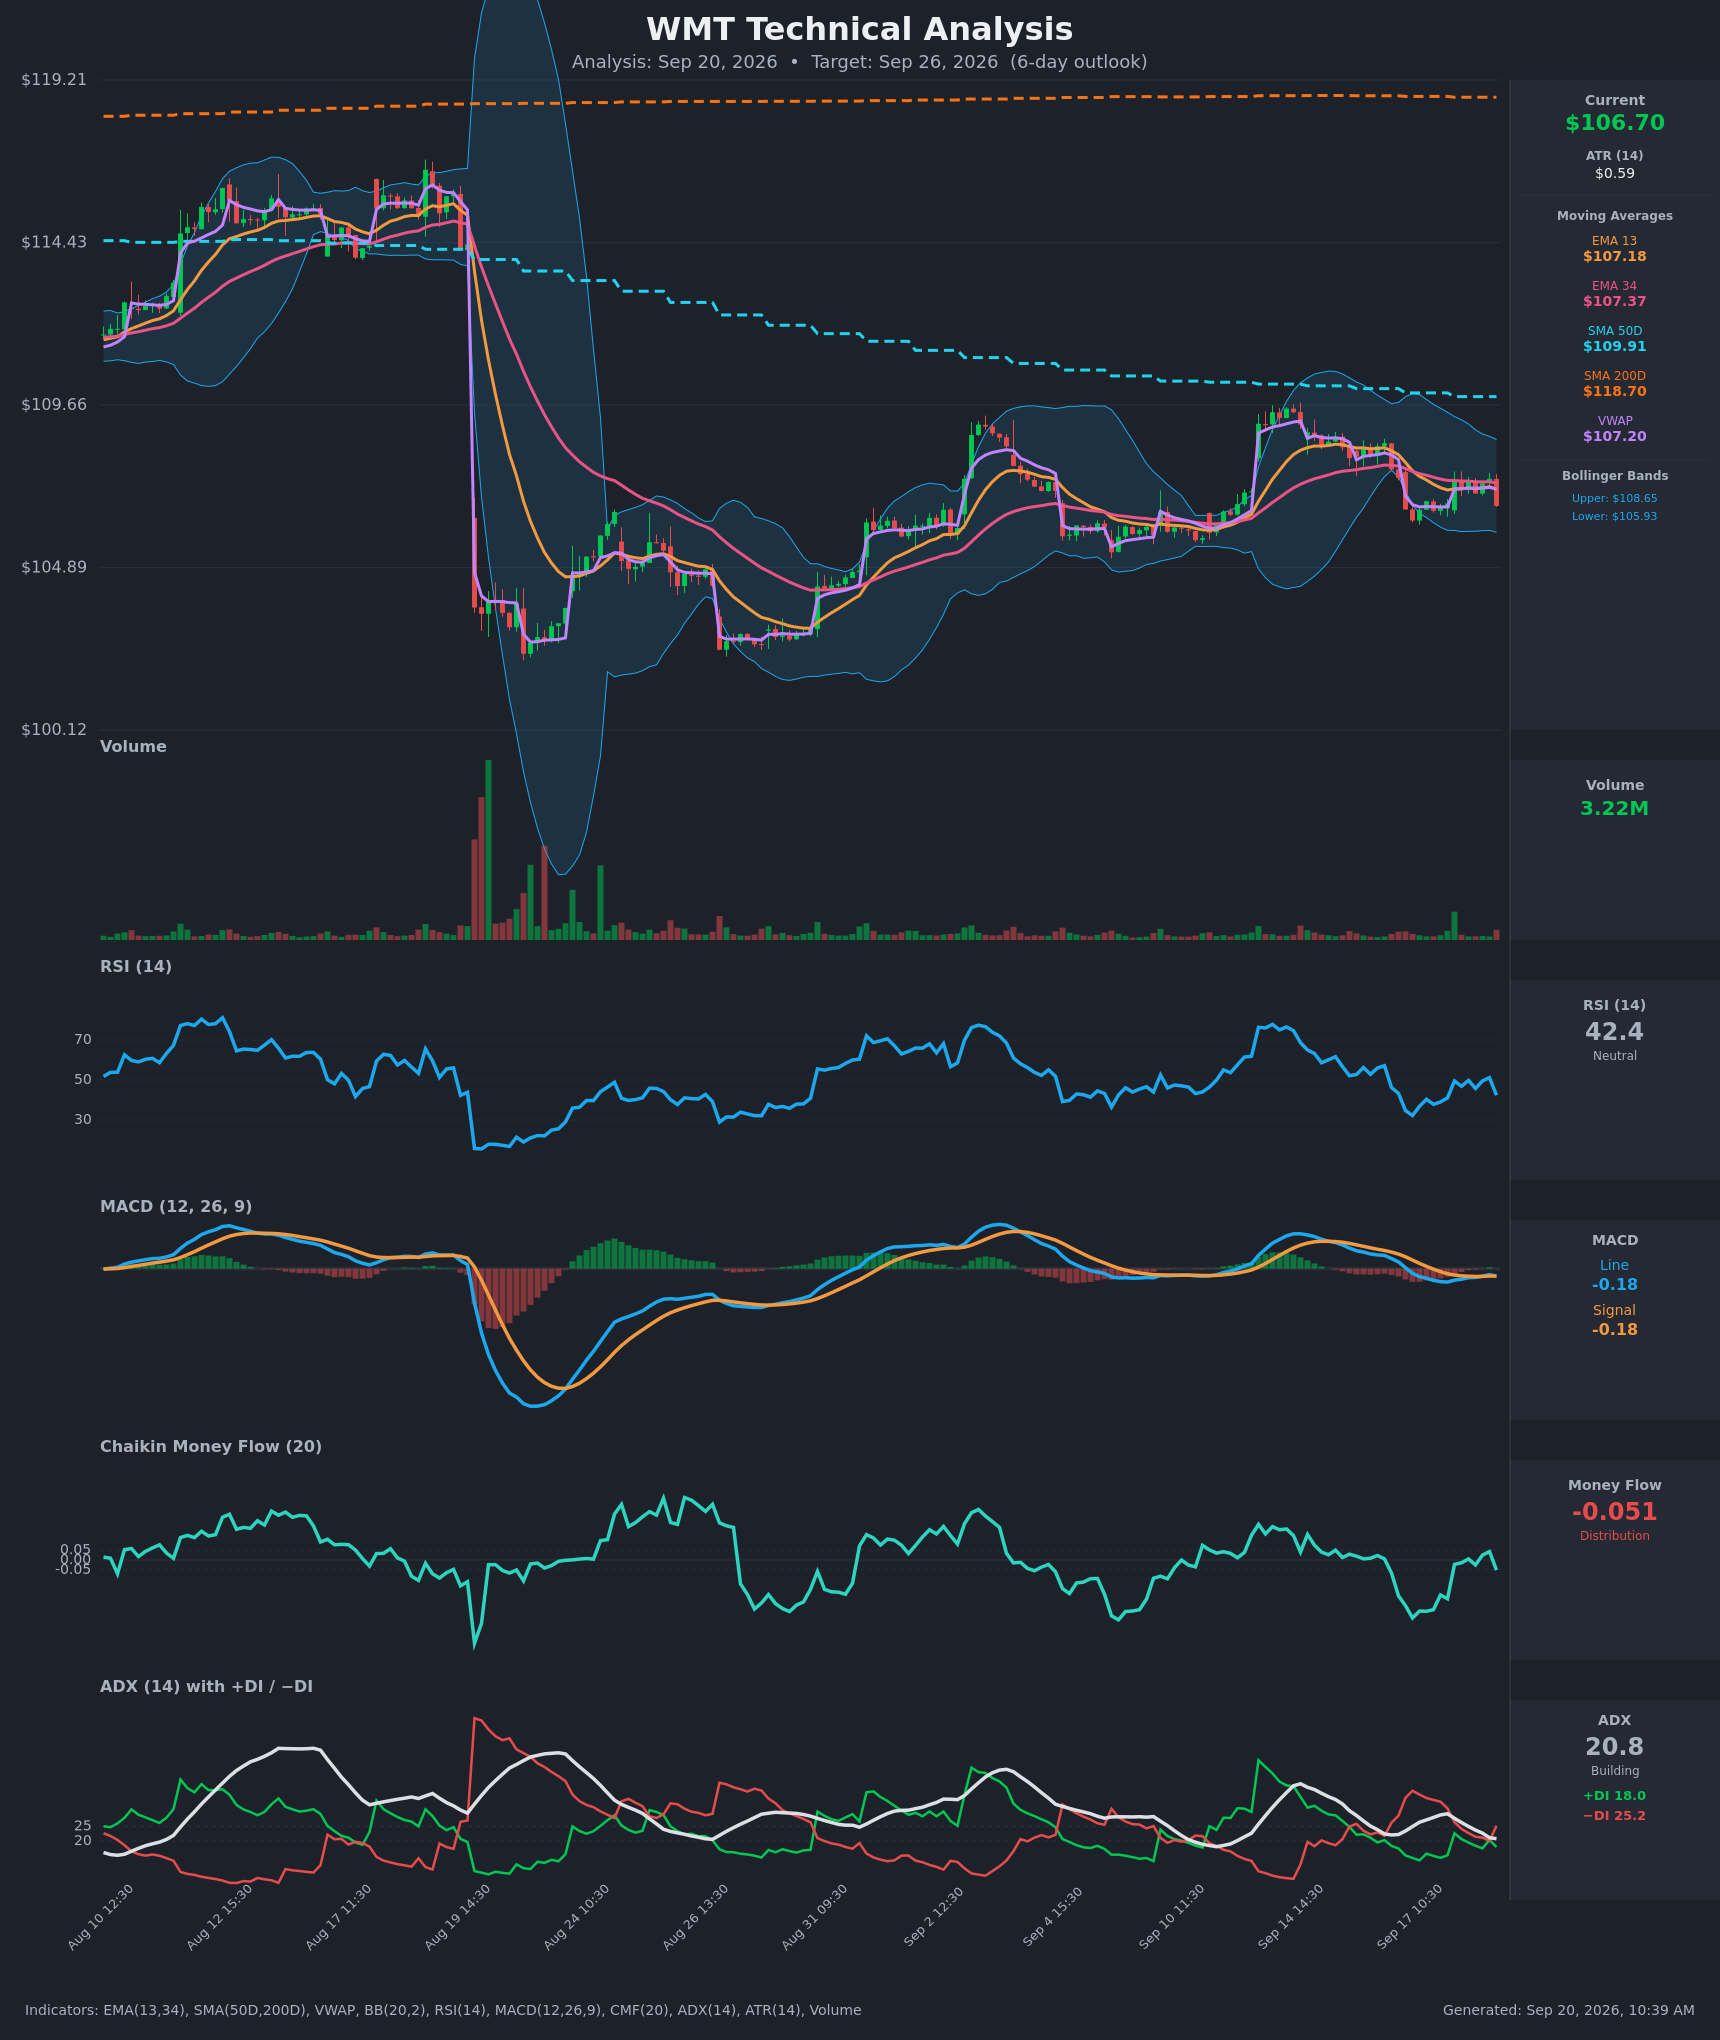
Full technical write-ups: 3-day report → · 5-day report →
The practical effect on strike selection below: the bearish technical read is why the neutral structure's short call sits at the wall ($110) rather than being shaded down, and why the bullish structure's short put is placed at $105 — on the swing-support shelf the chart models are testing — rather than tighter to spot.
4 · Three ways the next five days can go
If WMT pushes above the call wall ($110.00): That strike carries 31,322 open calls for this expiration and is the largest gamma concentration in the entire chain, so it is the kind of level that tends to slow rallies as hedging flows lean against the move. Getting there requires clearing $107.40 and the 50-day at $109.91 first. Above $110, positioning thins out considerably until the October $115 pile — there is simply less open interest to work against price.
If WMT drifts between the walls: This is the base case the structure supports. Max pain for September 25 is $106.00, a dollar below Friday's close, the 20-day moving average is right there at $106.05, and the estimated dealer-gamma regime is positive, which is the configuration where hedging flows tend to pull price toward the heaviest strikes rather than away from them. A close anywhere between roughly $105 and $108 next Friday would be an unremarkable outcome for this chain.
If WMT breaks below the put wall ($100.00): That would require a 6.3% move in five sessions — well outside the implied range — so the more realistic downside branch is a break of the $105.16 shelf toward the $103.38 lower rail and the $102.21 pivot. Note that spot currently sits unusually far above the estimated gamma flip level ($60) for this name, so the "hedging amplifies the selling" scenario isn't in play at these prices; a decline here would be ordinary supply, not a positioning cascade.
5 · Three defined-risk structures
Prices are end-of-day midpoints as of 2026-09-18. All structures are hypothetical. Verify live prices before trading — these will be stale by the open.
If you expect the range to hold: Sep 25 iron condor
- Trade: Sell the $104 put / buy the $102 put, and sell the $110 call / buy the $112 call, all expiring September 25
- Credit: ~$0.47 ($47 per condor) · Max profit: $47 · Max loss: $153 · Break-evens: $103.53 and $110.47
- Why it fits: The short call sits exactly on the week's call wall ($110.00) and the short put sits just inside the lower implied rail ($103.38), with max pain at $106.00 between them. You collect a credit up front and keep it if WMT expires inside the rails; the premium is modestly rich at the 64th percentile of its own recent readings.
- Makes sense only if: you believe the quiet-tape read — 20-day realized volatility is unusually low for this name and the estimated gamma regime is the dampening kind.
- Invalidated if: WMT closes below $103.38 or above $110.08.
- Managing it: Close at roughly 50% of max credit; exit the whole package by September 24 rather than carrying pin risk into expiration; if either short strike closes in the money, close rather than hope.
- Liquidity note: The $110 calls are the tightest leg on the board — 2¢ wide on a $0.29 mid (about 7%) with 31,322 contracts open. The $104 puts quote 16¢ wide on a $0.40 mid and the $102 puts 2¢ on $0.11, both well outside a 5% spread, so enter as a single package with a limit and expect to leave something on the table.
- Analyze this position →
If you lean bullish: Sep 25 $105/$103 put credit spread
- Trade: Sell the September 25 $105 put, buy the September 25 $103 put
- Credit: ~$0.33 ($33) · Max profit: $33 · Max loss: $167 · Break-even: $104.67
- Why it fits: A credit spread pays you up front to be right slowly — you keep the credit as long as WMT stays above $105 at expiration. The short strike sits on the $105.16 swing-support shelf and just under the 20-day moving average at $106.05, and it's the level both chart models are testing rather than the level they target breaking.
- Makes sense only if: you read the heavy put building as hedging into a quiet tape rather than conviction — which is what the unusually flat skew (puts 0.9 vol points cheaper than their own norm relative to calls) suggests.
- Invalidated if: WMT closes below $105.00.
- Managing it: Take profit at ~50% of the credit; with the short-term trend fighting a 50-day average that sits 2.89% overhead, this is a take-the-money structure, not a hold-to-expiration one. Exit by September 24.
- Liquidity note: The $105 puts trade 5¢ wide on a $0.575 mid (about 9%) on 566 contracts of volume; the $103 puts are 16¢ wide on a $0.25 mid — the wide leg, and the reason to use a package limit order.
- Analyze this position →
If you lean bearish: Sep 25 $108/$110 call credit spread
- Trade: Sell the September 25 $108 call, buy the September 25 $110 call
- Credit: ~$0.50 ($50) · Max profit: $50 · Max loss: $150 · Break-even: $108.50
- Why it fits: This is the cleanest way to express the chart models' view without needing a decline. You keep the credit as long as WMT stays below $108 — which is above both the $107.40 technical ceiling and the $107.02 swing pivot, and below the $110.00 call wall you're buying protection at. Max pain at $106.00 works for you.
- Makes sense only if: you want the bearish tilt but respect the $110 wall as your defined risk cap rather than shorting into an open-ended move.
- Invalidated if: WMT closes above $108.50.
- Managing it: Close at ~50% of max credit or by September 24. If WMT clears $107.40 on a closing basis — the level both chart models name as their own invalidation — close rather than defend, because the next real barrier is $110.
- Liquidity note: The $108 calls traded 3,672 contracts Friday at a 7¢-wide quote on a $0.785 mid (about 9%); the $110 calls are 2¢ wide. The tightest of the three structures to fill.
- Analyze this position →
If none of these: no trade
There is a real case for standing aside here, and the premium-rich reading is exactly why it needs stating. Yes, options are priced about 2.8 vol points above delivered movement at the 64th percentile of their own history — but that richness appeared in a single session because the August 20 gap dropped out of the realized-volatility window, not because option prices rose. On the absolute scale, IV rank is 19.9/100: you are selling some of the cheapest premium WMT has offered in a year, and on 7-DTE contracts where a 2¢ spread is 7% of the mid, execution friction eats a meaningful slice of a $47 credit. If you cannot get filled near the midpoint on all legs, the edge isn't there. Waiting for either a higher IV rank or a decisive break of $107.40 or $105.16 beats forcing a position into a $106 pin.
6 · Quick FAQ
What is WMT's expected move this week? About ±$3.35, or ±3.14% — a $103.38 to $110.08 range into the September 25 expiration, per the options market's straddle pricing as of the September 18 close.
Is WMT expected to go up or down over the next five days? Options positioning as of September 18 reads neutral — the leading positioning signals, momentum blend, and term sentiment cancel out, with front-end put building offset by unusually flat skew — but that's a read of what traders have done, not a forecast. The actionable map is the $103.38–$110.08 range, the $100.00/$110.00 wall pair, and $106.00 max pain.
Are WMT options expensive right now? Two lenses. IV rank 19.9/100 says option prices are lower than about 80% of the past year's readings. On top of that, they're running roughly 2.8 vol points above the movement WMT has actually delivered over 20 sessions — richer than about 64% of this stock's own recent readings. Mildly favorable for premium sellers, but the richness came from realized volatility collapsing as an old gap rolled out of the window, so don't oversize on it.
Where is WMT's biggest options support and resistance? For the September 25 expiration: put wall $100.00, call wall $110.00. The call wall is the far more substantial of the two at 31,322 contracts versus 3,144.
What invalidates this week's read? A close below $103.38.
Methodology & disclosures. Data: end-of-day options-chain snapshot for WMT, 2026-09-18, generated 2026-09-20T10:38:59.953Z. Prices shown are midpoints and will differ from live markets. Momentum/positioning scores and volatility-premium comparisons are descriptive measurements of past option flow and past price movement — not investment advice, signals, forecasts, or guarantees. All trade structures are hypothetical. Every structure shown has a defined maximum loss; you can lose the entire max-loss amount. Options involve substantial risk and are not suitable for all investors.