XLE Options Are Pricing a $2.27 Move Into Oct. 12. The Chart Model Leans Higher.
XLE options imply a $60.55–$65.09 range through the October 12 expiration, and our positioning read is a plain Neutral. Here is how the walls, the bleed in implied volatility and a mildly bullish chart model fit together, plus three defined-risk ways to trade it.
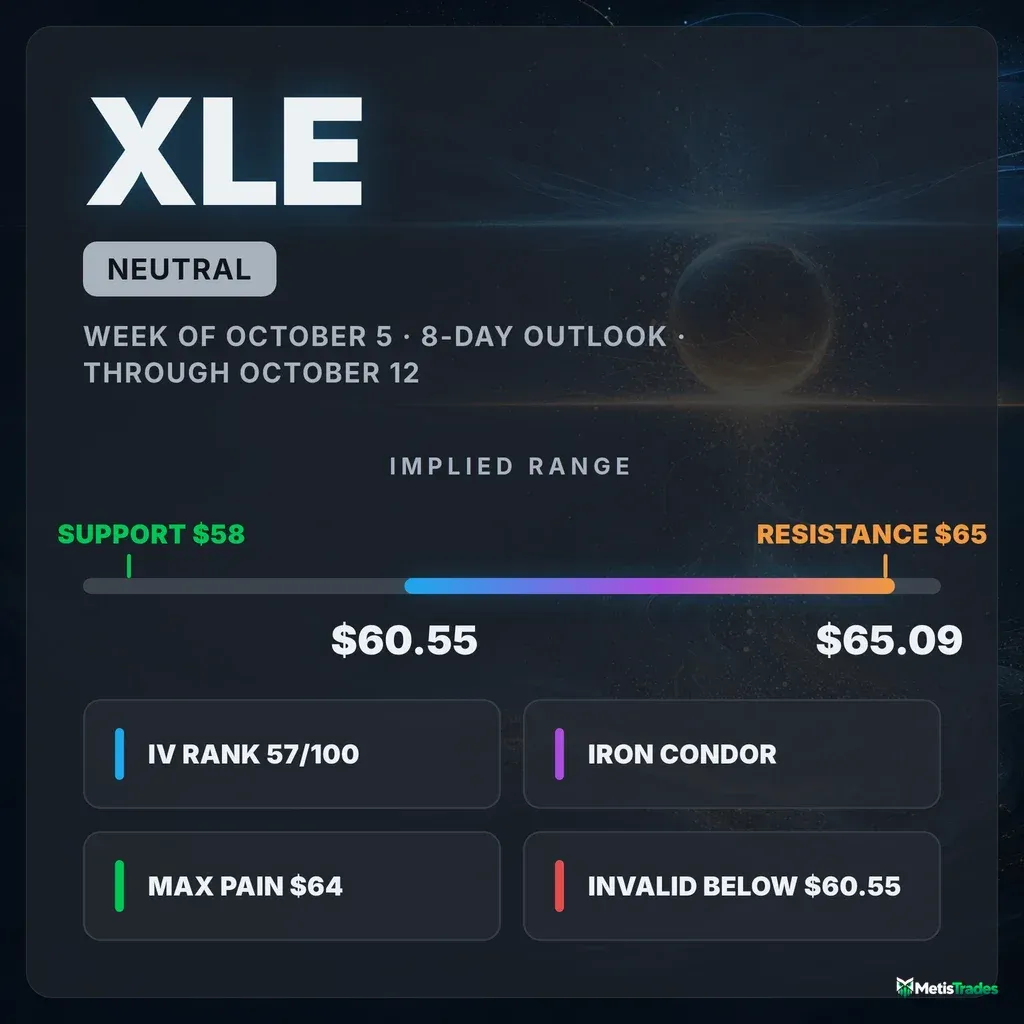
The options market implies a $60.55–$65.09 range for XLE into the October 12 expiration. Below: what is driving that range, where the key levels sit, and three defined-risk ways to trade it.
Published Sunday, October 4, 2026 · Data as of Friday, October 2, 2026 close
Explore the live XLE options data in the Detailed Options Analyzer →
Quick answer
| Item | Answer |
|---|---|
| Market bias | Neutral |
| Options-implied range (into Oct 12) | $60.55 – $65.09 (±3.61%, ±$2.27) |
| Major support | $58.00 (Oct 12 put wall); $60 is the heaviest put strike across the whole chain |
| Major resistance | $65.00 (Oct 12 call wall, which is also the whole chain's heaviest call strike) |
| Max pain (Oct 12) | $64.00 |
| Dealer gamma regime (estimate) | Negative: hedging tends to amplify moves. Flip level: not available in today's data |
| Volatility condition | Falling. IV rank 57/100. Premium is fair: options are priced about 4.8 vol pts above delivered movement |
| Technical check | Mixed (bullish, 4-day and 8-day models; both targets sit inside the implied range) |
| Best-fitting strategy | Oct 12 $60/$61 – $65/$66 iron condor, conditional on the range holding |
| Analysis invalidated if | XLE closes below $60.55 |
1 · What matters today
XLE closed at $62.82 on Friday, and our read of options positioning comes out Neutral. The signals are split, not quiet:
- Very short-dated traders were chasing calls.
- Puts still dominated Friday's overall volume.
- Put protection costs more than its usual premium over calls.
The options market is pricing a move of about $2.27 either way into the October 12 expiration, which gives a $60.55–$65.09 range. That figure is the expected move, derived from what straddles cost.
The biggest pile of call contracts for that expiration sits at $65, right at the top of the range. The level that changes the picture is $60.55. A close below it would break the priced-in range and push XLE toward the $60 strike, where chain-wide put open interest is enormous.
Both chart-model reports lean modestly bullish, but their targets sit comfortably inside the options range.
2 · What the options market is pricing
What changed this week
Volatility came out of options quickly. At-the-money implied volatility fell about 27% over the last five sessions. It peaked at 35.4% on September 25 and has since settled at 25.9%. IV rank now sits at 57, against a 7-day average near 69.
The stock recovered a little. XLE gained 1.26% over five sessions after the late-September slide to about $61.50. It is still down 2.8% over the past month. Our trend reads show the same thing:
- The roughly one-month view leans bearish.
- The past week and the past two-and-a-half months are both flat.
- A fresh bullish crossover in short-term options momentum printed on Friday itself.
In short, the short-term bounce is still pushing against a soft one-month tape.
Flow swung hard. Put-to-call volume ran 1.96 on Friday, meaning nearly two puts traded for every call. That is close to its 7-day average of 2.02 but far above the 3-day average of 1.06, because Wednesday and Thursday were call-heavy sessions.
Open interest barely moved. Open interest means contracts currently held open. The put/call open-interest ratio is 1.37, versus a 14-day average of 1.33. Traders are not adding much new downside protection overall.
The largest new positions were near-dated calls and a big put line:
- The October 9 $65 calls gained 899 contracts of open interest.
- The October 16 $60 puts added 881 contracts, bringing that strike to 138,457 open.
- Into Friday's expiration, the now-settled October 2 $63 calls added 1,144 contracts. That is history, not a live level.
Expected move
Straddle pricing puts the expected move into the October 12 expiration at ±$2.27, or ±3.61%. Around the $62.82 snapshot price, that gives $60.55 to $65.09.
| Expiration | Implied move | Range around $62.82 |
|---|---|---|
| Oct 7 | ±2.75% | $61.09 – $64.55 |
| Oct 9 | ±3.37% | $60.70 – $64.94 |
| Oct 12 (target) | ±3.61% | $60.55 – $65.09 |
| Oct 16 | ±4.83% | $59.79 – $65.85 |
| Oct 30 | ±7.09% | $58.37 – $67.27 |
The ladder widens smoothly, with no sudden step-up between rungs. Nothing on the chain looks like a scheduled event being priced in. The October 12 rung adds only a little over the October 9 rung because its at-the-money IV (21.8%) is the lowest in the near-dated curve.
Volatility
Where IV sits. Implied volatility (IV) is the market's estimate of how much XLE will move, baked into option prices. It stands at 25.86%.
- IV rank is 57/100. That is where today's IV sits versus the past year: higher than 57% of the range, so options are cheaper than about 43% of the past year's readings.
- IV fell 2.1% on Friday and is about 2% higher than a month ago.
- It sits slightly below its 30-day average (26.5%) and its 90-day average (26.3%).
- Roughly two-month IV is 26.3%.
Term structure. Term structure compares option prices across expiration dates. The front-month read is unavailable today because Friday was an expiry day, so we are not reading anything into the curve's slope.
How much the stock is actually moving. Over the past week, XLE's realized movement has slowed noticeably compared with the past month, and that slowdown is unusual for this fund. "Unusual" here is measured against XLE's own recent history, not the broader market. The late-September volatility is fading from the price action itself, not just from option prices.
Premium rich or cheap. The volatility risk premium is the gap between how much movement options are priced for and how much XLE has actually delivered. When it is positive, option sellers have been collecting more than realized movement cost them.
- Today the gap is about 4.8 vol points: ATM IV of 25.9% versus 21.1% realized over 20 days.
- That reading is in the 64th percentile of this fund's recent history. It is richer than about two-thirds of XLE's recent readings, but nowhere near extreme.
- The gap has compressed sharply: it was about 13.5 points on September 25 and 11.4 on September 30 before IV bled out.
- No earnings calendar applies to this ETF, so this is a clean read.
IV rank 57 plus a 64th-percentile premium over delivered movement means premium is fair. That is enough to make credit structures workable, but not a strong enough edge to make selling premium the automatic choice.
Skew and sentiment
Skew. Puts and calls the same distance from the stock price don't always cost the same. When puts are pricier, traders are paying up for crash protection.
- XLE's 25-delta puts trade about 1.4 vol points over equivalent calls.
- The 60-day norm for this fund is about −0.4, with calls slightly richer. So traders are still paying a modest premium for downside protection.
- That premium is far smaller than earlier in the week. Skew flattened by roughly 7 vol points over five sessions as the late-September panic hedges bled off.
Put/call ratios. The put/call ratio measures put activity relative to calls; above 1 means puts dominate. Friday's 1.96 volume ratio is unusually heavy for this name compared with its own recent norm. Open interest has been steady at 1.37, versus 1.33 over 14 days. Overall option volume was light, at 70% of its 20-day average, so the put tilt came on thin trading.
Sentiment by expiration date:
- Contracts expiring within 7 days: strongly bullish. Calls are priced richly versus their norm, and call open interest and call-side flow are both building.
- The 7–30 day window: only mildly bullish.
- Two to four months out: leaning bearish.
Taken together, this pattern reads as a "bullish blow-off": a leveraged chase concentrated at the very front of the curve rather than conviction further out. As recently as September 28, every expiration window leaned bearish. Over the past seven sessions the average sentiment across windows was essentially calm.
The key levels map
| Level | Price | Why it matters |
|---|---|---|
| 52-week high / swing resistance | $66.17 | Top of the year's range |
| Implied-range high (Oct 12) | $65.09 | Upper edge of the priced-in move |
| Call wall (Oct 12 and whole chain) | $65.00 | Heaviest call open interest (103,423 contracts chain-wide); often a ceiling or magnet |
| Swing resistance | $64.70 | Prior pivot cluster |
| Unfilled gap top | $64.31 | September 21 gap-down from $64.31 remains open |
| Max pain (Oct 12) / large-gamma strike | $64.00 | Where the most Oct 12 option value would expire worthless; expirations sometimes gravitate toward it |
| 20-day moving average | $63.47 | Short-term trend line XLE sits just below |
| Swing resistance | $63.38 | First overhead pivot |
| Large-gamma strike | $63.00 | Dense open interest near spot |
| Spot | $62.82 | Friday's close |
| Large-gamma strike | $62.50 | Heavy put-and-call open interest just below |
| 50-day moving average | $62.11 | Medium-term trend support |
| Swing support | $61.42 | Late-September lows |
| Swing support | $60.90 | Next pivot down |
| Implied-range low (Oct 12) | $60.55 | Lower edge of the priced-in move; this article's invalidation level |
| Heaviest put strike (whole chain) / largest gamma | $60.00 | 209,728 put contracts across all expirations, the chain's single biggest pile |
| 100-day moving average | $59.41 | Longer-term trend reference |
| Swing support | $59.37 | Deeper pivot |
| Put wall (Oct 12) | $58.00 | Heaviest Oct 12 put strike, though only 261 contracts |
| Swing support | $57.18 | Lower pivot |
| 200-day moving average | $56.55 | Long-term uptrend intact far below |
One caution on the October 12 walls: that expiration is thin. Its call wall at $65 holds just 82 contracts. The real weight sits in the October 16 expiration, two trading days later, which carries 138,457 contracts at the $60 put. Treat $65 and $60 as the meaningful chain-wide magnets, and treat the October 12 put wall at $58 as a minor marker.
Positioning and unusual flow
Dealer gamma. Market makers hedge the options they've sold. One rough estimate puts the whole chain in a negative gamma regime, where their hedging tends to amplify moves rather than cushion them. The October 12 expiration also estimates negative, but its open interest is too small to matter much on its own. The heavily stocked October 16 expiration is what drives the negative reading. A gamma-flip level couldn't be estimated from today's data.
Unusual flow worth knowing:
- October 5 $64 calls: 2,068 contracts traded against only 179 open, more than 11 times the existing open interest. That is a cheap, near-dated upside lottery bet.
- October 12 $62 puts (the target expiration): 271 contracts traded against 33 open, roughly 8 times turnover. Someone bought or sold protection just under spot right into this window.
- October 16 $64 calls: 5,250 contracts and about $399,000 of premium changed hands. That was the largest dollar trade on the board, with prints landing above the midpoint, which suggests buyers were paying up.
- December 18 $52.50 puts: 32,806 contracts traded against 38,006 already open. This is a far-out-of-the-money hedge being turned over in size, a reminder that deep tail protection is still in demand.
3 · Technical check
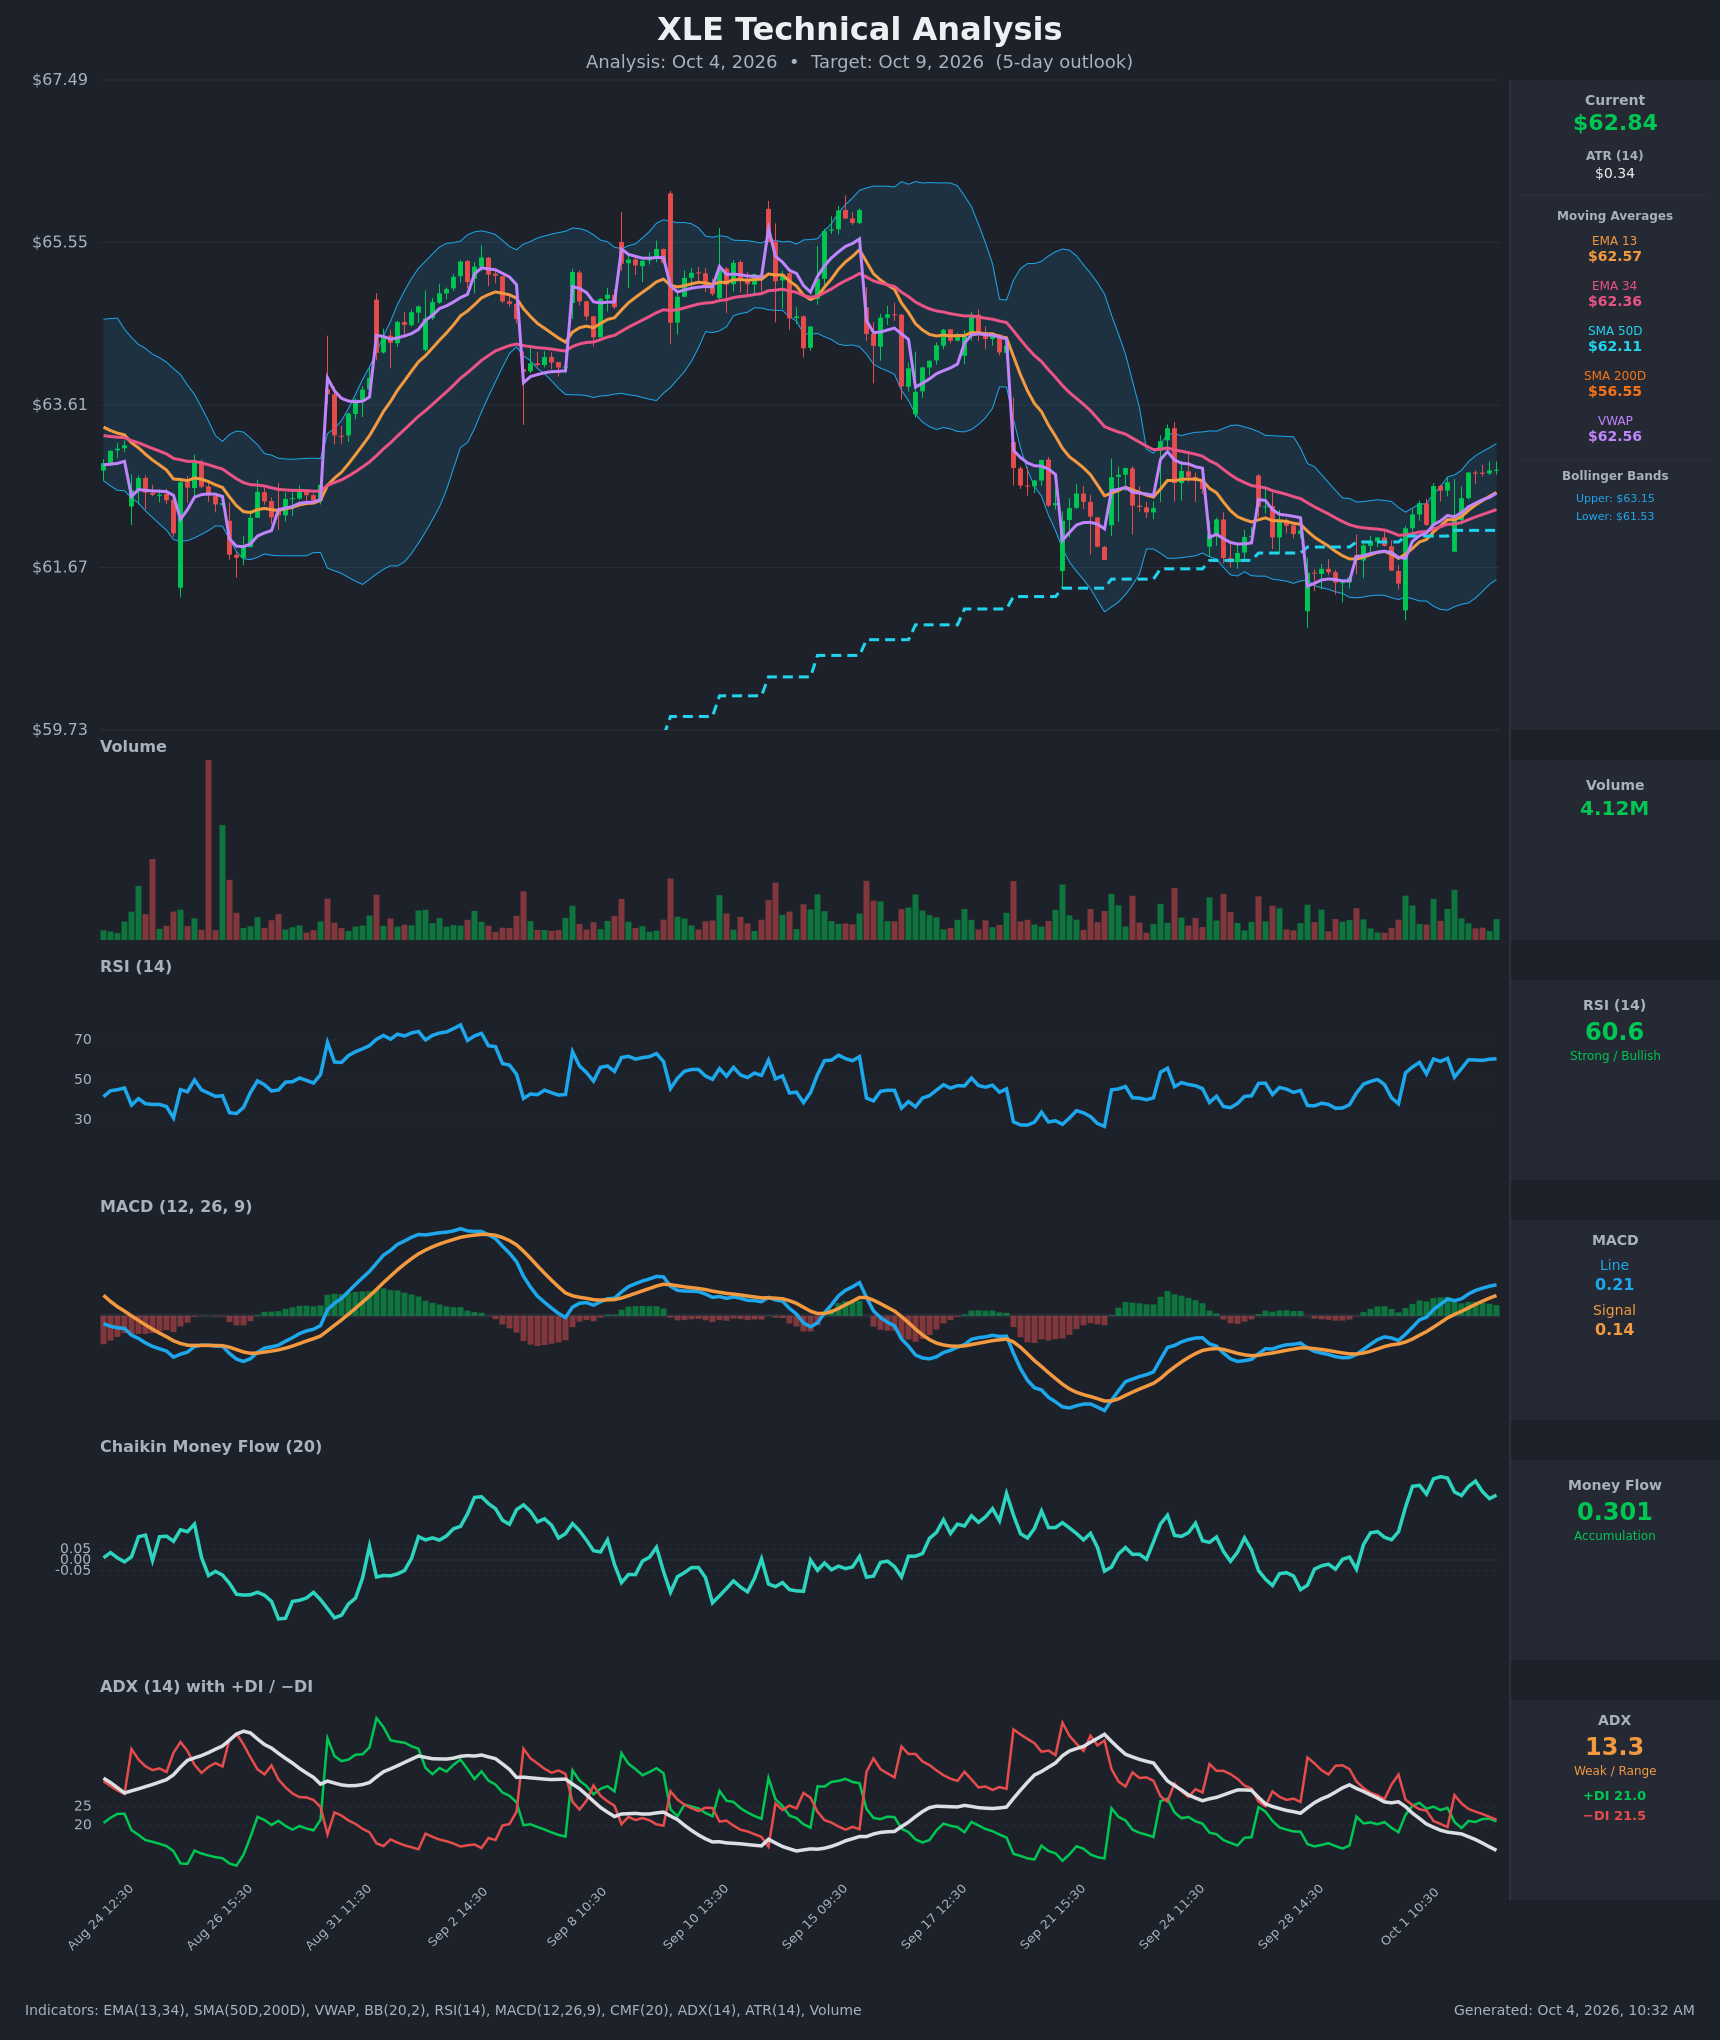
The 4-day chart model is bullish.
- Target: $63.25 by October 8, with a projected range of $61.40 to $65.10.
- Its reference price of $62.84 matches the options snapshot.
- Key levels: support $62.36, resistance $63.15 (the upper Bollinger Band).
- Why it leans up: strong accumulation in money-flow readings (CMF near 0.30) and a fresh MACD crossover.
- The caveat: a weak, falling ADX of about 13 signals a grind inside a range rather than a breakout.
Because the target sits inside the options-implied range, the call is directionally more positive than our Neutral read but does not contradict the range. We classify it as Mixed.
The 8-day model, which lines up with the October 12 expiration, says the same thing.
- Bullish target: $63.45, with a projected range of $61.30 to $65.10.
- Thesis: a double bottom near $61.40–61.50 whose neckline around $63.15 is being tested now.
- Its dominant scenario is invalidated by a close back below $62.36.
How the two views compare. The options market and the chart model agree on the size of the range. They differ only on whether XLE drifts toward the upper half. Notably, the model's $63.45 target sits below Oct 12 max pain at $64. The model's lean nudged us to include a small bullish debit spread aimed at $63–$64, but it did not move the condor's short strikes.
Model vs. Market: The options market implies $60.55–$65.09 into October 12; the 8-day technical model targets $63.45. That is a modest upward drift well inside the priced range. A daily close above the $63.15–$63.38 neckline zone would be the first sign the chart's lean is winning out over neutral positioning.
Full technical write-ups: 4-day report → · 8-day report →
4 · Three ways the next 8 days can go
If XLE pushes above the call wall ($65): The heaviest call open interest on the chain sits at $65, and rallies into that kind of concentration often stall as positions are hedged or closed. A clean break would run into the $65.09 edge of the priced range. Above that, positioning thins out toward the $66.17 52-week high. Under the negative-gamma estimate, that thinner air could let a move extend faster than usual.
If XLE drifts between the walls: This is the base case. Max pain for October 12 is $64, slightly above spot, and the $63–$64 band holds dense gamma. Expiring open interest tends to pull price toward those strikes into settlement. A drift from $62.82 toward $63–$64 fits both the max-pain pull and the chart model's targets. Bounded by swing support at $61.42, that range is where the condor earns its credit.
If XLE breaks below the implied low ($60.55): The $60 strike holds the chain's largest put stack, mostly in the October 16 expiration. One rough estimate has dealers in negative gamma, so their hedging could accelerate selling into that level rather than cushion it. A flip level couldn't be estimated today, so watch $60.55–$60 as the danger zone. The October 12 put wall at $58 is the next marker beneath.
5 · Three defined-risk structures
Prices are end-of-day midpoints as of October 2, 2026. All structures are hypothetical. Verify live prices before trading; these will be stale by the open.
A note on ordering and liquidity before the trades:
- With a Neutral bias and a mid-pack volatility premium, the range-holding structure leads.
- Every October 12 strike trades wide; most bid-ask spreads exceed 20% of mid, and several exceed 40%. Use limit orders at or near mid and expect some slippage.
- Readers who want tighter fills can apply the same logic to the October 16 expiration, which is far more liquid but adds two days and a heavier $60 put stack.
If you expect the range to hold: Oct 12 iron condor
Mechanics: you collect a credit by selling a put spread below the market and a call spread above it. You keep the credit if XLE stays between the short strikes.
- Trade: Sell the Oct 12 $61/$60 put spread and sell the Oct 12 $65/$66 call spread.
- Credit: $0.32 ($0.155 put side + $0.165 call side)
- Max profit: $32
- Max loss: $68
- Break-evens: $60.68 and $65.32
- Why it fits: The bias is Neutral. The short call sits exactly on the $65 call wall, and the short put sits just inside the $60.55 implied low. IV rank of 57 and a fair volatility premium make collecting premium reasonable.
- Makes sense only if: You accept that the chart model leans up and negative gamma could stretch a move. The position wants calm settlement near $63–$64 max pain.
- Invalidated if: XLE closes below $60.55 or above $65.09.
- Managing it: Close at about 50% of the credit. Close the threatened side if XLE closes through $61 or $65. Don't hold into the final session hoping for a pin.
- Liquidity note: Fills will be the hardest part of this trade.
- The $61 puts traded 12¢ wide, which is workable.
- The $60 puts traded 25¢ wide.
- The $65 calls traded 63¢ wide ($0.12/$0.75).
- The $66 calls traded 46¢ wide.
- Analyze this position →
If you lean bullish: Oct 12 $63/$64 bull call spread
Mechanics: you pay a debit for a call and sell a higher call to cut the cost. You profit as XLE rises toward the upper strike.
- Trade: Buy the Oct 12 $63 call, sell the Oct 12 $64 call.
- Debit: $0.38
- Max profit: $62
- Max loss: $38
- Break-even: $63.38
- Why it fits: The spread targets the zone where three readings line up: Oct 12 max pain at $64, the chart model's $63.25–$63.45 targets, and the front-week call chase.
- Makes sense only if: XLE clears the $63.15–$63.38 neckline and resistance zone. Below it, this structure decays.
- Invalidated if: XLE closes below $61.42.
- Managing it: Take profits around $0.60–$0.70 of spread value. The short-term bounce is fighting a soft one-month trend, so don't overstay. Exit if XLE closes back below $62.11, the 50-day average.
- Liquidity note: Both legs are wide. The $63 calls traded 43¢ wide ($0.66/$1.09) and the $64 calls 51¢ wide ($0.24/$0.75). Work the order at mid and be patient.
- Analyze this position →
If you lean bearish: Oct 12 $62/$60 bear put spread
Mechanics: you pay a debit for a put and sell a lower put to reduce the cost. You profit as XLE falls toward the lower strike.
- Trade: Buy the Oct 12 $62 put, sell the Oct 12 $60 put.
- Debit: $0.39
- Max profit: $161
- Max loss: $39
- Break-even: $61.61
- Why it fits: Several readings argue for a drop: put-heavy volume, puts priced above their norm, a bearish one-month trend read, and a negative-gamma estimate that could speed a slide toward the $60 put stack. The spread's floor sits at that stack.
- Makes sense only if: XLE loses the 50-day average at $62.11 and the $61.42 swing low.
- Invalidated if: XLE closes above $63.38.
- Managing it: Take profits if XLE reaches $60.50–$60.90. Cut the trade if the chart's neckline breakout above $63.15 confirms.
- Liquidity note: The $62 puts traded 27¢ wide ($0.39/$0.66) and the $60 puts 25¢ wide. Fills near mid are possible but not guaranteed.
- Analyze this position →
If none of these: no trade
Standing aside is a legitimate choice this window, for three reasons:
- Thin liquidity. The October 12 expiration is thinly traded, and quoted spreads can eat a third or more of a small credit before the market moves at all.
- No clear edge. The positioning signals genuinely cancel out, and the volatility premium has already compressed from double digits to under 5 points. Neither side has a clean edge.
- An easy alternative. If you want exposure, the October 16 expiration offers similar levels with far better fills.
Otherwise, waiting for a daily close outside $61.42–$63.38 lets the market show its hand before you commit.
6 · Quick FAQ
What is XLE's expected move into October 12? About ±$2.27 (±3.61%), which gives a $60.55–$65.09 range around $62.82. This is based on options straddle pricing as of October 2, 2026.
Is XLE expected to go up or down over the next 8 days? Options positioning as of October 2 is Neutral. Front-week call buying offsets put-heavy volume and still-elevated put prices. That is a read of what traders have done, not a forecast. The actionable map is the $60.55–$65.09 range, with $60 and $65 as the chain's heaviest put and call strikes.
Are XLE options expensive right now? Moderately. IV rank 57/100 means option prices are higher than 57% of the past year's range. They also run about 4.8 vol points above the movement XLE has actually delivered, which is richer than about 64% of its own recent readings. That makes premium fair rather than rich, after a sharp drop from late-September levels.
Where is XLE's biggest options support and resistance? For the October 12 expiration, the call wall is $65 and the put wall is $58. Across the whole chain, the heaviest put strike is $60 and the heaviest call strike is $65.
What invalidates this read? A daily close below $60.55, the bottom of the options-implied range.
Methodology & disclosures. Data: end-of-day options-chain snapshot for XLE, 2026-10-02, generated 2026-10-04T10:32:26.014Z. Prices shown are midpoints and will differ from live markets. Momentum/positioning scores and volatility-premium comparisons are descriptive measurements of past option flow and past price movement — not investment advice, signals, forecasts, or guarantees. All trade structures are hypothetical. Every structure shown has a defined maximum loss; you can lose the entire max-loss amount. Options involve substantial risk and are not suitable for all investors.