XLE Options Are Pricing a $2.77 Move by September 21 — Our Read Says the Range Holds
XLE's options chain is loaded with puts, but the price structure underneath it is still climbing. Here's the $62.37–$67.91 band the market is pricing into the September 21 expiration, the three levels that matter, and three defined-risk ways to trade a range.

The options market implies a $62.37–$67.91 range into the September 21 expiration; here's what's driving it, where the walls sit, and three defined-risk ways to trade it.
Published Sunday, September 13, 2026 · Data as of Friday, September 11 close
Explore the live XLE options data in the Detailed Options Analyzer →
Quick answer
| Item | Answer |
|---|---|
| Market bias | Neutral |
| Options-implied range (into September 21) | $62.37 – $67.91 (±4.26%, about ±$2.77) |
| Major support | $63.00 (September 21 put wall) |
| Major resistance | $66.00 (September 21 call wall) |
| Max pain (September 21) | $65.00 |
| Dealer gamma regime (estimate) | The September 21 expiration's own estimate is mildly negative (hedging would tend to amplify moves), while the full chain estimates positive (dampening); flip level ≈ $45.50, far below spot |
| Volatility condition | Rising — IV rank 61/100 · premium rich: options priced about 10.6 vol points above delivered movement |
| Technical check | Mixed (both chart models bullish; targets inside the implied range) |
| Best-fitting strategy | Short iron condor into September 21, if the range holds |
| Analysis invalidated if | XLE closes below $63.00 |
1 · What matters today
XLE closed Friday, September 11 at $65.14, and the options market is pricing a move of roughly $2.77 in either direction by the September 21 expiration — a band of $62.37 to $67.91. Flow is heavily put-tilted: 1.76 puts traded for every call, and 25-delta puts (the ones roughly a quarter of the way to being in the money) cost about 4.3 vol points more than the matching calls, against a recent norm where calls were slightly richer. In this ETF, that pattern has more often been protection bought on top of a rally than the start of a decline — price is still up 6.7% over the past month and sits 1.6% under its 52-week high. So we read the positioning as neutral, not bearish. Max pain sits at $65.00, essentially on Friday's close; the put wall is $63.00 and the call wall $66.00. Both chart models lean mildly higher inside that band. A close below $63.00 breaks this read.
2 · What the options market is pricing
What changed over the past week
Money moved to the downside without price following. Put/call volume came in at 1.76 — for every call contract traded, nearly two puts changed hands — against a 7-day average of 1.34 and a 60-day median of 0.70. Open interest tells the same story more slowly: the put/call open-interest ratio went from 1.18 to 1.29 over five sessions, versus a 14-day average of 1.11. The single biggest build in a still-live contract was the October 16 $64 puts, which added 11,761 contracts to 19,452; the September 18 $62 puts added 9,622 to 28,585; and, most relevant here, the September 21 $63 puts were built almost from scratch, +3,210 contracts to 3,315 — that build is the target expiration's put wall. (Into Friday's now-settled expiration, the $66 calls had added 3,144 contracts while the $65 calls shed 2,495 — settled history, not a live magnet.)
Implied volatility firmed alongside that hedging: ATM IV finished at 26.09%, up 5.05% on the day and 4.76% over five sessions, leaving it about 3% above its 30-day average and roughly on its 90-day average. Meanwhile the underlying barely moved — up 0.80% over five trading days. Zoom out and the tension resolves: the short-term trend read is flat, but the medium (+6.7% over roughly 20 days) and long (+23.3% over roughly 50 days) reads both point up and agree with each other. The hedging is landing on top of an intact advance, not into a breakdown.
Expected move
Into September 21, the options market is pricing a move of about ±4.26%, or ±$2.77 around $65.14 — that's the move implied by what at-the-money straddles cost, and it works out to a $62.37–$67.91 band. Here's how that scales across expirations:
| Expiration | Implied move | Range around $65.14 |
|---|---|---|
| September 16 (5 days) | ±2.57% | $63.47 – $66.81 |
| September 18 (7 days) | ±3.56% | $62.82 – $67.46 |
| September 21 (10 days — our horizon) | ±4.26% | $62.37 – $67.91 |
| October 16 (35 days) | ±8.09% | $59.87 – $70.41 |
The rungs step up smoothly — no single expiration is carrying a bulge of event premium — but the slope from the 7-day to the 10-day rung is slightly steeper than square-root-of-time alone would give you, which is the put-side bid showing up in the pricing.
Volatility
ATM implied volatility is 26.09% with an IV rank of 61/100 — that is, today's IV is higher than roughly 61% of the past year's readings, so option prices are on the expensive side of normal for this ETF but nowhere near a panic level. IV rank has been creeping up: the 7-day average is 57.9 and the 14-day 57.4. Direction is mixed by horizon — up 5.05% on the day and 4.76% over a week, but still down 2.50% over 30 days. The front-month versus 60-day comparison is unavailable today because Friday was an expiration day and front-month IV can't be interpolated from a same-day-expiring contract; that read returns on the next session. One broader-market note: VIX sits near the bottom of its own yearly range and only loosely tracks XLE's implied vol (60-day correlation about 0.33), so this is a sector story, not an index-wide vol event.
Premium rich or cheap. The gap between what options are priced for and what XLE has actually delivered — the volatility risk premium — is about 10.6 vol points, with implied at 26.09% against 20-day realized volatility of 15.5%. When that gap is positive, sellers of options have been collecting more than the stock's real movement cost them. And this gap is extreme for this name: richer than about 97% of its own recent readings. Part of that is the numerator (IV firming) and part is the denominator — realized volatility over the past 20 days is unusually depressed by this ETF's own standards, about as quiet as it gets. The path matters too: the gap was roughly 2.7 vol points on September 4, jumped past 10 by September 8, and has stayed there since. With no scheduled company event inflating it, that combination — IV rank 61 and a 97th-percentile premium over delivered movement — favors collecting premium over owning it this week.
Skew and sentiment
Puts and calls the same distance from the stock price don't cost the same here. The 25-delta put is marked at 28.5% implied vol against 24.3% for the 25-delta call — a 4.3 vol point premium for downside protection, against a 60-day median of negative 1.1 points. In other words, this name's normal state is calls being slightly richer than puts, and traders have flipped that by more than five points. The 7-day average skew is 2.1 points, so the steepening is recent and accelerating. Compared with XLE's own history, both the put-heavy volume mix and the steepness of that skew are unusually stretched — these are among the most extreme readings this ETF has printed lately.
Sentiment by expiration bucket leans the same way but not violently: options expiring within a week are mildly put-leaning, the one-to-four-week bucket somewhat more so, and the deepest put tilt sits in the 30-to-60-day bucket, isolated well below its neighbors. That's a localized cluster of downside positioning one to two months out — and it lines up exactly with the October 16 put building described above, rather than representing a broad bearish stance across the curve.
The key levels map
| Level | Price | Why it matters |
|---|---|---|
| Top of the implied range (Sept 21) | $67.91 | Upper rail of what options price by the target expiration |
| 52-week high | $66.17 | Friday's close sat 1.56% below it |
| Call wall — Sept 21 expiration | $66.00 | Heaviest call open interest for that expiry (only 40 contracts — this expiration is thin); chain-wide, $66 carries 34,534 calls and the fourth-largest gamma pile |
| Chart-model resistance | $65.55 | Upper Bollinger band and recent swing high in both technical reports |
| Friday's close | $65.14 | The anchor for every figure here |
| Max pain — Sept 21 | $65.00 | Where the most option value would expire worthless; also the single largest gamma strike chain-wide |
| Chart-model support | $64.75 / $64.60 | Invalidation levels for the near-term and Sept 21 technical models |
| Swing support (estimate) | $64.70 | Nearest heuristic swing-pivot cluster |
| 20-day moving average | $63.72 | Price sits 2.23% above it |
| Swing support (estimate) | $63.38 | Second pivot cluster below |
| Put wall — Sept 21 expiration | $63.00 | Heaviest put open interest (3,315), built almost entirely in the last session — our invalidation level |
| Bottom of the implied range (Sept 21) | $62.37 | Lower rail of the priced band |
| Swing support (estimate) | $61.70 | Early-September low |
| 50-day moving average | $60.14 | 8.32% below price |
| Gamma flip estimate | $45.50 | One rough chain-wide estimate of where hedging flips from dampening to amplifying — far below spot |
One caveat on the walls: the aggregate figures across the whole chain put the heaviest call strike at $60 (93,353 contracts) and the heaviest put strike at $55 (115,549) — legacy positioning stacked at round numbers far from today's price. For the week that matters, use the September 21 expiration's own walls: $66.00 above and $63.00 below.
Positioning and unusual flow
Market makers hedge the options they've sold, and the direction of that hedging depends on their net position. Scoped to the whole chain, one rough estimate has dealers net long gamma — the regime where hedging tends to dampen moves — with spot sitting roughly 30% above the estimated flip level, deep on the supportive side. Scoped to the September 21 expiration alone, the same estimate flips slightly negative, but the magnitude is tiny because that expiration holds very little open interest. Practically: the pinning influence in this name comes from the $65 and $66 strikes across all expirations, not from the September 21 series itself.
Three live flow items stood out on Friday. The October 16 $65 puts traded 4,290 contracts against 2,424 open — about $918,000 of premium, the heaviest dollar flow anywhere in the chain, and consistent with a month-out hedge being built at the money. The September 18 $63 puts traded 12,879 contracts against 5,680 open, roughly $316,000 of premium, more than two contracts traded for every one held open. And the September 14 $64 puts traded 12,597 contracts against just 293 open — a 43× turnover on a three-day option, which is short-dated insurance, not a position anyone intends to hold.
3 · Technical check
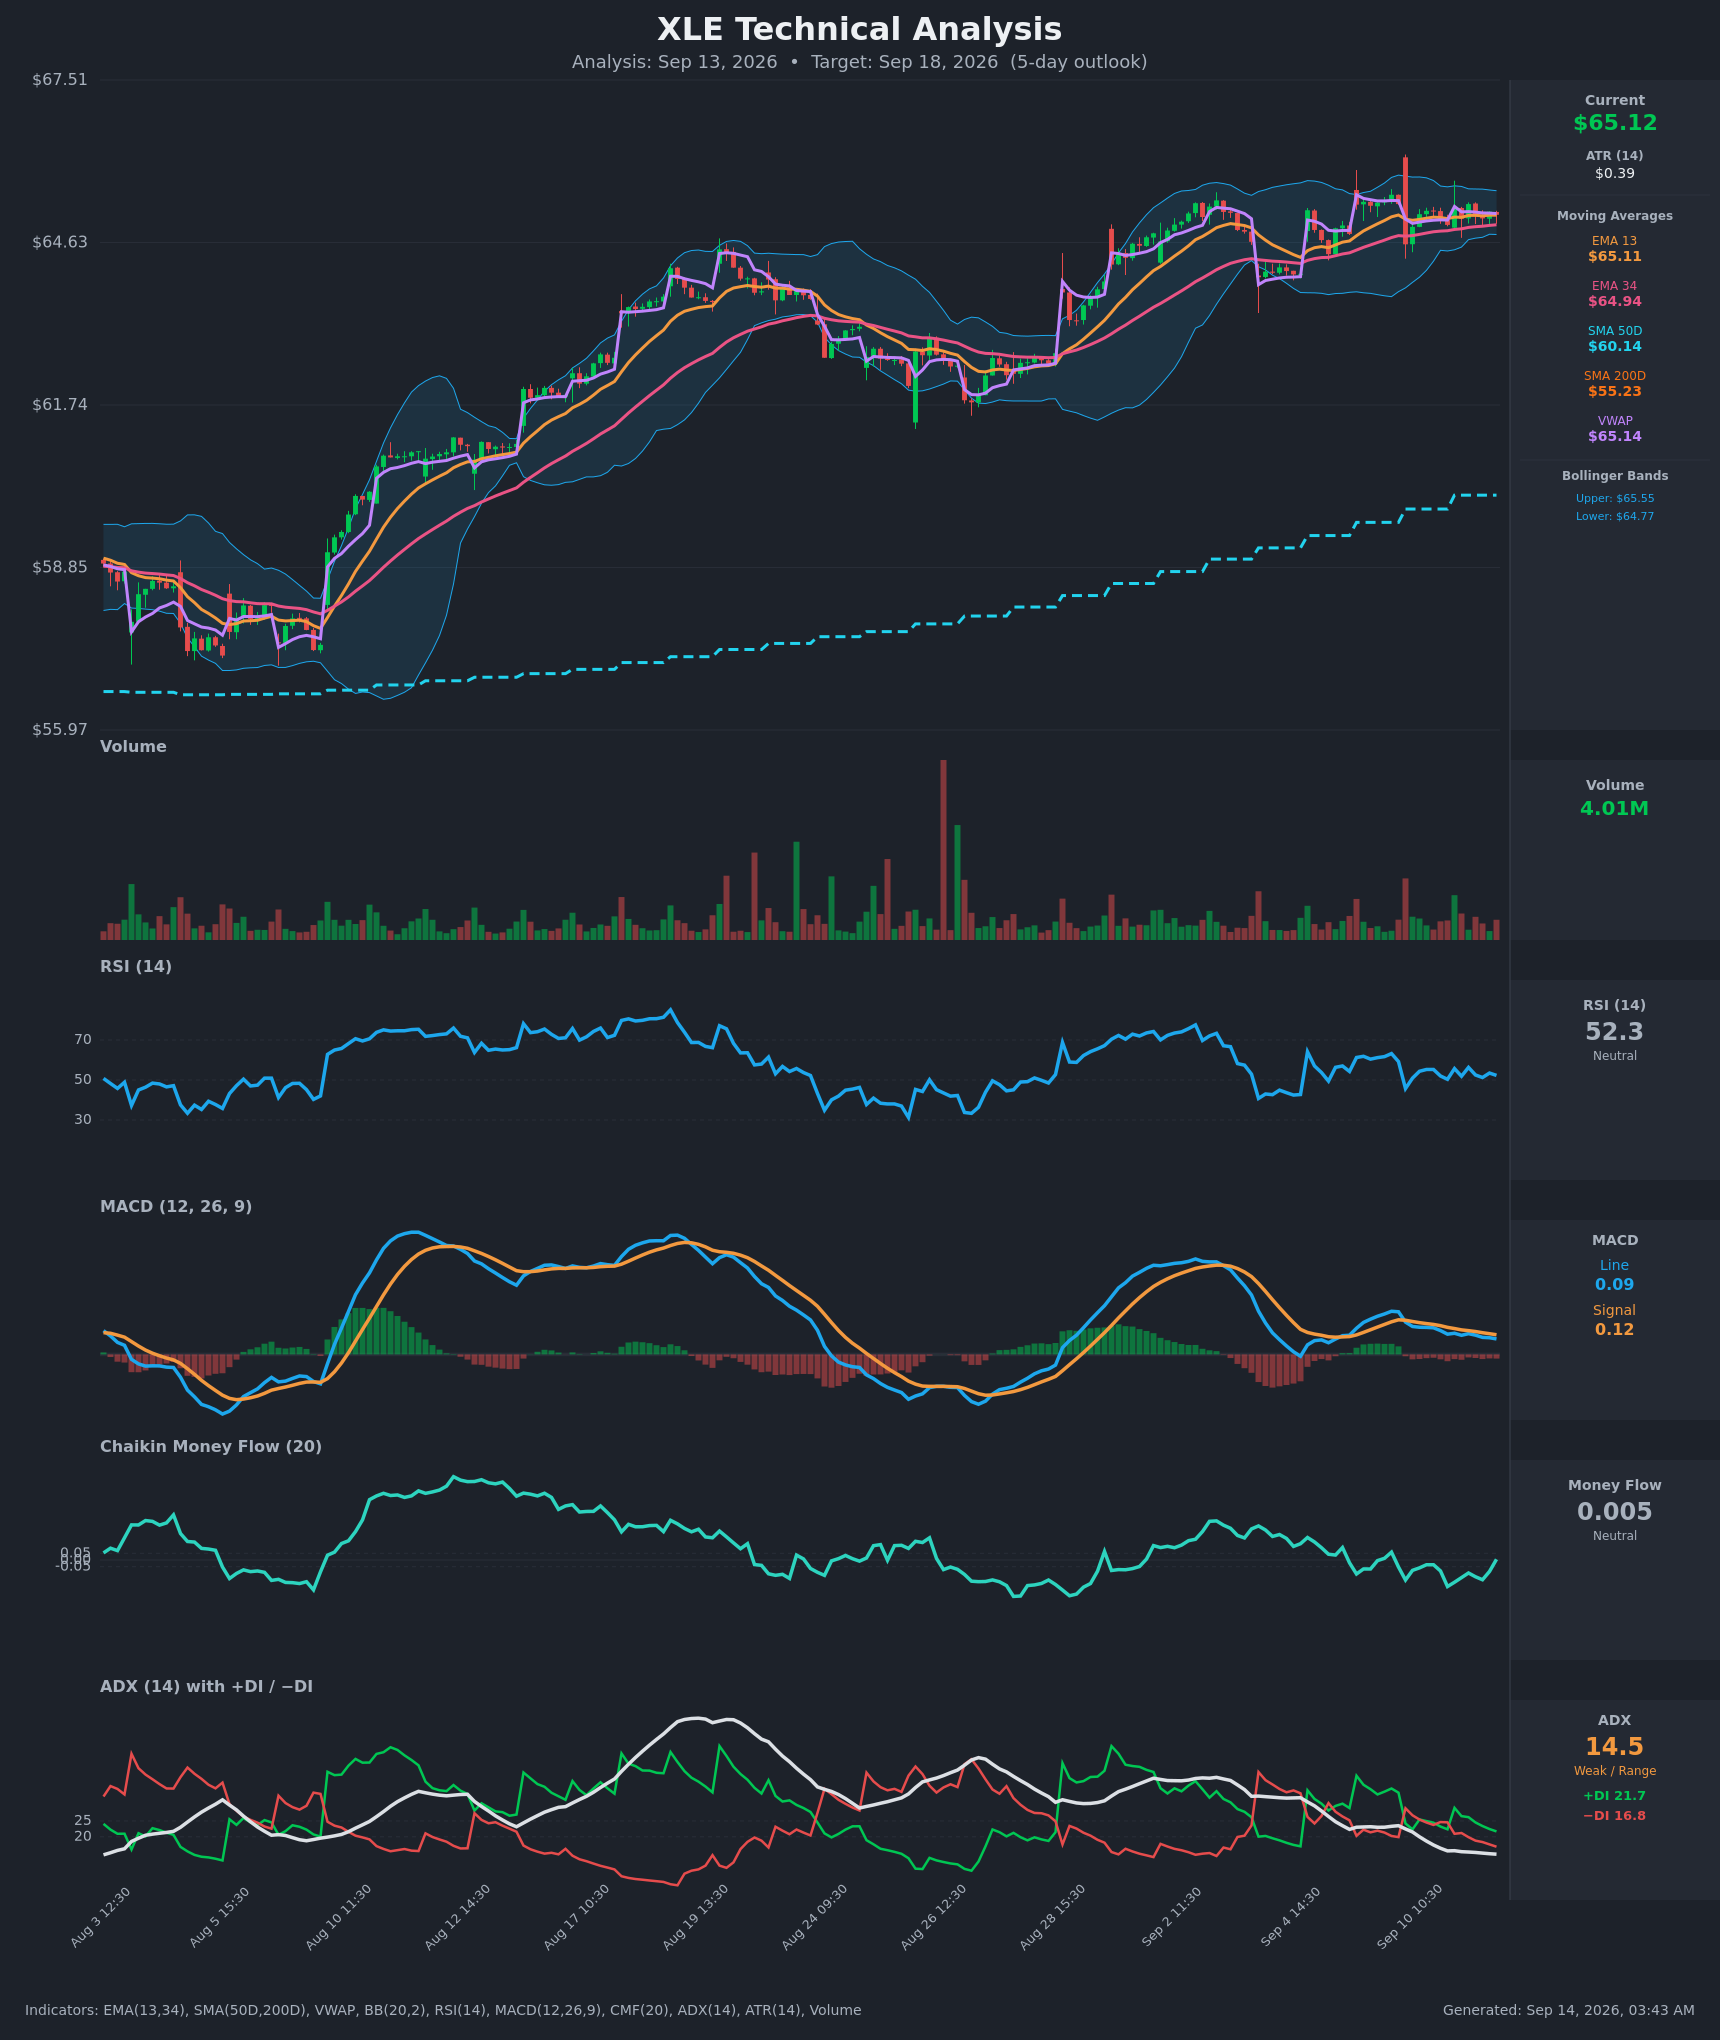
Both chart models read bullish, and both do it quietly. The near-term model (target date September 18) projects $65.40 with a range of $63.80 to $66.60; the September 21 model projects $65.60 with a range of $63.60 to $67.10. Both flag the same picture: RSI around 52 and cooling, MACD having just crossed below its signal line, ADX down to 14.5 from above 20 a week ago — a market that rallied hard from about $61.70 into early September and is now digesting it in a tight $64.77–$65.55 box above rising moving averages.
Classification: mixed, leaning confirm. Both technical targets sit comfortably inside the options-implied band, and both models' key support ($64.75 and $64.60) sits above the September 21 put wall at $63.00 — so the chart's failure point triggers well before ours does. The divergence worth naming is directional: the options chain's flow is put-heavy while the price structure is still stair-stepping higher. That is the whole argument for a neutral call rather than a bearish one, and it's why the structures below are built to profit from XLE staying inside a range instead of picking a side.
Model vs. Market: The options market implies $62.37–$67.91 into September 21; the September 21 technical model targets $65.60 within a tighter $63.60–$67.10. The chart model is pricing a narrower, mildly higher outcome than the options chain is charging for — which is the same message the volatility premium is sending from the other direction.
Full technical write-ups: near-term report → · September 21 report →
4 · Three ways the next seven days can go
If XLE pushes above the call wall ($66.00): the September 21 expiration's own call open interest there is thin, so it offers little resistance by itself — but the chain-wide $66 strike holds 34,534 calls and the 52-week high sits at $66.17 just above. Historically, the heaviest call open interest overhead tends to slow rallies as hedging flows lean against them; a clean break through $66.17 leaves thinner positioning until the top of the implied range at $67.91.
If XLE drifts between the walls: this is the base case the numbers point to. Max pain for September 21 is $65.00, fourteen cents below Friday's close, and $65 is also the single largest gamma strike in the entire chain. Expirations sometimes gravitate toward that level as expiring contracts are hedged out, and with realized movement running well under what's priced, drift beats thrust.
If XLE breaks below the put wall ($63.00): that wall was built in a single session, which cuts both ways — freshly bought protection can be a floor, but it's also the level where sellers would be forced to hedge if it gives. Below $63.00 the structural markers thin out quickly: the swing low at $61.70, then the 50-day average at $60.14. Note that the amplification case people worry about isn't in play here — spot sits far above the estimated gamma flip level of $45.50, so one rough estimate has dealer hedging still cushioning, not accelerating, a slide.
5 · Three defined-risk structures
Prices are end-of-day midpoints as of September 11, 2026. All structures are hypothetical. Verify live prices before trading — these will be stale by the open.
One execution warning that applies to all three: the September 21 series carries much less open interest than the September 18 monthly, and its quotes are correspondingly wide. Work limit orders toward the mid and do not chase.
If you expect the range to hold: September 21 iron condor
- Trade: Sell the Sept 21 $63/$62 put spread and the Sept 21 $67/$68 call spread (four legs, one contract each). A credit structure: you collect premium up front and keep it if XLE finishes between the short strikes.
- Credit: $0.37 · Max profit: $37 · Max loss: $63 · Break-evens: $62.63 and $67.37
- Why it fits: the short strikes bracket the expiration's own walls — $63.00 put wall below, $66.00 call wall and $66.17 52-week high between spot and the short call. And the premium is genuinely rich: options are priced about 10.6 vol points above what XLE has actually delivered, richer than roughly 97% of this ETF's own recent readings, with realized volatility unusually depressed. That is the textbook condition for selling a range.
- Makes sense only if: you accept that both short strikes sit inside the ±1σ implied band — you're explicitly betting realized movement comes in under what's priced, which is exactly what the past month has delivered.
- Invalidated if: XLE closes below $63.00 or above $66.17.
- Managing it: close at roughly 50% of max credit; exit the whole structure by September 18 regardless, rather than carrying thin-open-interest strikes into settlement; if either short strike is closed through, close the tested side instead of hoping for a snap-back.
- Liquidity note: the $63 puts were quoted 16¢ wide on a $0.40 mid and the $67 calls 11¢ wide on a $0.365 mid — that's 30–40% of mid, so slippage is the real cost here. For contrast, the September 18 $65 calls trade 24¢ wide with 47,582 contracts open; if you can't get filled near the mid, that expiration is the more forgiving venue.
- Analyze this position →
If you lean bullish: September 21 $64/$62 put credit spread
- Trade: Sell the Sept 21 $64 put, buy the Sept 21 $62 put. You collect a credit and keep it as long as XLE stays above $64 at expiration.
- Credit: $0.47 · Max profit: $47 · Max loss: $153 · Break-even: $63.53
- Why it fits: the short $64 strike carries about a one-in-three chance of finishing in the money by the chain's own delta, and the expiration's put wall at $63.00 sits between your short strike and your break-even. You're also selling the side of the chain that's been bid up — puts running 4.3 vol points over calls against a norm of calls being slightly richer means you're getting paid extra for the strike you're short.
- Makes sense only if: you read the put-heavy flow as hedging on top of a trend that's still up 6.7% over a month — if you read it as informed selling, don't take this side.
- Invalidated if: XLE closes below $63.00.
- Managing it: take profit at roughly 50% of the credit; the short-term trend read is flat even though the 20- and 50-day reads are up, which argues for banking gains early rather than holding for the last few cents. Exit by September 18 at the latest.
- Liquidity note: the $64 puts were quoted 18¢ wide on a $0.69 mid and the $62 puts 16¢ on a $0.22 mid — wide, with only 63 and 100 contracts open respectively. Assume you give up a few cents entering and a few more exiting.
- Analyze this position →
If you lean bearish: September 21 $66/$68 call credit spread
- Trade: Sell the Sept 21 $66 call, buy the Sept 21 $68 call. You collect a credit and keep it as long as XLE stays below $66.
- Credit: $0.45 · Max profit: $45 · Max loss: $155 · Break-even: $66.45
- Why it fits: the short strike sits exactly on the September 21 call wall and 17 cents under the 52-week high at $66.17, with the top of the implied band another $1.46 above your break-even. If the pin toward $65.00 max pain is the real story, this expires worthless.
- Makes sense only if: you think the 52-week high caps this move — the medium- and long-horizon trend reads are both pointing up, so this structure is fighting the bigger trend and deserves the smaller size of the three.
- Invalidated if: XLE closes above $66.17.
- Managing it: close at roughly 50% of credit; because the direction fights the longer trend, take profits earlier than you otherwise would and exit outright on any closing break of $66.17.
- Liquidity note: the $66 calls were quoted 18¢ wide on a $0.62 mid with just 40 contracts open, the $68 calls 9¢ wide on $0.175 — thin on both legs, so size small and use limits.
- Analyze this position →
If none of these: no trade
The premium here is genuinely rich — 97th percentile against this ETF's own recent readings — so standing aside means passing on the best-paid condition of the past quarter. The honest reason to do it anyway is execution. Every September 21 leg quoted 20–40% of its own mid in bid-ask width on Friday, and a $37 credit structure that leaks 10¢ getting in and another 10¢ getting out has surrendered more than half its edge before the market has moved a penny. If you can't get filled at or near the mid, the trade the spreadsheet likes isn't the trade you'd actually own. The alternative is to wait for the September 25 or October 16 series, where the same rich premium is available in strikes with thousands of contracts open and single-digit-percent spreads — the edge is the same, the friction is a fraction.
6 · Quick FAQ
What is XLE's expected move this week? About ±$2.77, or ±4.26%, into the September 21 expiration — a $62.37 to $67.91 range around Friday's $65.14 close, per the options market's straddle pricing as of September 11.
Is XLE expected to go up or down over the next week? Options positioning as of September 11 reads neutral. The raw flow is heavily put-tilted — 1.76 puts traded per call, with skew steepened more than five vol points versus its own norm — but that hedging is landing on top of a price structure still 6.7% higher over a month and 1.6% from its 52-week high, which reads as protection rather than conviction. Either way, that's a description of what traders have done, not a forecast. The actionable map is the $62.37–$67.91 range and the $63.00 / $66.00 levels.
Are XLE options expensive right now? Two lenses, same answer. IV rank 61/100 says option prices are higher than about 61% of the past year's readings. On top of that, they're running roughly 10.6 vol points above the movement XLE has actually delivered over the past 20 days — richer than about 97% of this ETF's own recent readings, partly because realized volatility has been unusually depressed. That combination favors selling premium over buying it, subject to the execution caveat above.
Where is XLE's biggest options support and resistance? For the September 21 expiration, the put wall is $63.00 (3,315 contracts) and the call wall is $66.00. Across the whole chain the heaviest strikes sit far from spot at $55 and $60 — legacy positioning, not this week's battleground.
What invalidates this week's read? A close below $63.00. That's the expiration's put wall and the level beneath which the freshly built downside positioning stops looking like a hedge.
Methodology & disclosures. Data: end-of-day options-chain snapshot for XLE, 2026-09-11, generated 2026-09-14 03:43 UTC. Prices shown are midpoints and will differ from live markets. Momentum/positioning scores and volatility-premium comparisons are descriptive measurements of past option flow and past price movement — not investment advice, signals, forecasts, or guarantees. All trade structures are hypothetical. Every structure shown has a defined maximum loss; you can lose the entire max-loss amount. Options involve substantial risk and are not suitable for all investors.