XLE Options Are Pricing a $2.40 Move Into September 25 — Positioning Says Range-Bound
The options market implies XLE trades between $61.91 and $66.71 through the September 25 expiration, with the heaviest call open interest at $66 and the heaviest put open interest at $62 bracketing the week and max pain sitting at $64. Here's what's driving the defensive skew, why the range case still leads, and three defined-risk ways to trade it.
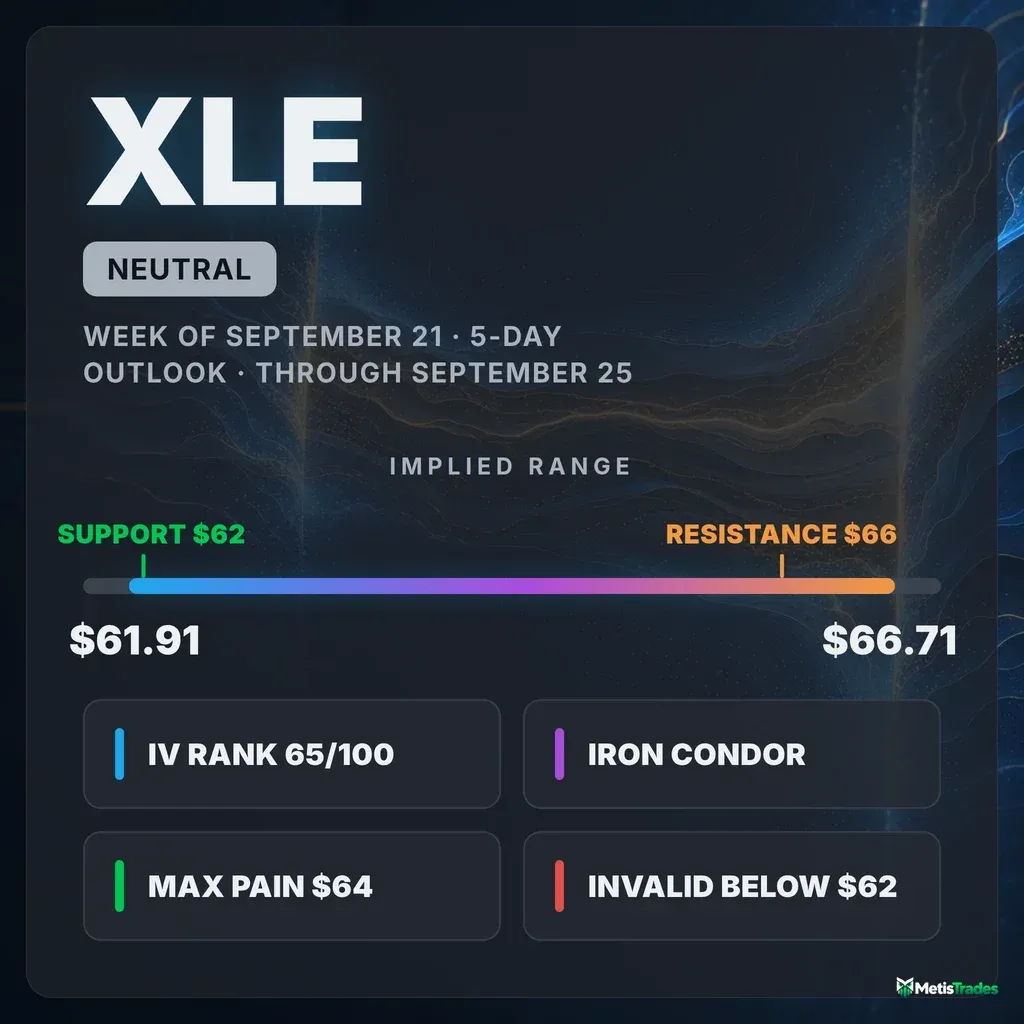
The options market implies a $61.91–$66.71 range into the September 25 expiration; here's what's driving it and three defined-risk ways to trade it.
Published Sunday, September 20, 2026 · Data as of Friday, September 18 close
Explore the live XLE options data in the Detailed Options Analyzer →
Quick answer
| Item | Answer |
|---|---|
| Market bias | Neutral |
| Options-implied range (into September 25) | $61.91 – $66.71 (±3.7%, about ±$2.40) |
| Major support | $62.00 (put wall, September 25 expiration) |
| Major resistance | $66.00 (call wall, September 25 expiration) |
| Max pain (September 25) | $64.00 |
| Dealer gamma regime (estimate) | Negative — market-maker hedging tends to amplify moves rather than cushion them; a flip level could not be computed from today's chain |
| Volatility condition | Rising — IV rank 65/100 · premium rich: options priced about 7.5 vol points above delivered movement |
| Technical check | Mixed (bullish, 3-day and 5-day chart models, both targeting inside the implied range) |
| Best-fitting strategy | Iron condor around the $62/$66 walls, if you accept the wide quoted markets |
| Analysis invalidated if | XLE closes below $62.00 |
1 · What matters today
XLE closed Friday, September 18 at $64.31, and the options market is pricing roughly a $2.40 move in either direction over the next five days — a $61.91 to $66.71 band into the September 25 expiration. That expiration's own positioning brackets the same zone: the heaviest pile of open call contracts sits at $66, the heaviest pile of open puts at $62, and max pain — the strike where the most option value would expire worthless — is $64.00, basically where the ETF already trades.
The flow underneath is defensive. Puts are running 13.3 volatility points richer than equidistant calls, against a recent norm where the two were roughly level — traders are paying up hard for downside protection. But that protection is being bought into a fund that is up 17% over the past two months and sits 2.8% below its 52-week high, which reads more like hedging an intact advance than conviction selling. Net: a range call, not a direction call. A close below $62 is what changes the picture.
2 · What the options market is pricing
What changed this week
Price went nowhere and volatility went up. XLE is down 1.27% over the trailing five sessions and up 0.88% over twenty, while at-the-money implied volatility — the market's estimate of how much XLE will move, baked into option prices — rose to 27.0%, up 3.2% on the day, 3.4% over five days and 6.7% over thirty. That puts today's reading above both its 30-day average (25.5%) and its 90-day average (26.2%). Rising IV into flat price is usually a hedging tell, not a momentum tell.
The clearest footprint of that hedging is in skew. The gap between 25-delta put and call implied vol jumped to 13.3 vol points from a trailing 7-day average of about 4.1 — a steepening of roughly 9 points in five sessions, and the most stretched reading this ETF has produced relative to its own recent history in some time. Put open interest across the chain outnumbers call open interest 1.34 to 1, in line with its 7-day average of 1.33 but up from 1.21 over fourteen days.
Yet Friday's actual volume told the opposite story: 0.45 puts traded for every call, against a 7-day average of 1.27 and a 60-day median of 0.78. That is an unusually call-tilted session for this name. The single biggest change in contracts held open was a reduction: the September 25 $62 puts shed 11,900 contracts, dropping from 19,875 to 7,975 — the put wall itself got lighter, not heavier. Further out, the October 16 $63 puts added 7,203 contracts to 46,847, and the October 16 $66 calls added 4,114.
The trend reads disagree across horizons, and that disagreement is the story of the week: the past five sessions lean lower, the past month is flat, and the past two months are up 17.3%. Near-term flow and the bigger trend are pointing in different directions, which is exactly the condition that produces chop rather than trend.
Expected move
The expected move is the move the options market is pricing in, derived from what straddles cost. Quote quality on most of the front-dated rungs was too poor to blend a clean at-the-money reading on Friday — the call and put sides disagreed by more than the parity check allows — so for September 25 we scale the chain's blended 27.0% at-the-money IV across the seven calendar days to that expiration. That gives ±3.7%, or about ±$2.40 around $64.31.
| Expiration | Implied move | Range around $64.31 |
|---|---|---|
| September 25 (7 days out) | ±3.7% | $61.91 – $66.71 |
| October 9 (21 days) | ±8.5% | $58.87 – $69.75 |
| October 30 (42 days) | ±9.1% | $58.49 – $70.13 |
Those rungs do not scale the way time alone would predict: stretching the front week's 3.7% across three times the days would imply roughly 6.4% at October 9, not 8.5%. The October tenors are carrying a fatter volatility read than the front week — one more sign that the demand in this chain is for protection further out, not for the next five sessions.
Volatility
At-the-money IV of 27.0% puts XLE's IV rank at 65/100 — today's reading sits about two-thirds of the way up its past-year range, and by the percentile measure it has been higher on only about a third of the past year's sessions. That rank has been creeping up: 61 on a 14-day average, 63 on seven days, 64 on three. The front-month read is unavailable today (September 18 was an expiry day, so the nearest-expiration IV can't be interpolated), which also leaves the comparison across expiration dates blank for this snapshot.
Worth noting the context: the broad market's volatility gauge sits near the very bottom of its own 52-week range while XLE's IV rank is 65. Whatever is bidding this chain's protection is sector-specific, not a market-wide fear trade. Realized movement, meanwhile, has been picking up — XLE's 5-day realized volatility is running about 1.5× its 20-day figure, an unusually fast acceleration compared against this ETF's own recent history.
Premium rich or cheap: the volatility risk premium — the gap between how much movement options are priced for and how much XLE has actually delivered — stands at about 7.5 vol points (27.0% implied against 19.4% realized over the past twenty days). That is richer than roughly 88% of this ETF's own recent readings. Over the past week the gap has eased from a peak near 11–12 points around September 8–14 without flipping sign; it is coming down from an extreme, not disappearing. That combination — IV rank 65 and an 88th-percentile premium over delivered movement — favors collecting premium rather than owning it this week, provided the structure is defined-risk and the short strikes respect the walls.
Skew and sentiment
Skew measures the fact that puts and calls the same distance from the stock price don't cost the same. Here the 25-delta put carries 39.7% implied vol against 26.5% for the equivalent call — a 13.3-point spread, versus a 60-day median of roughly negative 0.8 points. In plain terms: for the past three months these puts and calls were priced about level, and in the last week traders have been paying a steep premium to protect against a drop. That single reading is the most extreme positioning input in the file relative to this ETF's own norm.
Sentiment across expiration dates is genuinely split. Options expiring inside a week read mildly positive (+4 on a ±100 scale, up from a 7-day average of −2), the 7–30 day bucket reads −13, and the longest bucket — 60 to 120 days out — reads +55, driven by 25-delta risk reversals that are richer on the call side than usual. The summary phrase the model attaches is "bullish recovery": positioning is building further out while the middle of the curve stays defensive. Our leading read of positioning — flows, skew and term structure only, with price and IV trend deliberately excluded — is running moderately defensive, and has been all month.
The key levels map
| Level | Price | Why it matters |
|---|---|---|
| 52-week high | $66.17 | 2.8% overhead; the ceiling of the entire past year |
| Call wall (September 25) | $66.00 | 5,883 open call contracts — the biggest overhead pile for this expiration; also the top of the 5-day chart model's range |
| Chart-model resistance (5-day report) | $65.50 | Recent swing high / upper consolidation boundary |
| $65 strike | $65.00 | Second-heaviest gamma strike chain-wide; 1,723 calls open at this expiration |
| Swing resistance | $64.70 | Heuristic level from recent pivot clustering — an estimate, not a guaranteed reaction zone |
| Last close | $64.31 | Friday, September 18 close |
| 20-day moving average | $64.11 | Price sits 0.32% above it — flat, not trending |
| Max pain (September 25) | $64.00 | Where the most option value would expire worthless; expirations sometimes gravitate toward it |
| Chart-model support (both reports) | $63.80 | Both technical reports name this as the breakdown trigger |
| Swing support | $63.38 | Nearest heuristic support cluster below spot |
| $63 strike | $63.00 | Heaviest total gamma strike across the whole chain — a natural magnet |
| Put wall (September 25) | $62.00 | 7,975 open put contracts — the biggest downside pile for this expiration, though it shed 11,900 contracts on Friday |
| Swing support | $61.70 | Next structural shelf below the put wall |
| 50-day moving average | $61.18 | 5.1% below spot; the uptrend's last clean floor |
| Unfilled gap zone | $62.68 – $63.80 | From the August 31 gap up; unfilled since |
One caveat readers should hold onto: the whole chain's heaviest strikes are not the week's. Aggregated across every expiration, the biggest call pile sits at $60 (96,967 contracts) and the biggest put pile at $55 (132,140) — large, mostly far-dated or legacy positions that say nothing about the next five sessions. For this window, use the September 25 expiration's own walls at $66 and $62.
Positioning and unusual flow
The dealer gamma estimate for the September 25 expiration is negative, matching the all-expiration estimate. Under the standard (and unverified) assumption that market makers are long calls and short puts, that regime means their hedging tends to amplify moves rather than dampen them once price gets going — treat this as an estimate built from raw gamma and open interest, not as observed dealer inventory.
Three non-expired flow items stood out on Friday. The September 25 $60.50 puts traded 7,027 contracts against just 319 held open — roughly 22 times turnover and about $1.7 million of premium in cheap, well-below-the-wall insurance. The September 21 $65 calls traded 6,027 contracts against 415 open at an 8-cent mid — short-dated lottery tickets rather than a positioning statement. And the October 16 $65 calls saw 9,284 contracts and $1.26 million of premium, the largest genuinely at-the-money call print in the book. The single biggest premium print of the day, $12.2 million in deep in-the-money September 30 $60 calls, is the kind of trade that usually reflects position management rather than a fresh directional bet.
3 · Technical check
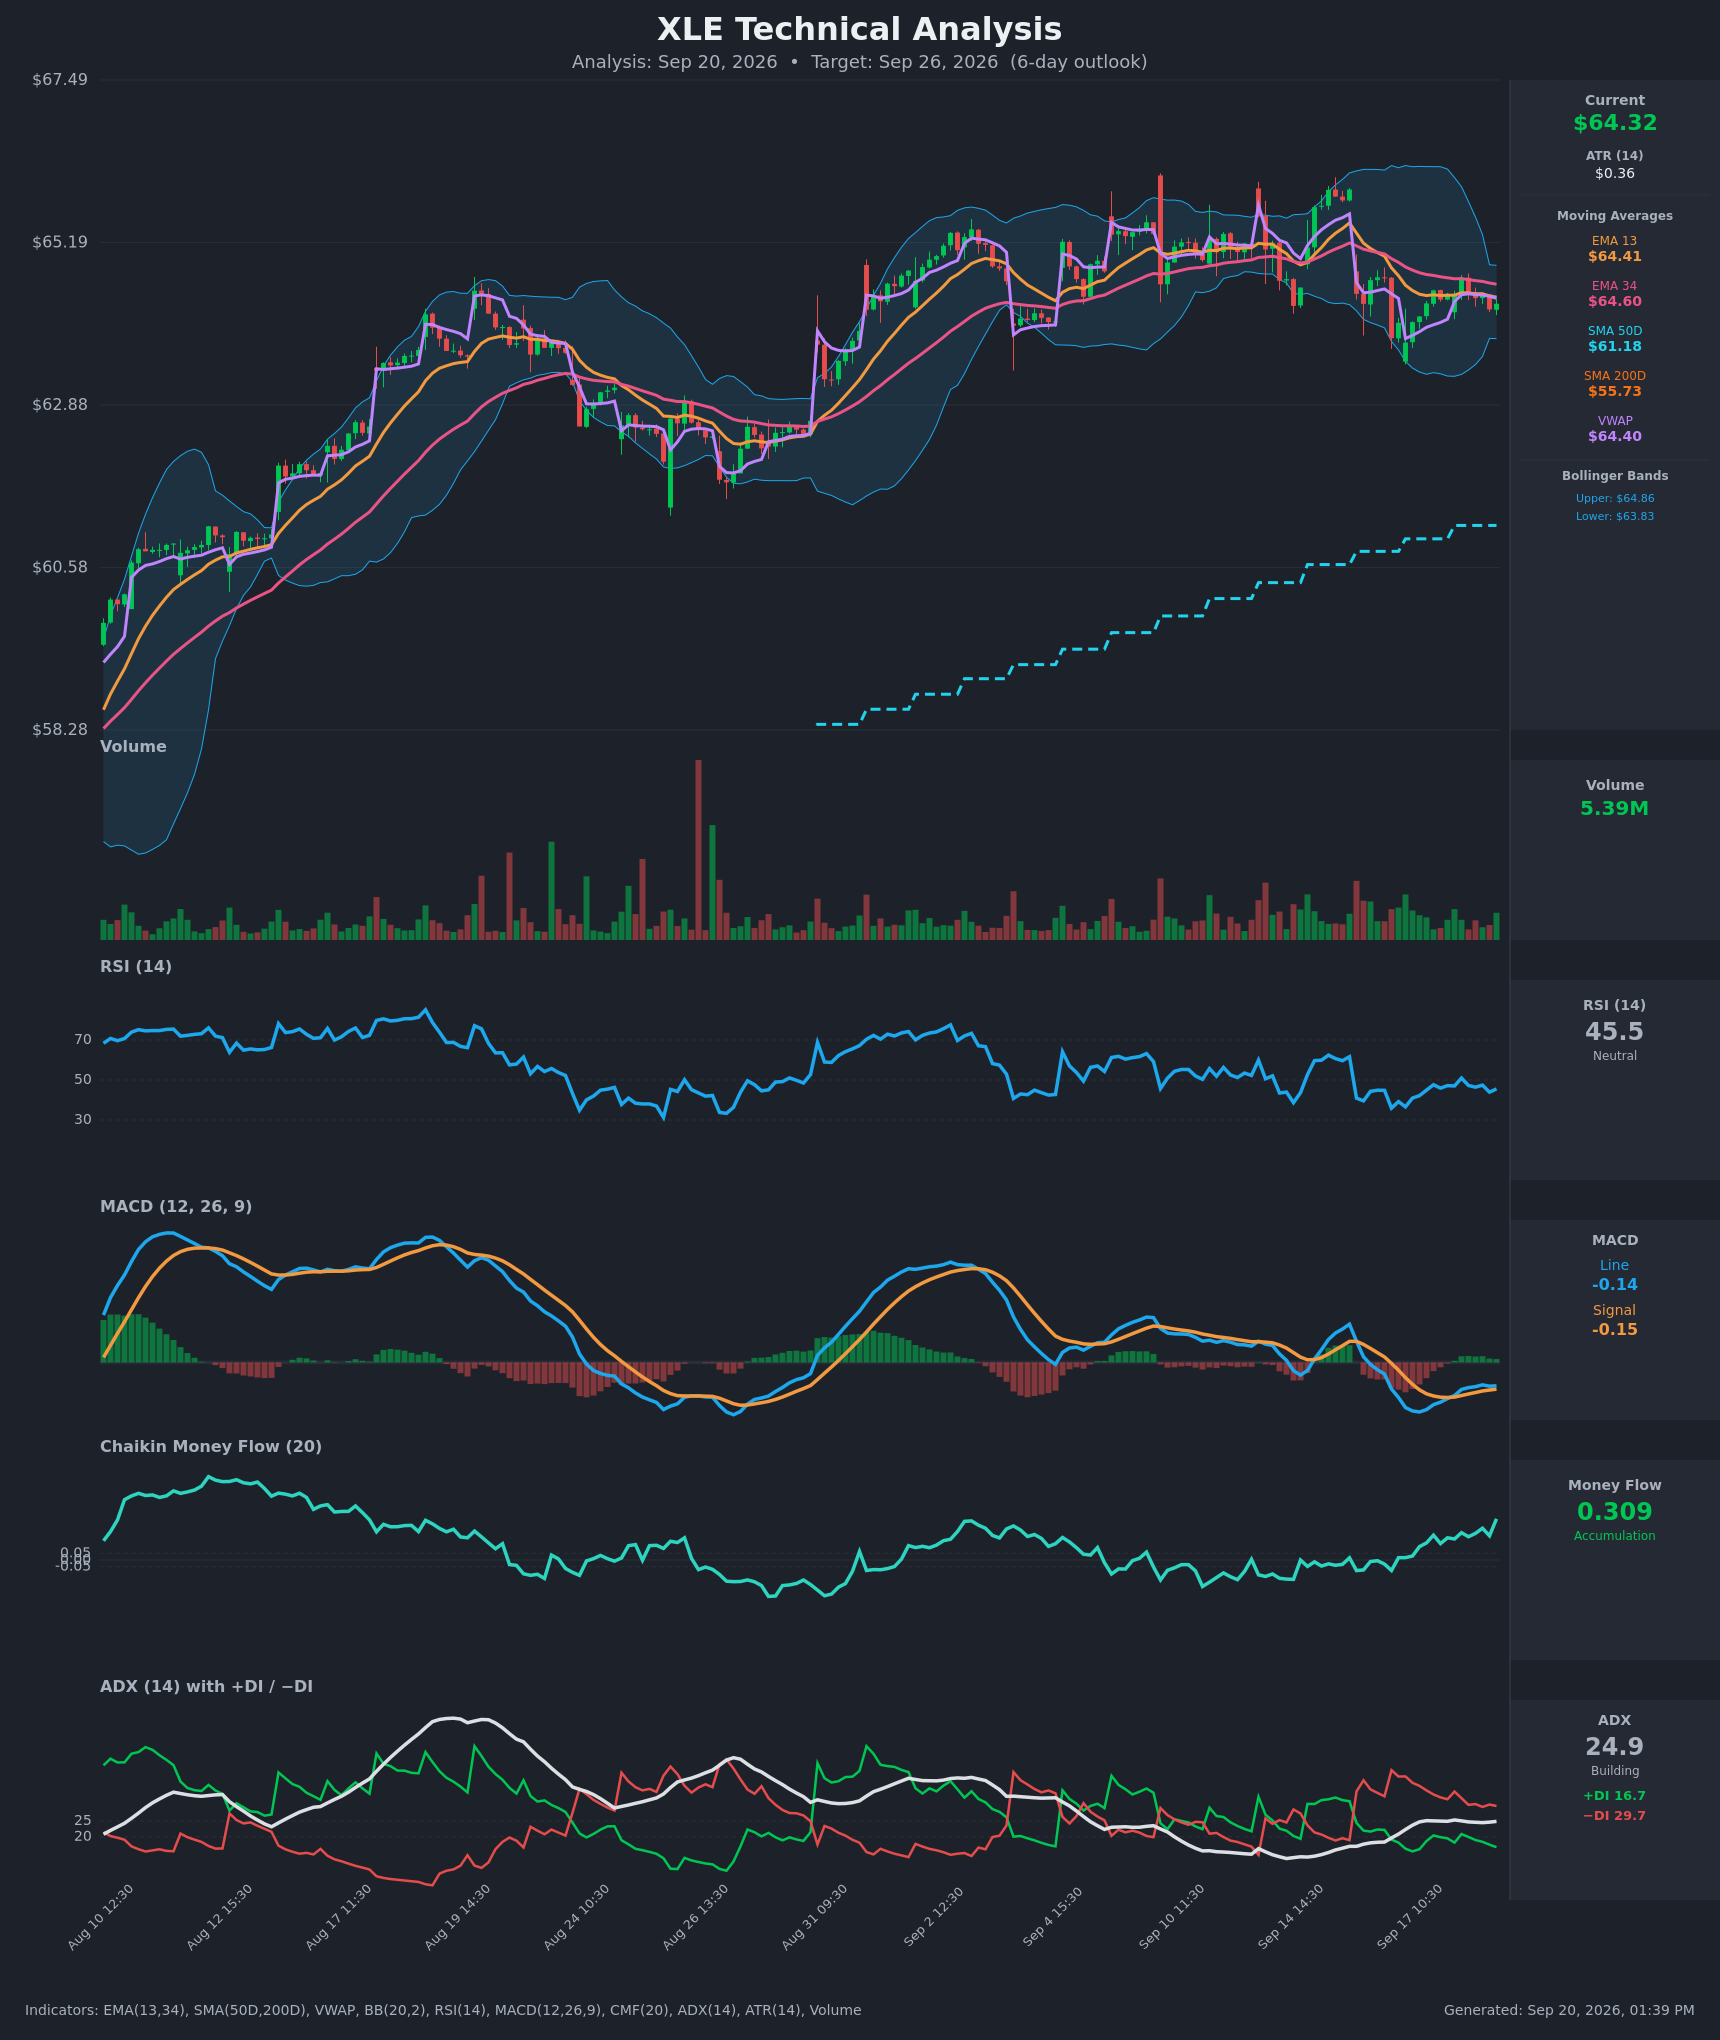
Both chart models lean bullish, and both do it with the same evidence: Chaikin Money Flow at 0.309 (strong accumulation) diverging from flat price, and a fresh MACD crossover off the September 17 low — set against price still trading below its short-term EMAs ($64.41 and $64.60) with −DI above +DI and ADX at 24.9. In other words: buying pressure underneath, no confirmed trend either way.
The 3-day model targets $64.85 by September 23 with a projected range of $63.30 to $65.70. The 5-day model targets $65.10 by September 25 with a projected range of $62.80 to $66.00. Both put their support trigger at $63.80 and their upside trigger near $64.90. Classification: mixed. The direction is bullish where our options read is neutral, but both targets land inside the options-implied band, and the 5-day model's ceiling lands exactly on the $66.00 call wall — the chart and the chain agree on where the lid is.
Model vs. Market: The options market implies $61.91–$66.71 into September 25; the 5-day technical model targets $65.10 inside a $62.80–$66.00 band. The chart model is pricing a narrower week than the options are, and its bullish target sits comfortably short of the call wall — which is why we shade the condor's call side to $66 rather than lower, and leave the put side at the wall.
Full technical write-ups: 3-day report → · 5-day report →
4 · Three ways the next five days can go
If XLE pushes above the call wall ($66.00): the heaviest overhead call open interest for this expiration tends to slow rallies as market makers hedge against it, and $66 sits just under the 52-week high at $66.17. A clean close through both leaves comparatively thin positioning until the $67 strike, where 3,477 calls are open at this expiration — but that is the zone where a defensively positioned chain would have to chase.
If XLE drifts between the walls: this is the base case the structure supports. Max pain for September 25 sits at $64.00, 31 cents below Friday's close, with the chain's single heaviest gamma strike at $63 just underneath. Expiring open interest and hedging flows tend to pull price toward that zone as the days run off, and the 20-day moving average at $64.11 sits in the same pocket.
If XLE breaks below the put wall ($62.00): this is the acceleration case, and it is the one that matters most because of the negative gamma estimate — in this regime, hedging tends to add to selling rather than cushion it. The put wall lost 11,900 contracts on Friday, so the floor there is thinner than it was a week ago. Below $62, the next structure is the $61.70 swing shelf and then the 50-day average at $61.18. A daily close through $62 is the level that invalidates the range read.
5 · Three defined-risk structures
Prices are end-of-day midpoints as of 2026-09-18. All structures are hypothetical. Verify live prices before trading — these will be stale by the open.
A blanket liquidity warning for this chain: Friday was an expiry session and the closing quotes on September 25 contracts are wide — several are quoted 40% or more of their mid. Every structure below should be worked as a limit order at or inside the mid, never at market. The dollar spreads are small in absolute terms; the percentage slippage is not.
If you expect the range to hold: iron condor around the walls
- Trade: Sell the September 25 $62/$60 put spread and the $66/$68 call spread (four legs, one condor)
- Credit: ~$0.43 · Max profit: $43 · Max loss: $157 · Break-evens: $61.57 and $66.43
- Why it fits: both short strikes sit exactly on the September 25 expiration's own walls, max pain at $64.00 is 31 cents from spot, and premium is rich — options are priced about 7.5 vol points above what XLE has actually delivered, richer than roughly 88% of this ETF's recent readings. You collect that richness with defined risk on both sides.
- Makes sense only if: you accept that both short strikes sit slightly inside the ±$2.40 implied move, so a normal-sized week can touch either one. This is a premium-collection trade, not a no-touch bet.
- Invalidated if: XLE closes below $62.00 or above $66.00
- Managing it: close at ~50% of max credit; check the position at the September 23 midpoint and exit the tested side if either short strike has been breached. With the gamma regime estimated negative, do not hold a short strike in the money into the final session hoping for a pin.
- Liquidity note: the $62 puts closed $0.16 bid / $0.30 ask (14¢ wide on a 23¢ mid) and the $66 calls $0.16 / $0.55. Wide in percentage terms — leg in with limits or skip it.
- Analyze this position →
If you lean bullish: short put spread
- Trade: Sell the September 25 $63/$61 put credit spread (you collect premium up front and keep it if XLE stays above $63)
- Credit: ~$0.52 · Max profit: $52 · Max loss: $148 · Break-even: $62.48
- Why it fits: the short strike sits at the $63 gamma magnet and just above the $63.38 swing shelf, with the $62 put wall a dollar below as a second backstop; the break-even at $62.48 is above the wall entirely. Skew richness means you are selling the side of the chain traders are paying up for.
- Makes sense only if: you read the steep put demand as hedging into an uptrend rather than conviction selling — XLE is up 17.3% over two months and above every major moving average.
- Invalidated if: XLE closes below $62.00
- Managing it: take profit at ~50% of the credit; with the short-term trend leaning against the long-term trend, don't hold for the last few cents — close by September 24 regardless. If XLE closes through $63, close rather than hope.
- Liquidity note: the $63 puts closed $0.40 / $0.91 and the $61 puts $0.05 / $0.21 — both markets are wide enough that a market order would eat most of the edge.
- Analyze this position →
If you lean bearish: short call spread at the wall
- Trade: Sell the September 25 $66/$68 call credit spread
- Credit: ~$0.32 · Max profit: $32 · Max loss: $168 · Break-even: $66.32
- Why it fits: the short strike sits on the call wall, immediately under the 52-week high at $66.17 and at the exact top of the 5-day chart model's projected range — three independent reasons the week's upside is capped there. Rich implied volatility improves the credit.
- Makes sense only if: you think the defensive skew and the negative five-day price drift matter more than the intact two-month uptrend. The risk/reward here is the least attractive of the three — you are selling into the side the chart models favor.
- Invalidated if: XLE closes above $66.00
- Managing it: close at ~50% of max credit or on any daily close above $66.00, whichever comes first; a break of the 52-week high with negative gamma overhead is exactly the setup that runs.
- Liquidity note: the $66 calls closed $0.16 / $0.55 and the $68 calls $0.01 / $0.07 — the long wing is nearly free but also nearly untradeable at the mid; price the spread as a package.
- Analyze this position →
If none of these: no trade
There is a real case for standing aside even with premium this rich. The quoted markets on September 25 contracts are wide enough that a careless fill can cost a third of the expected credit before the position has done anything — and on an iron condor collecting $43 against $157 of risk, two bad fills turn a decent trade into a bad one. The second reason is structural: the gamma regime estimate for this expiration is negative, meaning hedging flows tend to extend moves rather than pin them, which is the least friendly environment for a short-premium position with both shorts sitting inside the implied move. If you can't work limit orders patiently during the session, the honest answer this week is to let the rich premium go and wait for either a test of $62 or a break of $66 to give you a direction worth paying for.
6 · Quick FAQ
What is XLE's expected move this week? About ±$2.40, or ±3.7%, into the September 25 expiration — a $61.91 to $66.71 band around Friday's $64.31 close, derived from the chain's 27.0% at-the-money implied volatility as of September 18.
Is XLE expected to go up or down over the next five days? Options positioning as of September 18 is genuinely two-sided — steep put demand and a negative five-day drift on one side, an intact two-month uptrend and long-dated call-side positioning on the other — but that is a read of what traders have done, not a forecast. The actionable map is the $61.91–$66.71 range and the $62.00 / $66.00 levels.
Are XLE options expensive right now? IV rank 65/100 says option prices sit about two-thirds of the way up their past-year range; on top of that, they're running about 7.5 vol points above the movement XLE has actually delivered over the past twenty days — richer than roughly 88% of this ETF's own recent readings. The verdict favors collecting premium over owning it, with defined risk.
Where is XLE's biggest options support and resistance? For the September 25 expiration, the put wall is $62.00 (7,975 contracts open) and the call wall is $66.00 (5,883 contracts). Across the entire chain the heaviest strikes are different — $55 puts and $60 calls — but those are far-dated positions and not this week's map.
What invalidates this week's read? A close below $62.00. Below the put wall, with dealer hedging estimated to be in the amplifying regime, the range case stops being the base case.
Methodology & disclosures. Data: end-of-day options-chain snapshot for XLE, 2026-09-18, generated 2026-09-20T13:39:29.693Z. Prices shown are midpoints and will differ from live markets. Momentum/positioning scores and volatility-premium comparisons are descriptive measurements of past option flow and past price movement — not investment advice, signals, forecasts, or guarantees. All trade structures are hypothetical. Every structure shown has a defined maximum loss; you can lose the entire max-loss amount. Options involve substantial risk and are not suitable for all investors.