XLF Options Are Pricing a $1.46 Move Into September 22 — The Chart Model Leans the Other Way
Friday's XLF chain was a put-side deluge: 17.6 puts traded for every call, and 25-delta skew steepened to four times its own norm. The options market implies $55.79–$58.71 into September 22, with the September 21 expiration's walls and max pain all stacked at $57.

The options market implies a $55.79–$58.71 range into the September 22 expiration; here's what's driving the put-side deluge and three defined-risk ways to trade it.
Published Sunday, September 13, 2026 · Data as of Friday, September 11 close
Explore the live XLF options data in the Detailed Options Analyzer →
Quick answer
| Item | Answer |
|---|---|
| Market bias | Slightly bearish |
| Options-implied range (into September 22) | $55.79 – $58.71 (±$1.46, ±2.55%) |
| Major support | $57.00 — the September 21 expiration's put wall (next structural shelf $56.65) |
| Major resistance | $57.00 — the September 21 expiration's call wall (the whole chain's heaviest call strike sits lower, at $55.00) |
| Max pain (September 21) | $57.00 |
| Dealer gamma regime (estimate) | Negative — in this regime market-maker hedging tends to amplify moves rather than cushion them; no flip level was computable today |
| Volatility condition | Falling — IV rank 14/100 · premium thin: options are priced about 1.6 vol points above what XLF has actually delivered |
| Technical check | Diverges (bullish, 4-day and 7-day chart models) |
| Best-fitting strategy | September 21 $57.50/$56.50 put debit spread |
| Analysis invalidated if | XLF closes above $58.00 |
1 · What matters today
XLF closed Friday, September 11 at $57.25, down 2.24% over five sessions. What makes the session interesting isn't the price — it's the flow. Traders moved 462,809 put contracts against just 26,309 calls, a put/call volume ratio of 17.59 when the 60-day norm for this fund is about 1.05. Total option volume ran 4.85 times its 20-day average. Our read of that flow, which blends positioning, momentum, sentiment across expiration dates and skew, lands slightly bearish.
The map is tight. Options price a $55.79–$58.71 band into the September 22 expiration, and the September 21 expiration — the one this outlook is built around — has its call wall, its put wall and its max pain all sitting at the same $57.00 strike. A close above $58.00 breaks the read. One honest caveat up front: both chart models we track point the other way, and we'll show you that gap side by side.
2 · What the options market is pricing
What changed over the past week
Money moved to the downside, and quickly. The put/call open-interest ratio — for every call contract held open, how many puts — sits at 1.67, barely changed from 1.65 five sessions ago but well above its 14-day average of 1.45. The louder signal is volume: that 17.59 put/call volume ratio compares with a 7-day average of 3.45 and a 14-day average of 2.23. A single print did much of the work — 186,512 October 16 $56 puts changed hands against 16,029 contracts already open, roughly $17.3 million of premium in one strike.
Implied volatility — the market's estimate of how much XLF will move, baked into option prices — tells a milder story. At-the-money IV finished at 14.72%, down 11.9% on the day but still up 7.4% over five sessions, and it sits under both its 30-day average (15.09%) and its 90-day average (16.68%). The largest genuine build in contracts currently held open was far-dated: the November 20 $50 put added 8,056 contracts to 27,792, with the November 20 $54 put adding 4,514 — long-dated downside insurance, not a tactical bet on this week.
Our momentum read on option flow turned negative on September 4 and has deepened since, printing −40 against a 7-day average of −23 and a 14-day average of −4: flow has gone sharply put-heavy over the last three sessions after two fairly neutral weeks. That short-term turn sits inside a bigger picture that hasn't broken — XLF is still up 4.5% over the past fifty sessions and 6.8% above its 200-day moving average, so this is a one-week impulse against an intact longer trend, which argues for short-dated structures and quick profit-taking rather than committing to a directional hold.
Expected move
Into the September 22 expiration, the options market prices a move of roughly ±$1.46, or ±2.55% — that's the move derived from what straddles cost, the market's own one-standard-deviation estimate. Around Friday's $57.25 close that maps to $55.79 to $58.71.
| Expiration | Implied move | Range around $57.25 |
|---|---|---|
| September 18 | ±1.86% | $56.19 – $58.32 |
| September 22 | ±2.55% | $55.79 – $58.71 |
| September 30 | ±2.95% | $55.56 – $58.94 |
| October 23 | ±4.96% | $54.41 – $60.09 |
The rungs step up smoothly with time, with no bulge at any single date — nothing in the chain is bracing for a specific event. The September 21 expiration itself couldn't be priced cleanly: its call-side and put-side at-the-money volatilities disagreed too much for a reliable read, so the headline range above uses the September 22 rung one day later, which is the closest clean quote to our target date.
Volatility
At-the-money IV is 14.72% with an IV rank of 14/100 — today's volatility is cheaper than 86% of the past year's readings, and only 11.9% of the past year's sessions closed with IV below this level. Volatility fell 11.9% on Friday alone even as the put flow surged, which is itself a tell: this was hedging into a quiet tape, not a panic bid. The front-month read is unavailable today (Friday was an expiry day, so a front-month volatility cannot be interpolated from a contract expiring the same session). For context, the broad volatility index sits at rank 13/100 of its own 52-week range, and it has moved loosely with XLF's implied volatility over the past sixty sessions — the calm is market-wide, not fund-specific.
Compared against XLF's own recent history, realized movement is unremarkable: 20-day realized volatility of 13.12% is about typical for this fund, and the ratio of the last week's movement to the last month's sits just under 1, meaning the tape has been marginally calmer lately, not wilder.
Premium rich or cheap? The volatility risk premium — the gap between how much movement options are priced for and how much XLF has actually delivered — is about 1.6 vol points (14.7% implied against 13.1% delivered). Positive means option sellers have been collecting more than realized movement cost them, but the size matters: that gap sits at the 17th percentile of this fund's own recent readings, meaning it's been richer than today on roughly 83% of recent sessions. The path is worth a note — the gap was 3.7 points on September 10 and collapsed to 1.6 on Friday as implied volatility dropped while realized movement held. That combination — IV rank 14 and a 17th-percentile premium over delivered movement — favors owning premium this week rather than collecting it.
Skew and sentiment
Skew is where the bearish tilt is loudest. Puts and calls the same distance from the stock price don't cost the same, and right now 25-delta puts are running 4.4 vol points over the equivalent calls, against a 60-day median of 1.1 for this fund — the 25-delta put prices at 17.14% volatility versus 12.73% on the call side. Traders are paying up for downside protection at four times the usual rate, and the steepening was fast: that gap widened 3.8 vol points over five sessions, and the 14-day average skew is just 0.19 vol points. Measured against its own history, this is an unusually stretched reading for XLF, as is Friday's put-tilted volume, which is about as far from this fund's norm as the data goes.
Sentiment across expiration dates is split, and the split matters for our window. The very front of the curve (0–7 days) reads mildly positive at +20, helped by call-side risk pricing, while the 7–30 day bucket — the one that contains our September 21 expiration — reads −26, dragged there by delta-weighted volume that is overwhelmingly put-side. Further out, the 60–120 day bucket reads +35. So the chain is hedging the next month while still positioned constructively for the quarter.
The key levels map
| Level | Price | Why it matters |
|---|---|---|
| 52-week high | $58.60 | Only 2.3% above Friday's close; XLF sits in the 88th percentile of its own one-year range |
| Swing resistance | $58.43 | Nearest clustered pivot high from recent price structure |
| Top of the Sept 18 expected-move band | $58.32 | The upper rail options are pricing for the coming Friday |
| Largest gamma strike (whole chain) | $58.00 | The heaviest concentration of option gamma across all expirations — also the technical model's resistance and our invalidation level |
| 20-day moving average | $57.70 | Price is 0.78% below it — the short-term trend line XLF lost this week |
| Swing resistance | $57.36 | The first real overhead shelf, roughly a dime above spot |
| Spot (Friday close) | $57.25 | Reference for every figure above and below |
| 50-day moving average | $57.11 | Price is 0.24% above it — the line the bounce is defending |
| Sept 21 call wall, put wall and max pain | $57.00 | All three coincide at one strike for the target expiration; also the second-largest gamma strike chain-wide |
| Swing support | $56.65 | The first structural floor below spot; both chart models cite $56.70 as their support zone |
| Bottom of the Sept 18 expected-move band | $56.19 | Lower rail for the coming Friday |
| Bottom of the Sept 22 implied range | $55.79 | The downside edge of this article's headline band |
| Heaviest call strike, whole chain | $55.00 | 142,368 contracts — deep in the money and concentrated in the September 18 expiration, so it acts as ballast, not a ceiling |
| Heaviest put strike, whole chain | $48.00 | 228,262 contracts of far-out-of-the-money September 18 protection — a tail hedge, not a live magnet |
One caveat on the walls: the September 21 expiration is thin. Its call wall carries 350 contracts and its put wall 633 — they mark where positioning sits, not a barrier with real hedging weight behind it. The heavy open interest lives at the September 18 expiration three days earlier, whose own call wall is $55.00 and whose max pain is $55.00 — a very different picture from the aggregate, and worth watching as that expiration settles.
Positioning and unusual flow
One rough estimate of dealer positioning — built on the common assumption that market makers are long calls and short puts — puts the whole chain in negative gamma, the regime where hedging tends to amplify moves rather than dampen them. Almost all of that estimated exposure sits at the September 18 expiration; the September 21 expiration's own estimate is negative but essentially negligible, because so few contracts are open there. No gamma flip level could be computed today, so treat the regime as directional color rather than a tripwire with a price attached.
Three flow items stood out, and all three were on the put side:
- October 16 $56 put — 186,512 contracts traded against 16,029 held open, 11.6 times the existing position and roughly $17.3 million of premium. That's a fund-sized hedge being put on a month out, below the current price.
- September 18 $58 put — 108,921 contracts traded against 104,709 open, about $8.4 million of premium. A strike that is already in the money, traded heavily into a Friday expiration: this looks like rolling or closing as much as new risk.
- September 18 $56 put — 75,654 traded against 95,527 open, about $794,000 of premium, concentrated right at the lower expected-move rail.
3 · Technical check
Both chart models disagree with the options read, and they do it politely. The 4-day model is bullish, targeting $57.65 by September 18 within a projected $56.10–$58.60 band; the 7-day model is bullish too, targeting $57.75 by September 21 within a projected $56.30–$59.20. Their reasoning is momentum-mechanical: MACD has just crossed above its signal line, RSI has recovered from about 28 on September 10 to roughly 50, and the directional indicators flipped to favor buyers on September 11 while trend strength cools from its highs. Both flag the same caution we see in the flow — money-flow readings remain in distribution territory even as price bounced, which they read as short-covering rather than fresh buying.
Classification: Diverges. The direction contradicts the options positioning read, even though both targets sit comfortably inside the options-implied band. Both models name $56.70 as support and $58.00–$58.20 as resistance, and the dominant bullish scenario in the 7-day report is invalidated on a close back below $56.70 — a level that sits just under our own $56.65 structural shelf, so the two frameworks agree precisely on where the floor is and disagree only on which way price leaves it.
Model vs. Market: The options market implies $55.79–$58.71 into September 22; the 7-day technical model targets $57.75. The gap isn't magnitude — it's sign. Flow is paying up for protection while price structure is turning up off an oversold low, and the question resolves on whether XLF can reclaim $57.70 (its 20-day line) and press $58.00.
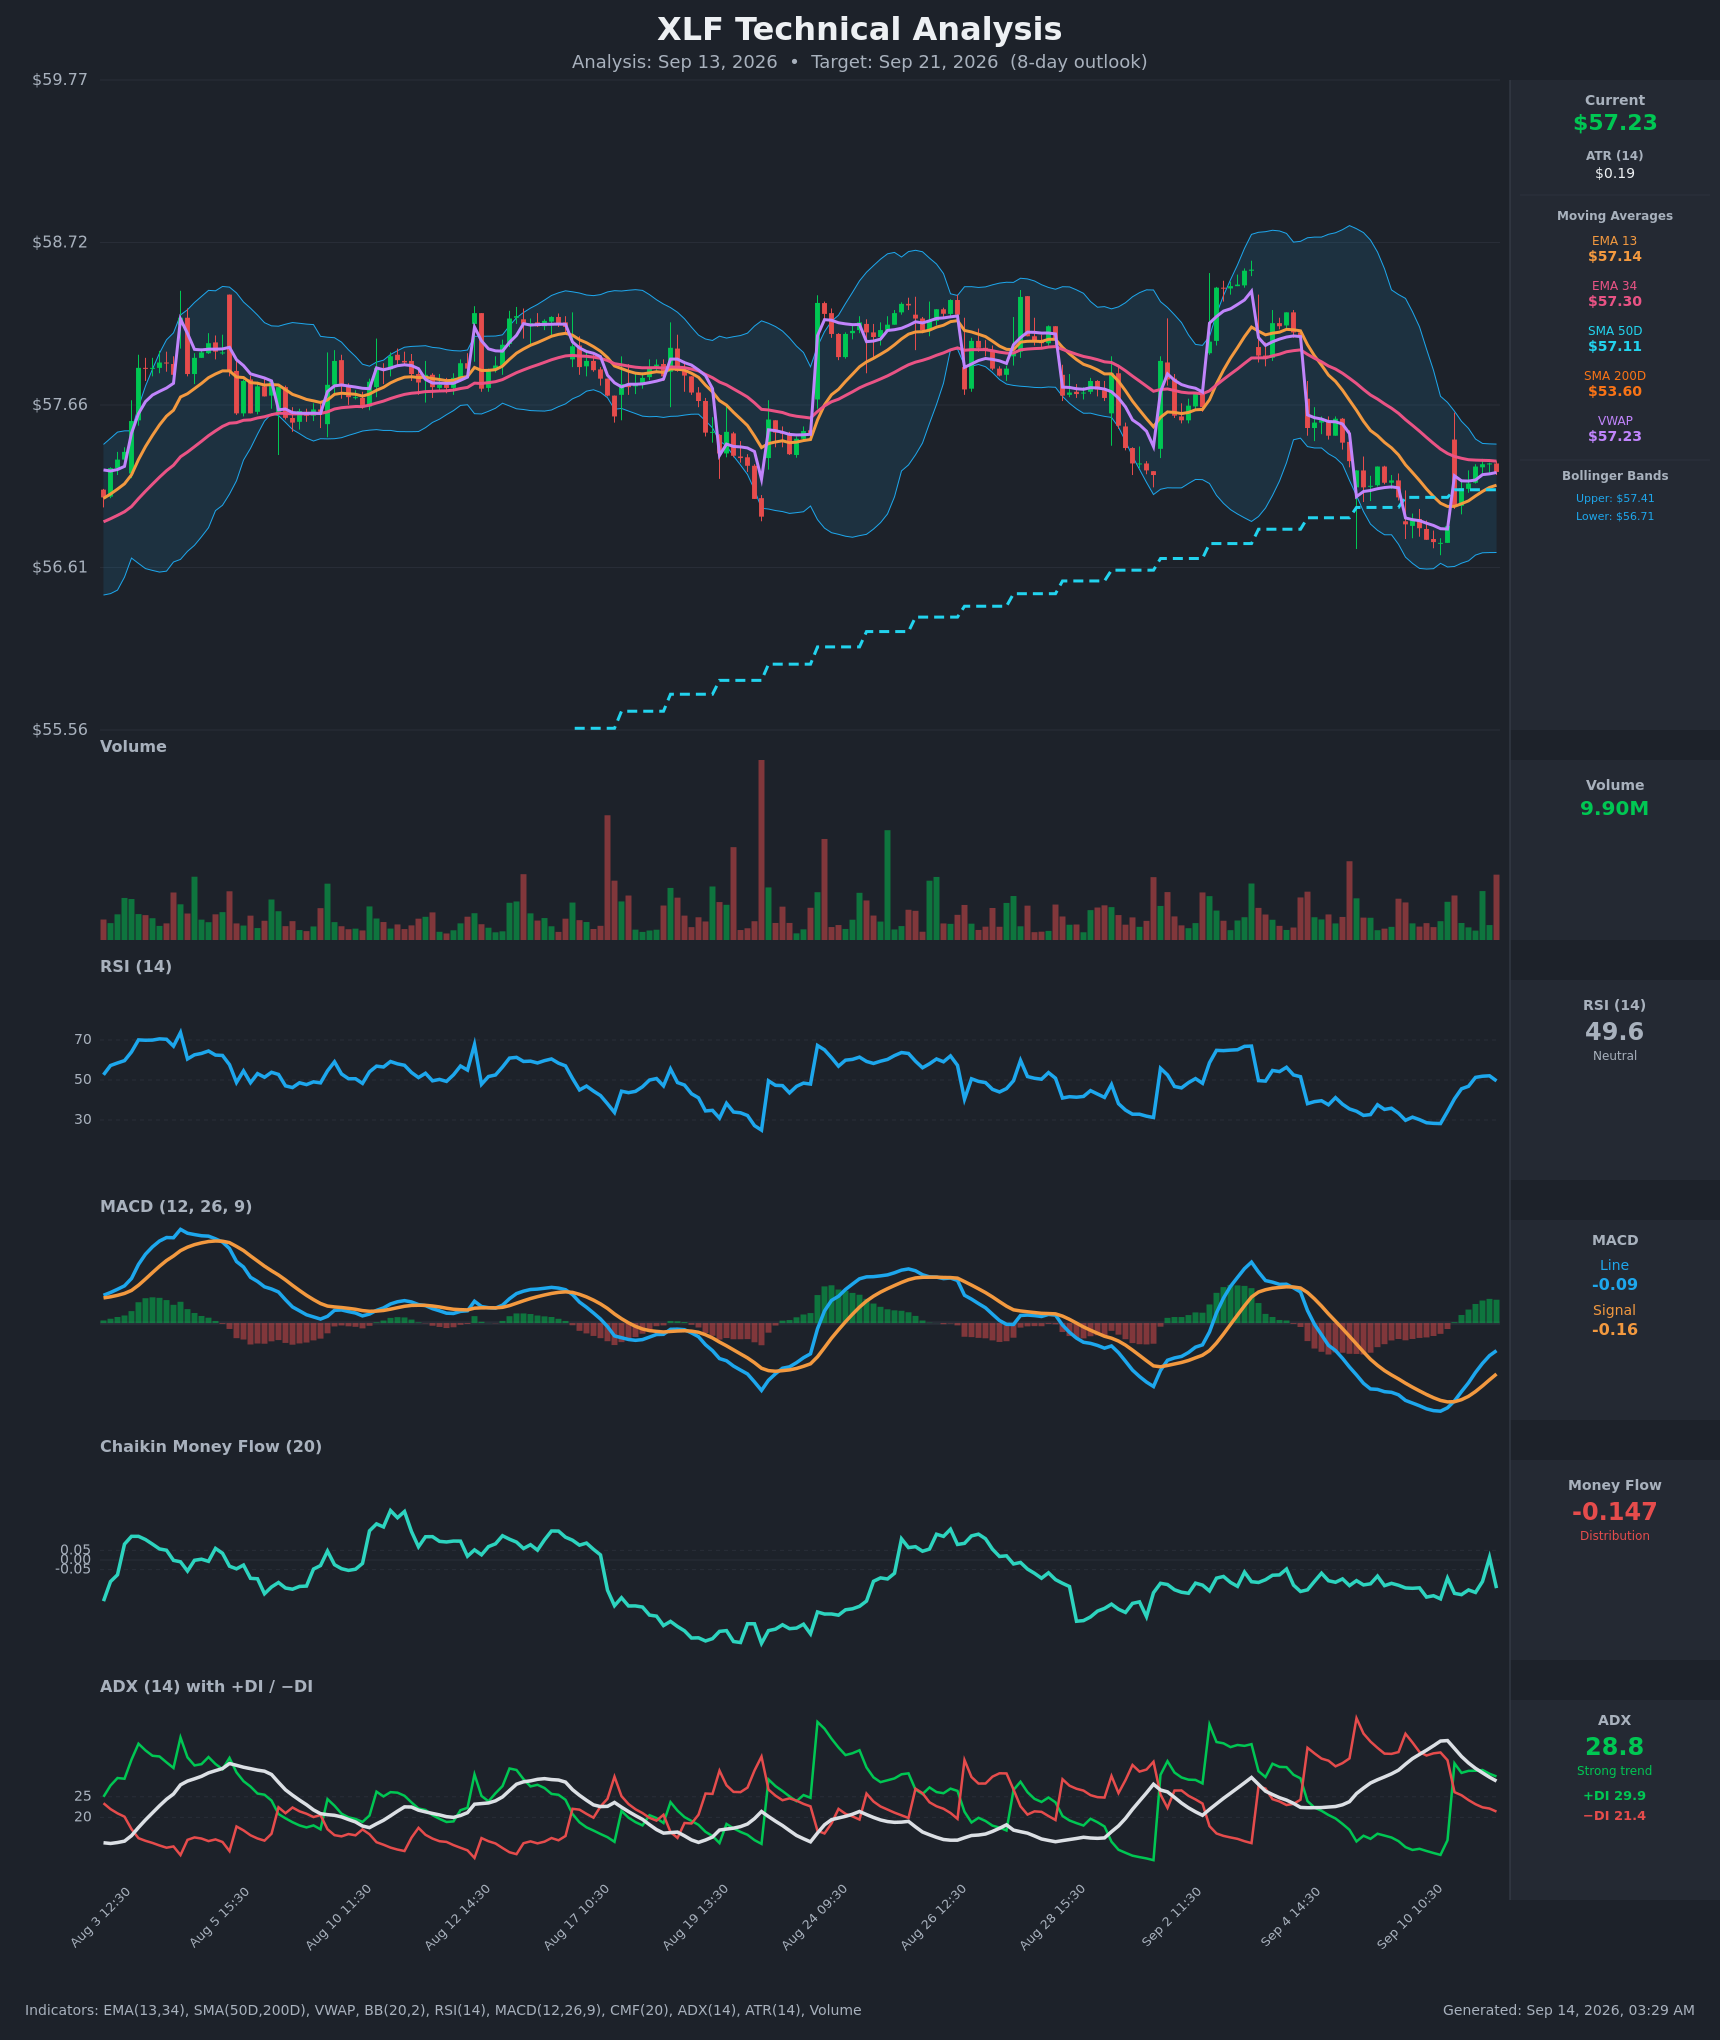
Practically, the divergence did two things to the strikes below: it kept the bearish structure's short strike above the $56.65 floor rather than through it, and it earned the bullish structure a place in this article at all.
Full technical write-ups: 4-day report → · 7-day report →
4 · Three ways the next seven days can go
If XLF pushes above $58.00: That strike carries the single largest concentration of option gamma in the whole chain, so hedging activity there tends to slow a rally down before it decides anything. Above it, positioning thins out quickly until the $58.43 swing shelf and the $58.60 52-week high. A close through $58.00 is also where this article's read stops being useful.
If XLF drifts around $57.00: This is the path positioning is built for. The September 21 expiration's call wall, put wall and max pain — the price at which the most option value would expire worthless — all sit at $57.00, and the $57.11 fifty-day moving average sits right on top of it. Expirations sometimes gravitate toward that kind of cluster, and a chain this evenly balanced at one strike gives hedging flows little reason to push price anywhere else.
If XLF breaks below $56.65: The structural floor and both chart models' support zone sit together here, just above the $56.19 lower rail of the September 18 expected move. One rough estimate has dealers in negative gamma at that September 18 expiration, the regime in which hedging tends to accelerate a move rather than cushion it — and the heaviest positioning at that expiration points to $55.00, which is both its max pain and its heaviest call strike. No flip level could be estimated today, so treat this as a regime description, not a trigger price.
5 · Three defined-risk structures
Prices are end-of-day midpoints as of 2026-09-11. All structures are hypothetical. Verify live prices before trading — these will be stale by the open.
Because the premium over delivered movement is thin (17th percentile), the debit structures lead here and the credit structure carries a health warning.
If you lean bearish: September 21 put debit spread
- Trade: Buy the September 21 $57.50 put, sell the September 21 $56.50 put
- Debit: $0.32 · Max profit: $68 per spread · Max loss: $32 per spread · Break-even: $57.18
- Why it fits: It expresses the slightly bearish flow read — put/call volume at 17.59 against a norm near 1.05, skew at 4.4 vol points against a 1.1 median — while buying rather than selling the cheapest volatility XLF has offered in a year (IV rank 14/100, premium only 1.6 vol points over delivered movement). Two-to-one payoff with the short strike parked just above the $56.65 floor.
- Makes sense only if: you accept that the chart models point the other way and you're sizing for that.
- Invalidated if: XLF closes above $58.00.
- Managing it: Take profits into any test of $56.65 rather than waiting for expiration — the one-week impulse is fighting a 50-day trend that's still positive, which argues for banking gains early. Cut it if XLF reclaims $57.70 (the 20-day line) on a closing basis.
- Liquidity note: This is the slippage risk in this trade. The September 21 $57.50 put quoted $0.56/$0.98 and the $56.50 put $0.23/$0.67 at the close, with only a handful of contracts open — work it as a single limit order on the spread, and if you can't get near the midpoint, run the same strikes at the September 18 expiration, where the chain trades in pennies.
- Analyze this position →
If you lean bullish: September 18 call debit spread
- Trade: Buy the September 18 $57 call, sell the September 18 $58 call
- Debit: $0.45 · Max profit: $55 per spread · Max loss: $45 per spread · Break-even: $57.45
- Why it fits: This is the technical case, defined. Both chart models target $57.65–$57.75, and this spread pays in full anywhere above $58.00 — the exact strike where the chain's heaviest gamma sits. Paying a debit rather than selling a put spread is the right side of a 17th-percentile premium. It expires on September 18, the near-term technical checkpoint, so it resolves before the target date rather than carrying through it.
- Makes sense only if: you weight the momentum turn (MACD crossover, directional indicators flipping on September 11) above the put-side flow.
- Invalidated if: XLF closes below $56.70 — the invalidation level both chart models name for their bullish scenario.
- Managing it: Seven days is short; take at least half off if XLF trades $57.70–$58.00 early in the window rather than holding for the maximum.
- Liquidity note: The $57 calls traded 13 cents wide ($0.52/$0.65) on 45,318 contracts of open interest and the $58 calls nine cents wide ($0.09/$0.18) on 59,728 — fills here are straightforward.
- Analyze this position →
If you expect the range to hold: September 18 iron condor
- Trade: Sell the September 18 $56 put and buy the $55 put; sell the September 18 $58 call and buy the $59 call. You collect a credit up front and keep it if XLF finishes between the short strikes.
- Credit: $0.13 · Max profit: $13 per condor · Max loss: $87 per condor · Break-evens: $55.87 and $58.13
- Why it fits: The short strikes bracket the September 18 expected move ($56.19–$58.32), with the call side deliberately inside the upper rail — a small nod to the bearish flow read. The $58 short call also sits on the chain's heaviest gamma strike.
- Health warning: you're selling premium that hasn't been rich lately. Thirteen cents collected against eighty-seven at risk is what a 14/100 IV rank and a 17th-percentile volatility premium actually pay. The odds are on your side; the payoff isn't generous.
- Makes sense only if: you're already running a portfolio of these and are indifferent to a small per-trade edge.
- Invalidated if: XLF closes above $58.00 or below $56.65 — either close puts a short strike in play with days left.
- Managing it: There's no room for a 50%-of-credit target here; hold to expiration or close the tested side outright. Don't roll a loser for a nickel.
- Liquidity note: All four legs are heavily traded — the $56 puts are a nickel wide ($0.08/$0.13) on 95,527 contracts open, the $58 calls nine cents wide on 59,728, and both wings quote in pennies.
- Analyze this position →
If none of these: no trade
There's a clean case for standing aside. The two directional reads point opposite ways — flow is slightly bearish, price structure is turning up — and when the honest answer is a two-to-one debit spread on a coin-flip premise, doing nothing costs you nothing. Selling premium is the weaker option this week, not the safer one: with IV rank at 14/100 and the gap over delivered movement at the 17th percentile of its own recent history, you are being paid below-average rates to take above-average pin risk into a thin, awkwardly-priced September 21 expiration. If the trade you actually want is a directional one, waiting for XLF to resolve $56.65 or $58.00 gives you the same structures at a much clearer entry.
6 · Quick FAQ
What is XLF's expected move this week? About ±$1.46 (±2.55%) into the September 22 expiration, or $55.79 to $58.71 around Friday's $57.25 close, per the options market's straddle pricing as of September 11. Into the nearer September 18 expiration it's ±1.86%, or $56.19 to $58.32.
Is XLF expected to go up or down over the next week? Options positioning as of September 11 leans slightly bearish — put volume ran 17.6 times call volume and 25-delta skew steepened to four times its own 60-day norm — but that's a read of what traders have done, not a forecast. The actionable map is the $55.79–$58.71 range and the $57.00 / $58.00 levels, and note that both technical models disagree with the flow read.
Are XLF options expensive right now? No. An IV rank of 14/100 says option prices are lower than 86% of the past year's readings; on top of that, they're running only about 1.6 vol points above the movement XLF has actually delivered — thinner than roughly 83% of this fund's own recent readings. That combination favors owning premium over selling it.
Where is XLF's biggest options support and resistance? For the September 21 expiration, both the put wall and the call wall sit at $57.00, alongside max pain at the same strike — an unusually balanced setup. Across the whole chain the heaviest call strike is $55.00 and the heaviest put strike $48.00, but both are far-from-the-money September 18 positions rather than live magnets.
What invalidates this week's read? A close above $58.00.
Methodology & disclosures. Data: end-of-day options-chain snapshot for XLF, 2026-09-11, generated 2026-09-14T03:29:54.226Z. Prices shown are midpoints and will differ from live markets. Momentum/positioning scores and volatility-premium comparisons are descriptive measurements of past option flow and past price movement — not investment advice, signals, forecasts, or guarantees. All trade structures are hypothetical. Every structure shown has a defined maximum loss; you can lose the entire max-loss amount. Options involve substantial risk and are not suitable for all investors.