ARM Options Are Pricing a $20.61 Move Into October 16, and the Chart Model Leans the Other Way
After a 13% slide, ARM options imply a $245.67–$286.89 range into the October 16 expiration. Our positioning read is neutral with a slight bullish tilt, while both chart models lean bearish. Here's the map and three defined-risk ways to trade it.
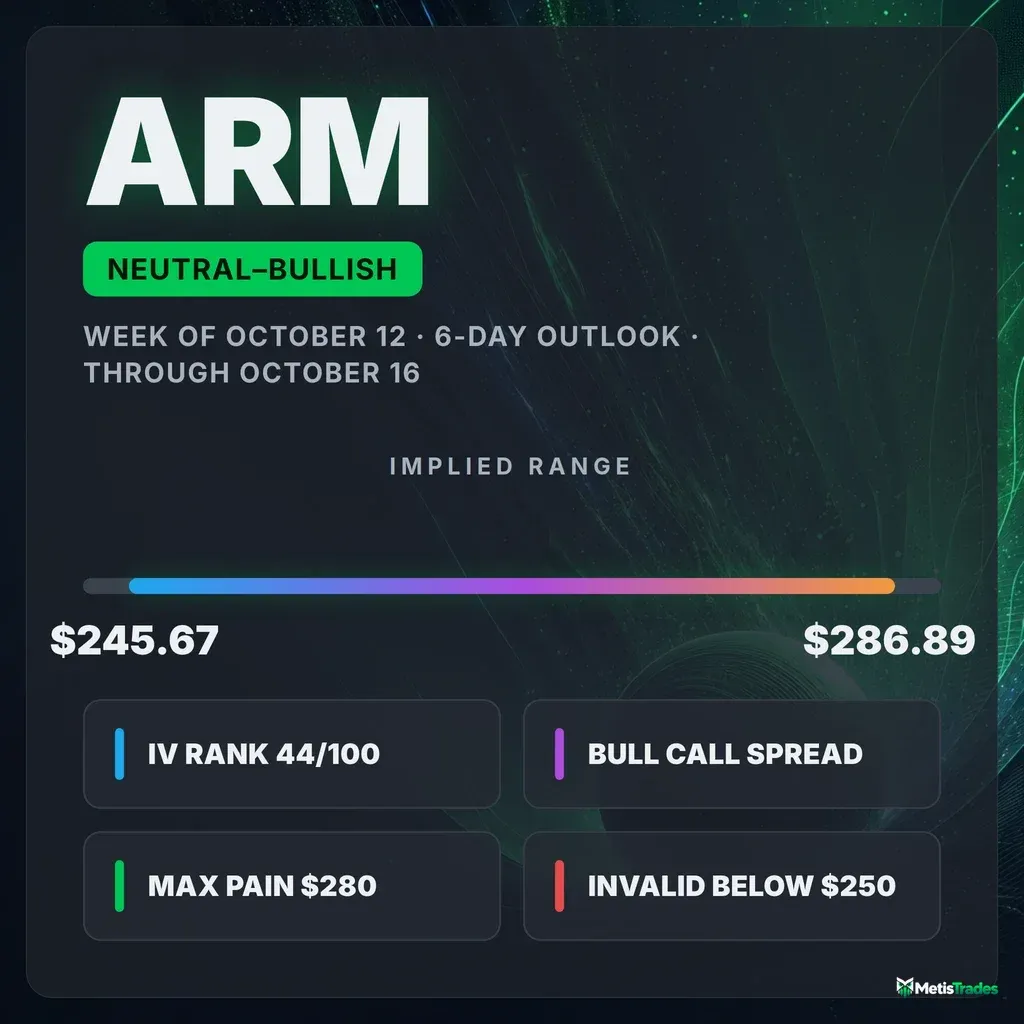
The options market implies a $245.67–$286.89 range into the October 16 expiration. Below: what's driving that range, where the levels sit, and three defined-risk ways to trade it.
Published Saturday, October 10, 2026 · Data as of Friday, October 9, 2026 close
Explore the live ARM options data in the Detailed Options Analyzer →
Quick answer
| Item | Answer |
|---|---|
| Market bias | Neutral with a slight bullish tilt |
| Options-implied range (into October 16) | $245.67 – $286.89 (±7.74%, ±$20.61) |
| Major support | $200 (October 16 put wall) · nearer: $250 (whole-chain put wall) |
| Major resistance | $350 (October 16 call wall) · nearer: $320 (whole-chain call wall) |
| Max pain (October 16) | $280 |
| Dealer gamma regime (estimate) | Negative, so hedging tends to amplify moves; flip level ≈ $145 |
| Volatility condition | Neutral. IV rank 44.1/100 · premium thin: options priced ~26 vol pts below delivered movement (earnings-inflated) |
| Next earnings | November 4, 2026 (during market hours), after the October 16 expiration |
| Technical check | Diverges (bearish; 3-day target $262.00, 6-day target $260.50) |
| Best-fitting strategy | October 16 $270/$280 bull call spread (defined-risk, conditional) |
| Analysis invalidated if | ARM closes below $250 |
1 · What matters today
ARM closed Friday at $266.28, down 13.4% in five sessions. Even so, the options market isn't pricing panic.
Our read of option positioning comes out neutral with a slight bullish tilt. The single biggest reason is near-term call buying: in options expiring within a week, traders added more than three call contracts for every put. That pull is offset by a sharp build in longer-dated puts.
The expected move is the move the options market is pricing in, derived from what straddles cost. For October 16 it is about $20.61 either way, a $245.67–$286.89 range.
Two levels frame the picture:
- $280 is max pain, the price where the most option value would expire worthless.
- $250 is the line that kills the tilt. A close below it removes the bullish lean.
One caution: both chart-based technical models lean bearish, so treat the tilt as slight.
2 · What the options market is pricing
What changed this week
ARM fell from $307.49 on October 2 to $266.28, and options traders responded by building protection. The put/call open-interest ratio compares open interest (contracts currently held open) on puts versus calls. It climbed from 0.84 to 1.30 over five sessions, meaning there are now 1.30 puts open for every call. That compares with a 7-day average of 1.04 and a 14-day average of 0.91. Put building at this pace is unusually fast for ARM, measured against this stock's own recent history.
Put/call volume tells the same story. Friday's 0.81 sits above both the 7-day and 14-day averages of 0.66.
The single largest new position, however, points the other way. Open interest in the October 16 $292.5 calls jumped by 1,848 contracts, from 157 to 2,005. Further out, the January 15, 2027 $250 puts added 1,191 contracts. For context only, the now-expired October 9 $280 calls added 1,069 contracts into Friday's settlement before expiring worthless below $280.
ATM implied volatility ended at 70.80%. That is down 5.5% on the day, up 1.2% on the week and up 9.0% over 30 sessions. IV rank (44.1) is right in line with its 7-day average of 45.0.
The bigger story is that ARM's trend reads disagree:
- Past week: a 13.4% drop.
- Past month: essentially flat (+0.6%).
- Past two months: still up 10.2%.
Near-term flow and the bigger trend are pointing different ways. That argues for short-dated structures and quick profit-taking rather than multi-week directional bets.
Expected move
Options expiring October 16 imply a move of ±7.74%, or about $20.61 in either direction from $266.28. That works out to a range of $245.67 to $286.89. The ladder widens quickly further out:
| Expiration | Implied move | Range around $266.28 |
|---|---|---|
| October 16 | ±7.74% | $245.67 – $286.89 |
| October 23 | ±11.18% | $236.51 – $296.05 |
| October 30 | ±14.17% | $228.55 – $304.01 |
| November 6 | ±19.64% | $213.98 – $318.58 |
The first three rungs scale roughly with time. The jump from ±14.17% to ±19.64% between October 30 and November 6 is a different animal, explained in the earnings note below.
Volatility
Implied volatility (IV) is the market's estimate of how much ARM will move, baked into option prices.
- Level: ATM IV is 70.80%. It sits above its 30-day average of 67.3% but well below its 90-day average of 85.3%. The October 16 expiration's own at-the-money IV is lower, at about 55.9%.
- IV rank: 44.1/100. IV rank shows where today's IV sits versus the past year, so 44.1 means option prices are cheaper than roughly 56% of the past year's readings.
- Term structure: comparing option prices across expiration dates usually shows how front-month and later contracts relate. That front-month read is unavailable today because Friday was an expiry day.
Realized volatility, meaning how much ARM has actually been moving, is lopsided:
- The 20-day reading is 97.0%, running well above this stock's recent norm. September contained a five-day surge of more than 37%.
- The 10-day reading has cooled to 68.2%.
- The past week's movement is running unusually slow relative to the past month, which is notable given the 13% drop.
Premium rich or cheap? The volatility risk premium is the gap between how much movement options are priced for and how much ARM has actually delivered. When it's positive, option sellers have been collecting more than realized movement cost them. Right now it is negative: options are priced about 26 vol points below what ARM has delivered over the past 20 days.
Today's gap is thinner than about 89% of this stock's own recent readings (an 11/100 percentile). It has stayed between roughly −21 and −27 points all week, and it was around −10 in late September, so the shift is persistent rather than a one-day blip. Much of that gap reflects September's violent upswing still sitting in the 20-day window.
The so-what: IV rank 44.1 plus an 11th-percentile premium does not favor aggressively selling premium. It also isn't a clean bargain signal for buyers. Some of the 70.80% ATM figure is the market pre-pricing the November 4 report, so the gap is distorted by the earnings calendar rather than offering a free edge either way.
Earnings on the calendar
ARM reports on November 4, during market hours, which is after the October 16, 23 and 30 expirations but before November 6. Options expiring after a scheduled report price in that report's extra jump risk. That is why at-the-money IV leaps from 59.1% (October 30) to 70.9% (November 6), and the expected move steps from ±14.17% to ±19.64%: the market is bracing for the November 4 report. The last three reports each beat estimates by $0.02 per share, and the one before matched exactly.
Skew and sentiment
Skew captures the fact that puts and calls the same distance from the stock price don't cost the same. When puts are pricier, traders are paying up for crash protection. ARM currently has the reverse:
- 25-delta calls trade at 74.3% IV versus 68.4% for puts, a gap of about 6.0 vol points in calls' favor.
- This name's 60-day norm is about 4.0 points, and the 7-day average is roughly 3.5.
- Skew flattened by about 5.4 points over five sessions.
Even mid-selloff, traders are paying more for upside lottery tickets than for downside insurance. That is part of why the composite tilts slightly bullish.
The put/call ratio measures put activity relative to calls, and above 1 means puts dominate. Volume (0.81) is still call-heavy, but open interest (1.30) has tipped to puts.
Sentiment by expiration is strongly split:
- Within a week: scores +68, versus a 7-day average of +26. Calls added 4,319 contracts against 1,310 puts in the October 16 expiration.
- 8–30 days: a milder +14.
- 60–120 days: leans bearish at −22.
That shape, a leveraged front-end chase sitting on top of longer-dated hedging, is what we'd call a bullish blow-off regime. Aggressive short-dated call buying like this often reflects bounce-hunting rather than durable conviction.
The key levels map
| Level | Price | Why it matters |
|---|---|---|
| Call wall (October 16) | $350 | The strike with the biggest pile of open calls for this expiration (6,566 contracts); far out of reach |
| Call wall (whole chain) | $320 | Heaviest call strike across all expirations (24,940 contracts, mostly November 20) |
| Heavy call/gamma strike | $300 | 3,691 October 16 calls open; a large gamma concentration overhead |
| 100-day moving average | $297.09 | Longer trend line price fell through |
| Swing resistance | $291.55 | Prior pivot cluster |
| 20-day moving average | $288.93 | Price sits 7.84% below it |
| Implied range top (October 16) | $286.89 | Upper edge of the options-priced move |
| Max pain (October 16) | $280 | Where the most option value expires worthless; $13.72 above spot |
| Swing resistance | $274.80 | First pivot above the current base |
| Largest gamma strike | $270 | Biggest gamma concentration in the chain; heavy two-sided open interest |
| 50-day moving average | $269.86 | Just lost; now overhead |
| Swing resistance | $266.53 | Sits on top of spot |
| Spot (close) | $266.28 | Friday's close |
| Gamma strike | $260 | Fourth-largest gamma strike; 2,123 October 16 puts open |
| Put wall (whole chain) | $250 | Heaviest put strike across expirations (18,811 contracts); the article's invalidation line |
| Implied range bottom (October 16) | $245.67 | Lower edge of the options-priced move |
| Swing support | $243.12 | Nearest pivot support below |
| 200-day moving average | $220.11 | Long-term trend anchor, still rising beneath |
| Put wall (October 16) | $200 | Biggest October 16 put pile (5,817 contracts); deep tail protection |
| Gamma flip (estimate) | ≈ $145 | Rough estimate only; far below spot |
Note the disagreement in the walls. The October 16 expiration's own walls ($200 / $350) bracket a huge corridor. The whole chain's walls ($250 / $320) are much closer and more relevant as practical lines. The 52-week range is $100.02–$452.70, so ARM sits near the middle of a very wide year.
Positioning and unusual flow
Market makers hedge the options they've sold. One rough estimate suggests that, in the current regime, their hedging tends to amplify moves rather than dampen them. That estimate is negative both for the whole chain and specifically for the October 16 expiration.
The same rough model places the gamma flip level near $145. Below that price, market-maker hedging tends to accelerate selling rather than cushion it. Spot sits unusually far above that estimate for this name, so the flip isn't a practical pivot over the next six days. Treat both numbers as directional color, not observed dealer inventory.
Flow worth noting:
- October 16 $285 calls: 1,554 contracts traded against just 490 open beforehand, about $406,000 in premium. Someone is paying for a quick rebound toward max pain and beyond.
- October 16 $267.5 calls: 150 contracts against 5 open (30× turnover), a small but sharp at-the-money bet.
- October 16 $260 puts: 995 contracts, about $537,000 in premium, opposing near-term downside insurance right under spot.
- November 20 $250 puts: the day's biggest premium print at about $1.64 million on 1,057 contracts. These are hedges reaching past the November 4 report.
3 · Technical check
Near-term report (checkpoint October 13). The chart model is bearish, targeting $262.00 with a projected range of $254.00–$272.00. Its key levels are support at $255.10 (the lower Bollinger Band) and resistance at $269.86 (the 50-day average). Its dominant scenario is invalidated on a close above $270.
The target sits inside the options-implied range, but the direction contradicts our slight bullish tilt, so we classify it as Diverges. The decisive reads are a strong, rising downtrend gauge (ADX 38.8, with sellers well in control) against a deeply oversold RSI of 24.5 that shows an early bullish divergence.
6-day report (target October 16). Also bearish, targeting $260.50 with a projected range of $251.50–$273.50 and resistance at $272.98. That is again inside the options-implied range but on the opposite side of our lean: Diverges.
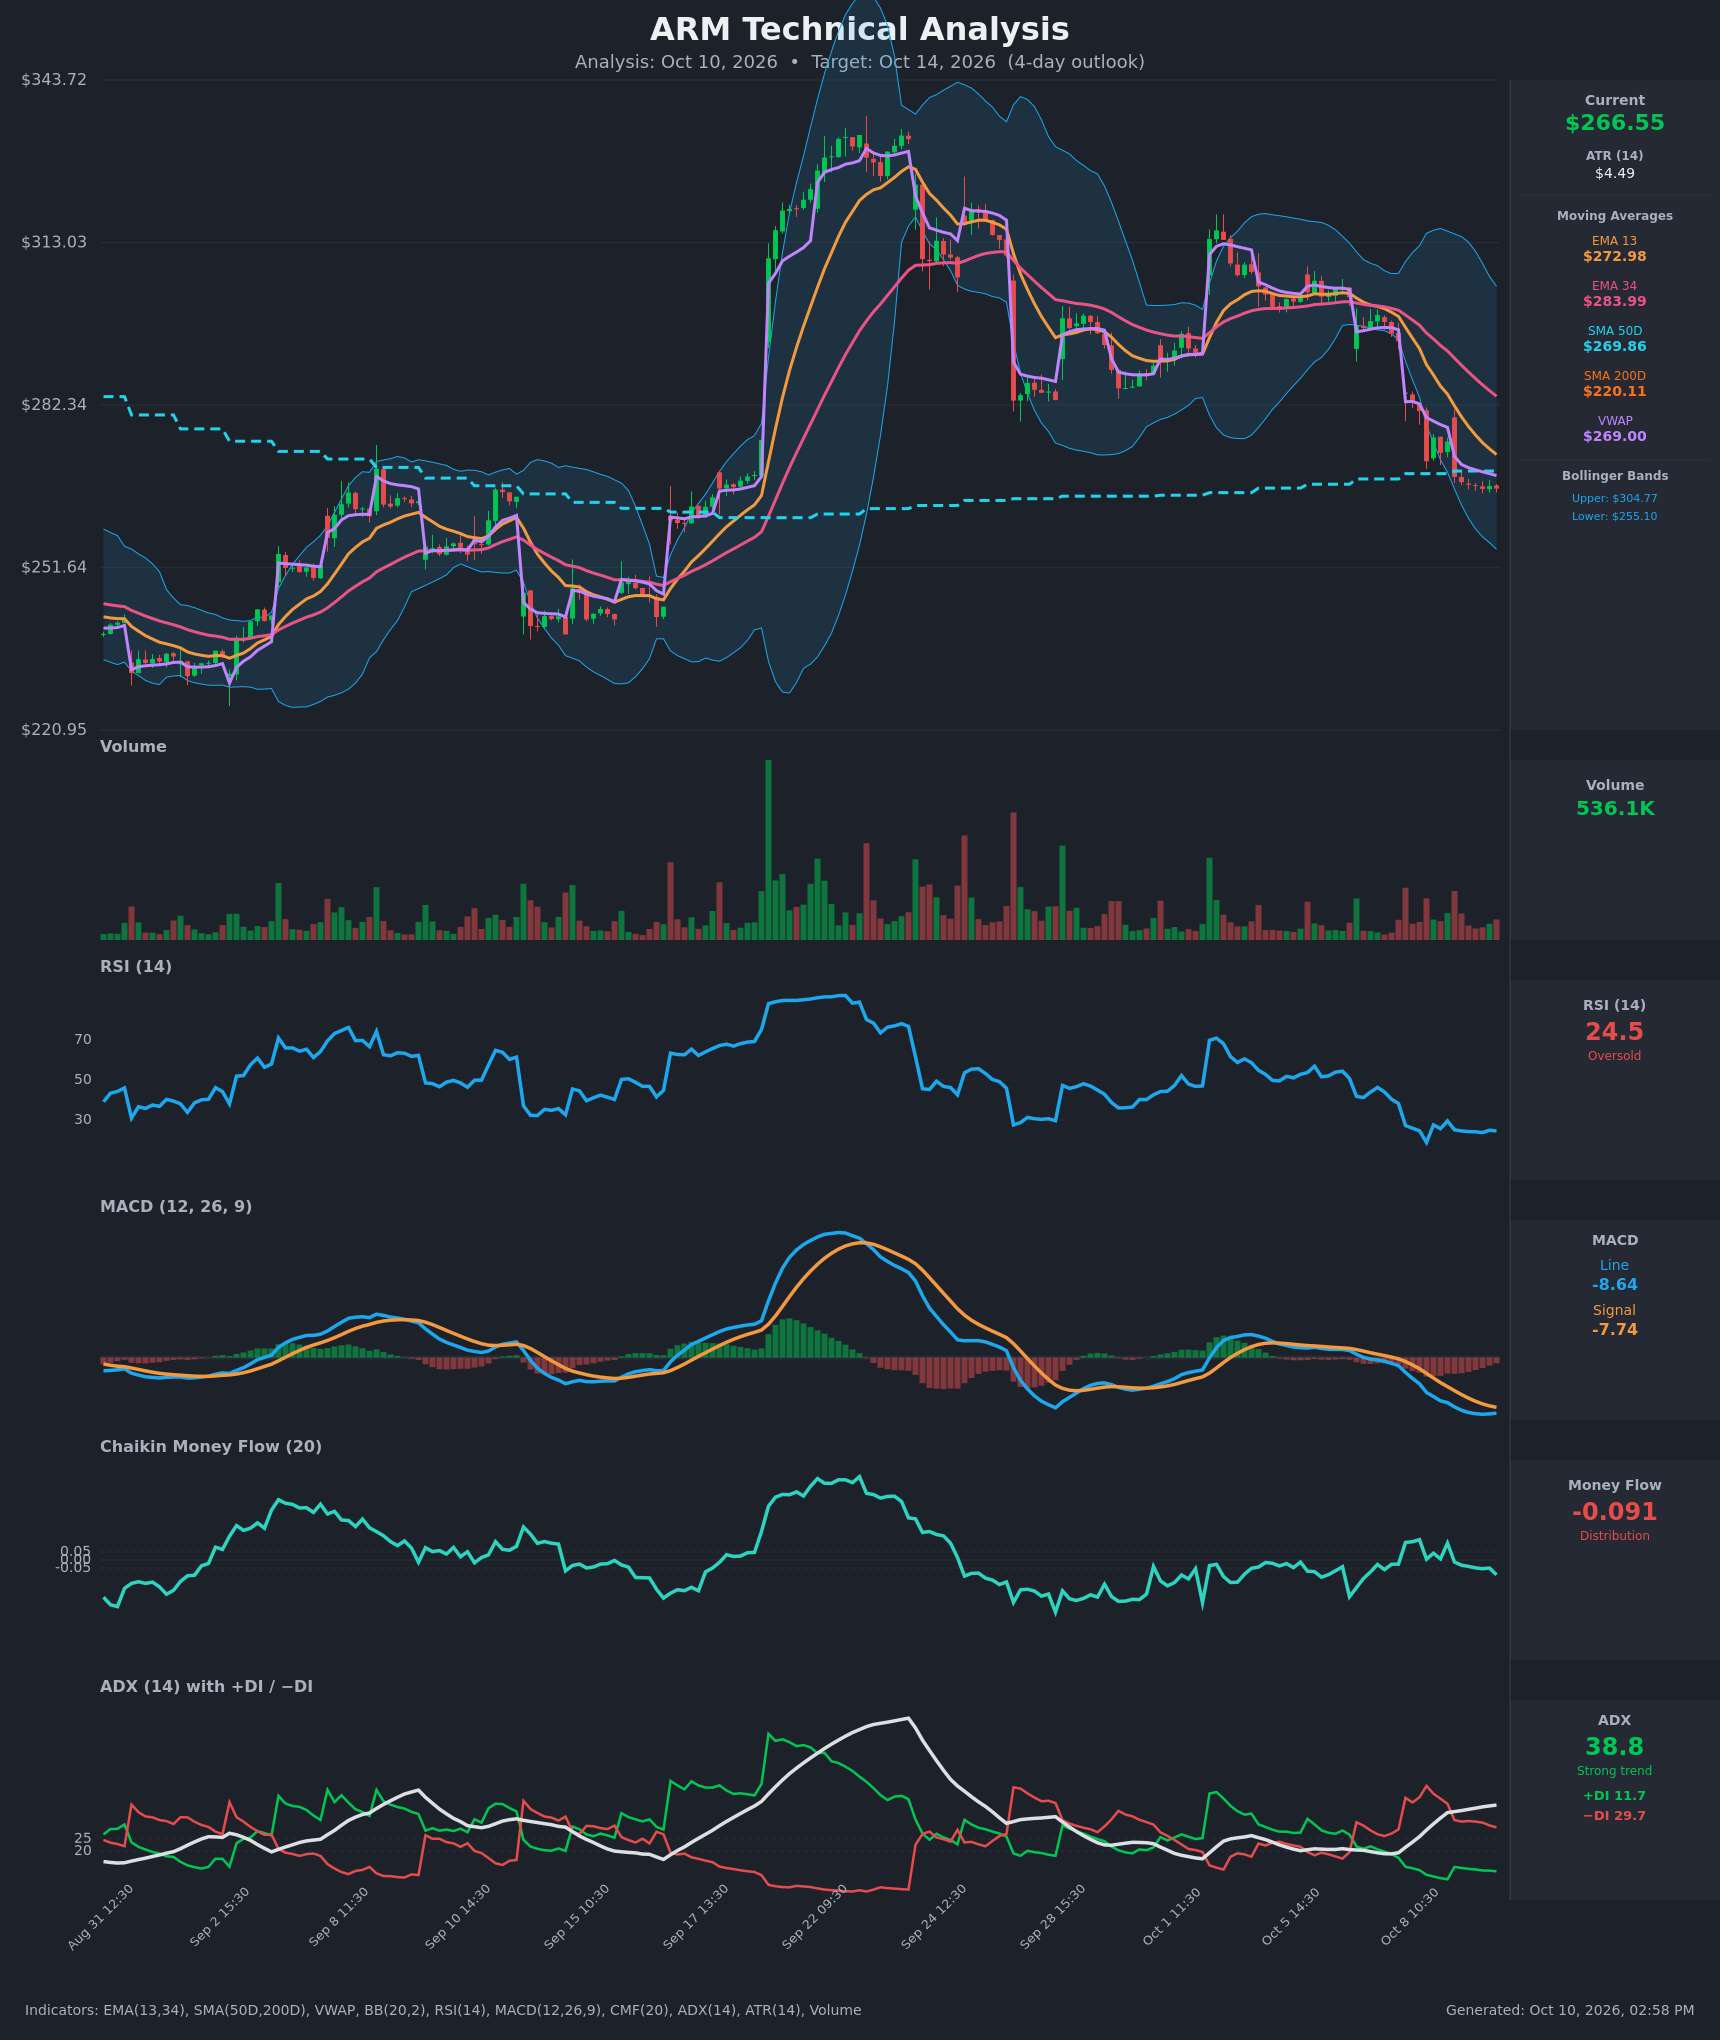
Model vs. Market: The options market implies $245.67–$286.89 into October 16; the 6-day technical model targets $260.50. Price action still argues for continuation, while option buyers are leaning toward a bounce. A close back above $270 would favor the options read; a break below $255 would hand the round to the charts.
The divergence shapes the trades below in two ways. It keeps the bullish idea in a capped debit spread rather than naked calls. It also shades the bearish structure's break-even toward the model's $260.50 target.
Full technical write-ups: 3-day report → · 6-day report →
4 · Three ways the week can go
If ARM rebounds toward max pain ($280) and beyond: Front-week call buyers would be paid, and the estimated amplifying gamma regime could speed the move. The next real overhead is the 20-day average at $288.93 and the heavy $300 call strike. The October 16 call wall at $350 is too distant to matter this week.
If ARM drifts between $255 and $280: This is the "expiring open interest pulls price around" case. The $270 strike holds the chain's biggest gamma concentration, and $280 is where October 16 options do the least damage to sellers. Chop between those two levels is the base case positioning describes.
If ARM breaks below the whole-chain put wall ($250): The bullish tilt is void, and the chart models' bearish flag would be confirmed. With hedging estimated to amplify rather than cushion moves, a break could carry toward swing support at $243.12 and the lower implied edge at $245.67. The October 16 put wall at $200 and the ~$145 flip estimate are tail markers, not near-term targets.
5 · Three defined-risk structures
Prices are end-of-day midpoints as of October 9. All structures are hypothetical unless flagged as an entered position. Verify live prices before trading; these will be stale by the open.
If you lean bullish: October 16 $270/$280 bull call spread
- Trade: Buy the October 16 $270 call ($6.85), sell the October 16 $280 call ($3.65). You pay a debit and profit if ARM rises toward $280.
- Debit: $3.20 · Max profit: $680 · Max loss: $320 · Break-even: $273.20
- Why it fits: It targets the $280 max pain and front-week call momentum. Selling the $280 call offsets the richer-than-normal call skew. A debit structure also suits a thin premium environment, since you aren't selling premium that hasn't been rich lately.
- Makes sense only if: ARM reclaims the $269.86–$270 cluster early in the window.
- Invalidated if: ARM closes below $260.
- Earnings exposure: Expires 19 days before the November 4 report, so there is no earnings-gap risk.
- Managing it: Take profits around 50–60% of max gain. The short-term trend is still fighting the longer one, so don't hold out for the full $10 width. If nothing has happened by the October 13 checkpoint, cut it.
- Liquidity note: The $270 calls traded 30¢ wide and the $280 calls 30¢ wide; fills near mid are realistic.
- Analyze this position →
If you expect the range to hold: October 16 $240/$245/$290/$295 iron condor
- Trade: Sell the $245 put ($1.525), buy the $240 put ($0.915), sell the $290 call ($1.875), buy the $295 call ($1.425), all expiring October 16. You collect a credit betting ARM stays between the short strikes.
- Credit: $1.06 · Max profit: $106 · Max loss: $394 · Break-evens: $243.94 and $291.06
- Why it fits: Both short strikes sit just outside the $245.67–$286.89 implied range. The put side is below the chart model's $251.50 range low and near swing support at $243.12. Be aware you're selling premium that hasn't been rich lately (an 11th-percentile gap), which is why this ranks second.
- Makes sense only if: You believe the post-selloff chop continues and neither the bounce nor the bearish flag resolves.
- Invalidated if: ARM closes below $245 or above $290.
- Earnings exposure: Expires 19 days before the November 4 report, so there is no earnings-gap risk.
- Managing it: Close at 50% of the credit. Exit the tested side immediately on a close through a short strike; in an amplifying gamma regime, don't wait.
- Liquidity note: The puts traded about 21¢ wide, but the $290 and $295 calls were 29–31¢ wide on small premiums (15–21% of mark). Expect slippage and work the order.
- Analyze this position →
If you lean bearish: October 16 $265/$255 bear put spread
- Trade: Buy the October 16 $265 put ($7.525), sell the October 16 $255 put ($3.425). You pay a debit and profit if ARM falls toward $255.
- Debit: $4.10 · Max profit: $590 · Max loss: $410 · Break-even: $260.90
- Why it fits: It aligns with both chart models. The break-even sits near the 6-day target of $260.50, and max value lands at the $255.10 lower-band support. The fast put build in open interest supports the case.
- Makes sense only if: ARM breaks the $265.50 hourly base the chart model flags as its trigger.
- Invalidated if: ARM closes above $270.
- Earnings exposure: Expires 19 days before the November 4 report, so there is no earnings-gap risk.
- Managing it: Take profits near $255. Oversold readings make sharp bounces likely, so bank gains rather than hold. Exit on a close above $270.
- Liquidity note: Both the $265 and $255 puts traded 55¢ wide (7–16% of mark), so fills will leak some edge. Use limit orders at or near mid.
- Analyze this position →
If none of these: no trade
Standing aside is a legitimate choice this week, for three reasons:
- The lean is weak. The tilt is slight, and both chart models argue against it.
- Premium is thin. Options are priced well below what ARM has recently delivered, so credit structures aren't well paid for the risk.
- Short-dated execution is costly. Most October 16 strikes trade wider than 5% of their price.
If you can't watch the October 13 checkpoint, or you'd rather wait for a close above $270 or below $255 to settle the options-versus-charts disagreement, no position is the cleanest position.
6 · Quick FAQ
What is ARM's expected move into October 16? About ±$20.61 (±7.74%), a $245.67–$286.89 range, per straddle pricing as of the October 9 close.
Is ARM expected to go up or down over the next six days? Options positioning as of October 9 leans neutral with a slight bullish tilt, driven by heavy front-week call buying and call-rich skew. That's a read of what traders have done, not a forecast. The actionable map is the $245.67–$286.89 range, the $280 max pain and the $250 invalidation line.
Are ARM options expensive right now? IV rank 44.1/100 says option prices are higher than about 44% of the past year's readings. On top of that, they're running about 26 vol points below the movement ARM has actually delivered, thinner than 89% of this stock's own recent readings. That makes premium thin rather than rich, though the November 4 earnings report distorts the comparison.
When is ARM's next earnings report? November 4, 2026, during market hours. That is after the October 30 expiration but before November 6, which is why options past October 30 carry noticeably more premium.
Where is ARM's biggest options support and resistance? For October 16, the put wall is $200 and the call wall is $350. Across the whole chain, the nearer walls are $250 and $320.
What invalidates this read? A close below $250.
Methodology & disclosures. Data: end-of-day options-chain snapshot for ARM, 2026-10-09, generated 2026-10-10T14:58:40.496Z. Prices shown are midpoints and will differ from live markets. Momentum/positioning scores and volatility-premium comparisons are descriptive measurements of past option flow and past price movement — not investment advice, signals, forecasts, or guarantees. Earnings dates and reported results are from the data provider's earnings feed as of 2026-10-10T14:58:40.496Z; report dates can change. All trade structures are hypothetical. Every structure shown has a defined maximum loss; you can lose the entire max-loss amount. Options involve substantial risk and are not suitable for all investors.