ARM Options Are Pricing a $25 Move Into September 25 — Flow, Walls and Three Defined-Risk Trades
The options market implies a $250.53–$300.69 range for ARM into the September 25 expiration, and last Friday's chain was overwhelmingly call-side. Here's what's driving the bullish positioning read, where the walls sit, and three defined-risk ways to trade the next six days.
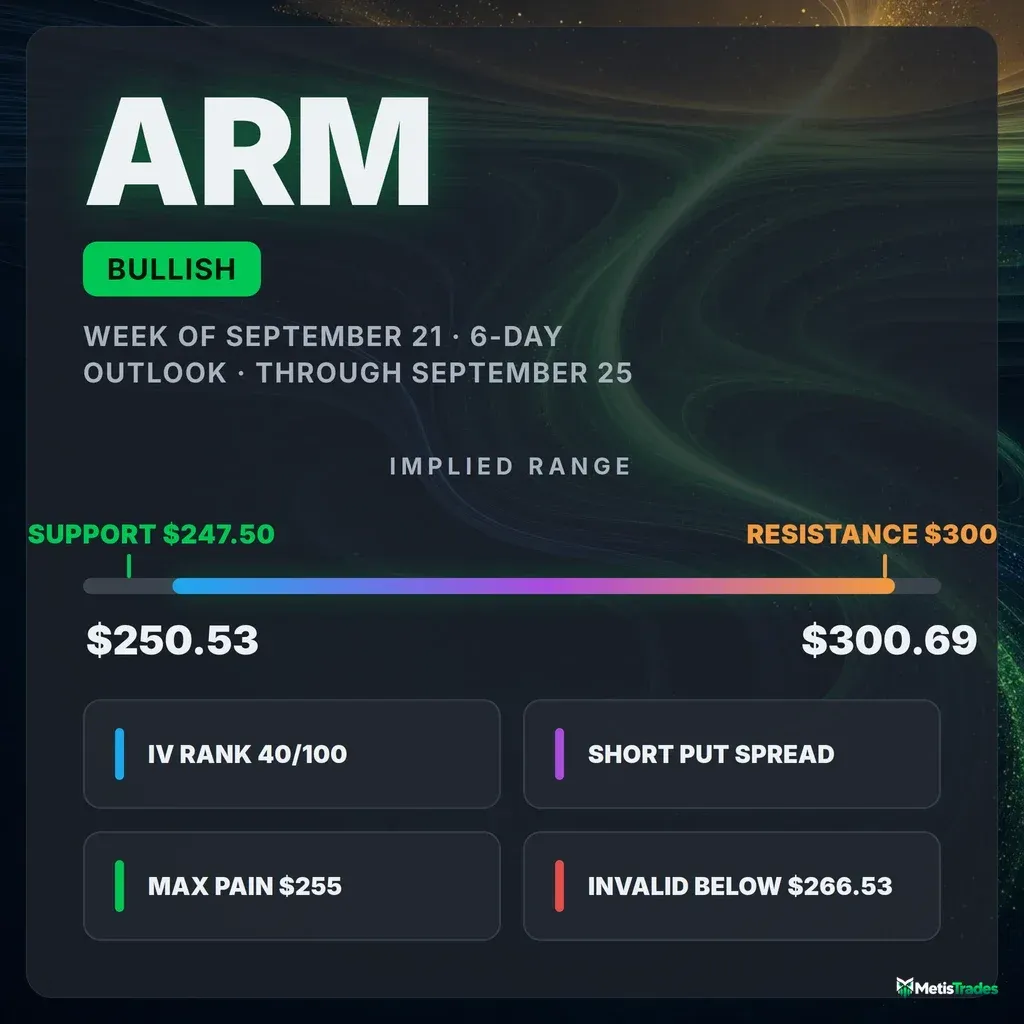
The options market implies a $250.53–$300.69 range into the September 25 expiration; here's what's driving it and three defined-risk ways to trade it.
Published Saturday, September 19, 2026 · Data as of Friday, September 18, 2026 close
Explore the live ARM options data in the Detailed Options Analyzer →
Quick answer
| Item | Answer |
|---|---|
| Market bias | Bullish |
| Spot (September 18 close) | $275.61 |
| Options-implied range (into September 25) | $250.53 – $300.69 (±9.10%, or ±$25.08) |
| Major support | $247.50 (September 25 put wall) |
| Major resistance | $300.00 (September 25 call wall) |
| Max pain (September 25) | $255.00 |
| Dealer gamma regime (estimate) | Positive — one rough estimate suggests market-maker hedging currently dampens moves; the flip level in that same estimate sits far below spot, near $140 |
| Volatility condition | Rising near term — IV rank 39.9/100 · premium roughly fair: options are priced about 0.3 vol points above delivered movement |
| Technical check | Confirms (bullish, 3-day target $281.50 and 6-day target $283.50) |
| Best-fitting strategy | Short put spread below the max-pain shelf |
| Analysis invalidated if | ARM closes below $266.53 |
1 · What matters today
ARM closed Friday, September 18 at $275.61 after a 4.1% run over five sessions, and the options chain leaned hard in the same direction. Put activity ran at just 0.32 contracts for every call — barely half its recent pace — while call open interest built and put open interest thinned. Our read of the options data comes out bullish, driven mostly by that flow tilt and by unusually rich call pricing versus puts.
The market is pricing a move of about $25 up or down into the September 25 expiration, a $250.53–$300.69 range. The level that matters on the upside is $300, where the heaviest pile of call contracts sits; on the downside, $247.50 is the biggest put strike but a thin one. A close below $266.53 — the nearest swing-support shelf — would break the thesis. Both technical reads we checked also point higher, which raises confidence but doesn't change the map.
2 · What the options market is pricing
What changed this week
The last five sessions were a round trip and then some: ARM is up 4.09% over five trading days and 9.93% over twenty, after gapping up 7.39% on September 17 and another 1.65% on September 18. Positioning followed price. Put/call volume — how much put activity there is relative to calls, where above 1 means puts dominate — printed 0.32 on Friday against a 7-day average of 0.62 and a 14-day average of 0.59. Put/call open interest (contracts currently held open) fell to 0.88 from a 7-day average of 1.08: for every call contract held open there are now 0.88 puts, where a week ago puts outnumbered calls. Total option volume ran 2.30× its 20-day average, so this was a heavy, call-skewed session rather than a quiet drift.
The single loudest change was at the $300 strike for September 25: a strike that wasn't listed the prior day finished with 6,692 contracts of open interest on 11,491 traded. The largest build at an existing strike was the September 25 $285 calls, up 1,292 contracts. Into Friday's now-settled expiration, the $270 calls shed 1,270 contracts of open interest on 8,807 traded — that book is history, not a live magnet.
One tension worth naming: the short- and long-term trend reads disagree. The past week and the past month are both bullish (+4.1% and +9.9%), but over roughly the past two and a half months ARM is still down 15.9%. The near-term flow and the bigger trend are pointing different ways, which argues for short-dated expressions and earlier profit-taking rather than sitting on a directional position for weeks.
Expected move
Into September 25, the options market is pricing a move of ±9.10% — about ±$25.08 around the $275.61 close, or a $250.53–$300.69 range. That number is the move the options market is pricing in, derived from what at-the-money straddles cost, and it is a one-standard-deviation approximation, not a ceiling.
| Expiration | Implied move | Range around $275.61 |
|---|---|---|
| September 25 (7 DTE) | ±9.10% | $250.53 – $300.69 |
| October 2 (14 DTE) | ±13.06% | $239.62 – $311.60 |
| October 16 (28 DTE) | ±18.70% | $224.07 – $327.15 |
The ladder scales almost exactly the way time alone would predict — there is no hump or kink between rungs, which tells you the chain isn't bracing for a specific dated event inside the next month.
Volatility
At-the-money implied volatility — the market's estimate of how much ARM will move, baked into option prices — sits at 67.6%. IV rank is 39.9/100, meaning today's IV is cheaper than roughly 60% of the past year's readings, and the percentile read (57) says a bit more than half of the last year's sessions closed below today's level. Direction is mixed by horizon: IV is up 0.6% on the day and 4.6% over five sessions, but down 19.1% over thirty. It sits essentially on its 30-day average (67.0%) and well under its 90-day average (87.4%) — the summer's fear premium has bled out, and only a small amount has come back with this week's move. The front-month read is unavailable today because Friday was an expiry day, so the usual comparison of option prices across different expiration dates can't be computed from this snapshot.
One observation worth flagging: ARM's short-run realized movement is accelerating sharply relative to its own month. The 5-day-versus-20-day realized-volatility ratio is running well above this stock's own recent norm — the stock is delivering bigger daily swings now than it averaged over the prior month, which is what a gap-and-go breakout looks like in the volatility data.
Premium rich or cheap. The volatility risk premium — the gap between how much movement options are priced for and how much ARM has actually delivered — is about 0.3 vol points, essentially flat. Twenty-day realized volatility is 67.4% against implied at roughly the same level, so option sellers are currently collecting close to exactly what the stock's movement has been costing them. That gap does sit at the 68th percentile of this stock's own recent readings (richer than about two-thirds of them), which tells you how negative the premium has often been lately rather than how generous it is today. The path matters too: the gap was near +18 vol points on September 8 and has compressed steadily since as the stock's realized swings caught up. Combination verdict — IV rank near 40 and a premium that is only fractionally positive — this is not a week where selling naked volatility is the edge. It favors defined-risk spreads where direction, not premium richness, does the work.
Skew and sentiment
Skew measures the fact that puts and calls the same distance from the stock price don't cost the same. On ARM right now, it runs the unusual way: 25-delta calls are marked at 72.3% implied volatility against 65.8% for 25-delta puts, so calls cost about 6.5 vol points more than puts, versus a 60-day norm of 3.1 points for this name. Traders are paying up for upside, not for crash protection — and they are doing it more aggressively than this stock's own recent history would suggest is normal.
Sentiment in short-dated options tells a two-speed story. The 0–7 day bucket reads slightly negative (a −3 score, driven by a small put build), while the 7–30 day bucket reads strongly positive at +73 — call open interest there grew by 7,892 contracts against 1,925 for puts, and delta-weighted flow is decisively call-side. The one-phrase summary the data produces is "bullish recovery": positioning is building further out rather than in the expiring front week. Our leading positioning read — the composite built only from flow, skew and term signals — closed the week at +54, its highest print in over a month, and the day-over-day build in new call open interest was unusually large for this name.
The key levels map
| Level | Price | Why it matters |
|---|---|---|
| Swing resistance cluster | $303.67 | Upper band of recent pivot highs from the daily price structure |
| Top of implied range | $300.69 | Upper rail of the ±9.10% move priced into September 25 |
| Call wall (September 25) | $300.00 | 6,692 contracts of call open interest — the biggest pile at this expiration, and the same strike as the whole chain's heaviest call strike (24,688 contracts). The two agree, which makes it the firmest overhead level on the board |
| Swing resistance | $298.83 | Prior pivot cluster just under the wall |
| Swing resistance | $291.55 | First real overhead structure from the price data |
| Second call pile (September 25) | $285.00 | 1,475 contracts, and the largest single-day open-interest build at an existing strike |
| 100-day moving average | $283.88 | The only major moving average price still sits below (−2.91%) |
| Spot | $275.61 | September 18 close |
| Swing support | $274.80 | Immediate shelf — price closed right on it |
| Swing support / invalidation | $266.53 | Next pivot cluster below; the breakout retest zone and this article's kill switch |
| 50-day moving average | $261.06 | Price sits 5.57% above it; the deeper technical floor |
| Max pain (September 25) | $255.00 | The price where the most option value would expire worthless — expirations sometimes gravitate toward it, and it sits well below spot |
| Bottom of implied range | $250.53 | Lower rail of the ±9.10% move |
| Chain-wide put wall | $250.00 | 15,838 put contracts across all expirations — a far heavier pile than the September 25 strike below |
| 20-day moving average | $249.27 | Price is 10.57% above it — stretched |
| Put wall (September 25) | $247.50 | The biggest put strike at this expiration, but a thin one at 587 contracts — the downside "floor" for the week is structurally weaker than the ceiling above |
| Gamma flip estimate | ≈$140 | One rough estimate places the level below which hedging would amplify selling far beneath spot — it is not an active risk this week |
Note the asymmetry: the September 25 put wall and the chain-wide put wall disagree ($247.50 versus $250.00), and the September 25 side is thin. The call side is the opposite — the expiration's wall and the whole chain's heaviest call strike land on the same $300 number.
Positioning and unusual flow
Market makers hedge the options they've sold, and in the estimated regime for the September 25 expiration that hedging tends to dampen moves rather than amplify them — the per-expiration estimate reads positive, as does the all-expiration aggregate, and the estimated flip level sits far below spot. Treat both as estimates built on an assumed dealer sign convention, not observed inventory. Practically, it argues for the week resolving as a grind rather than a cascade.
Three pieces of flow stood out, all non-expired:
- September 25 $300 calls — 11,491 contracts traded against zero prior open interest, closing with 6,692 held open and about $3.41 million of premium exchanged. That single strike is the reason the week's call wall exists, and it was built in one session at a $2.93/$3.00 quote.
- October 16 $300 calls — 4,119 traded on 4,082 open, roughly $4.96 million of premium, the largest dollar print anywhere in the chain. The upside interest isn't confined to the front week.
- September 25 $272.5 puts — 303 contracts traded against just 2 held open, a turnover of more than 150×. Small in dollars, but it's the one clear near-the-money hedge in an otherwise call-dominated tape.
3 · Technical check (the 20%)
Both technical timeframes we checked are bullish, and both confirm the options read. The near-term model (target date September 22) projects $281.50 with a projected range of $267.50–$286.00. The 6-day model (target date September 25, matching this article's window) projects $283.50 with a projected range of $264.00–$290.00. Both targets sit comfortably inside the options-implied $250.53–$300.69 band, and both sit above Friday's close.
The decisive indicator reads behind those calls are a trend-strength gauge that has climbed from roughly 16 to above 40 in ten sessions with directional dominance heavily to the upside, and a money-flow measure that has flipped from near zero to clearly positive alongside the breakout volume. The counterweight is an RSI at 75.3 — deep in overbought territory — which is why both write-ups assign about a 35% chance to a pause or retest of the $268–$270 breakout shelf before any further advance. The dominant scenario's invalidation is a close back below the fast moving average near $265; that lines up closely with the $266.53 swing-support shelf this article uses as its kill switch.
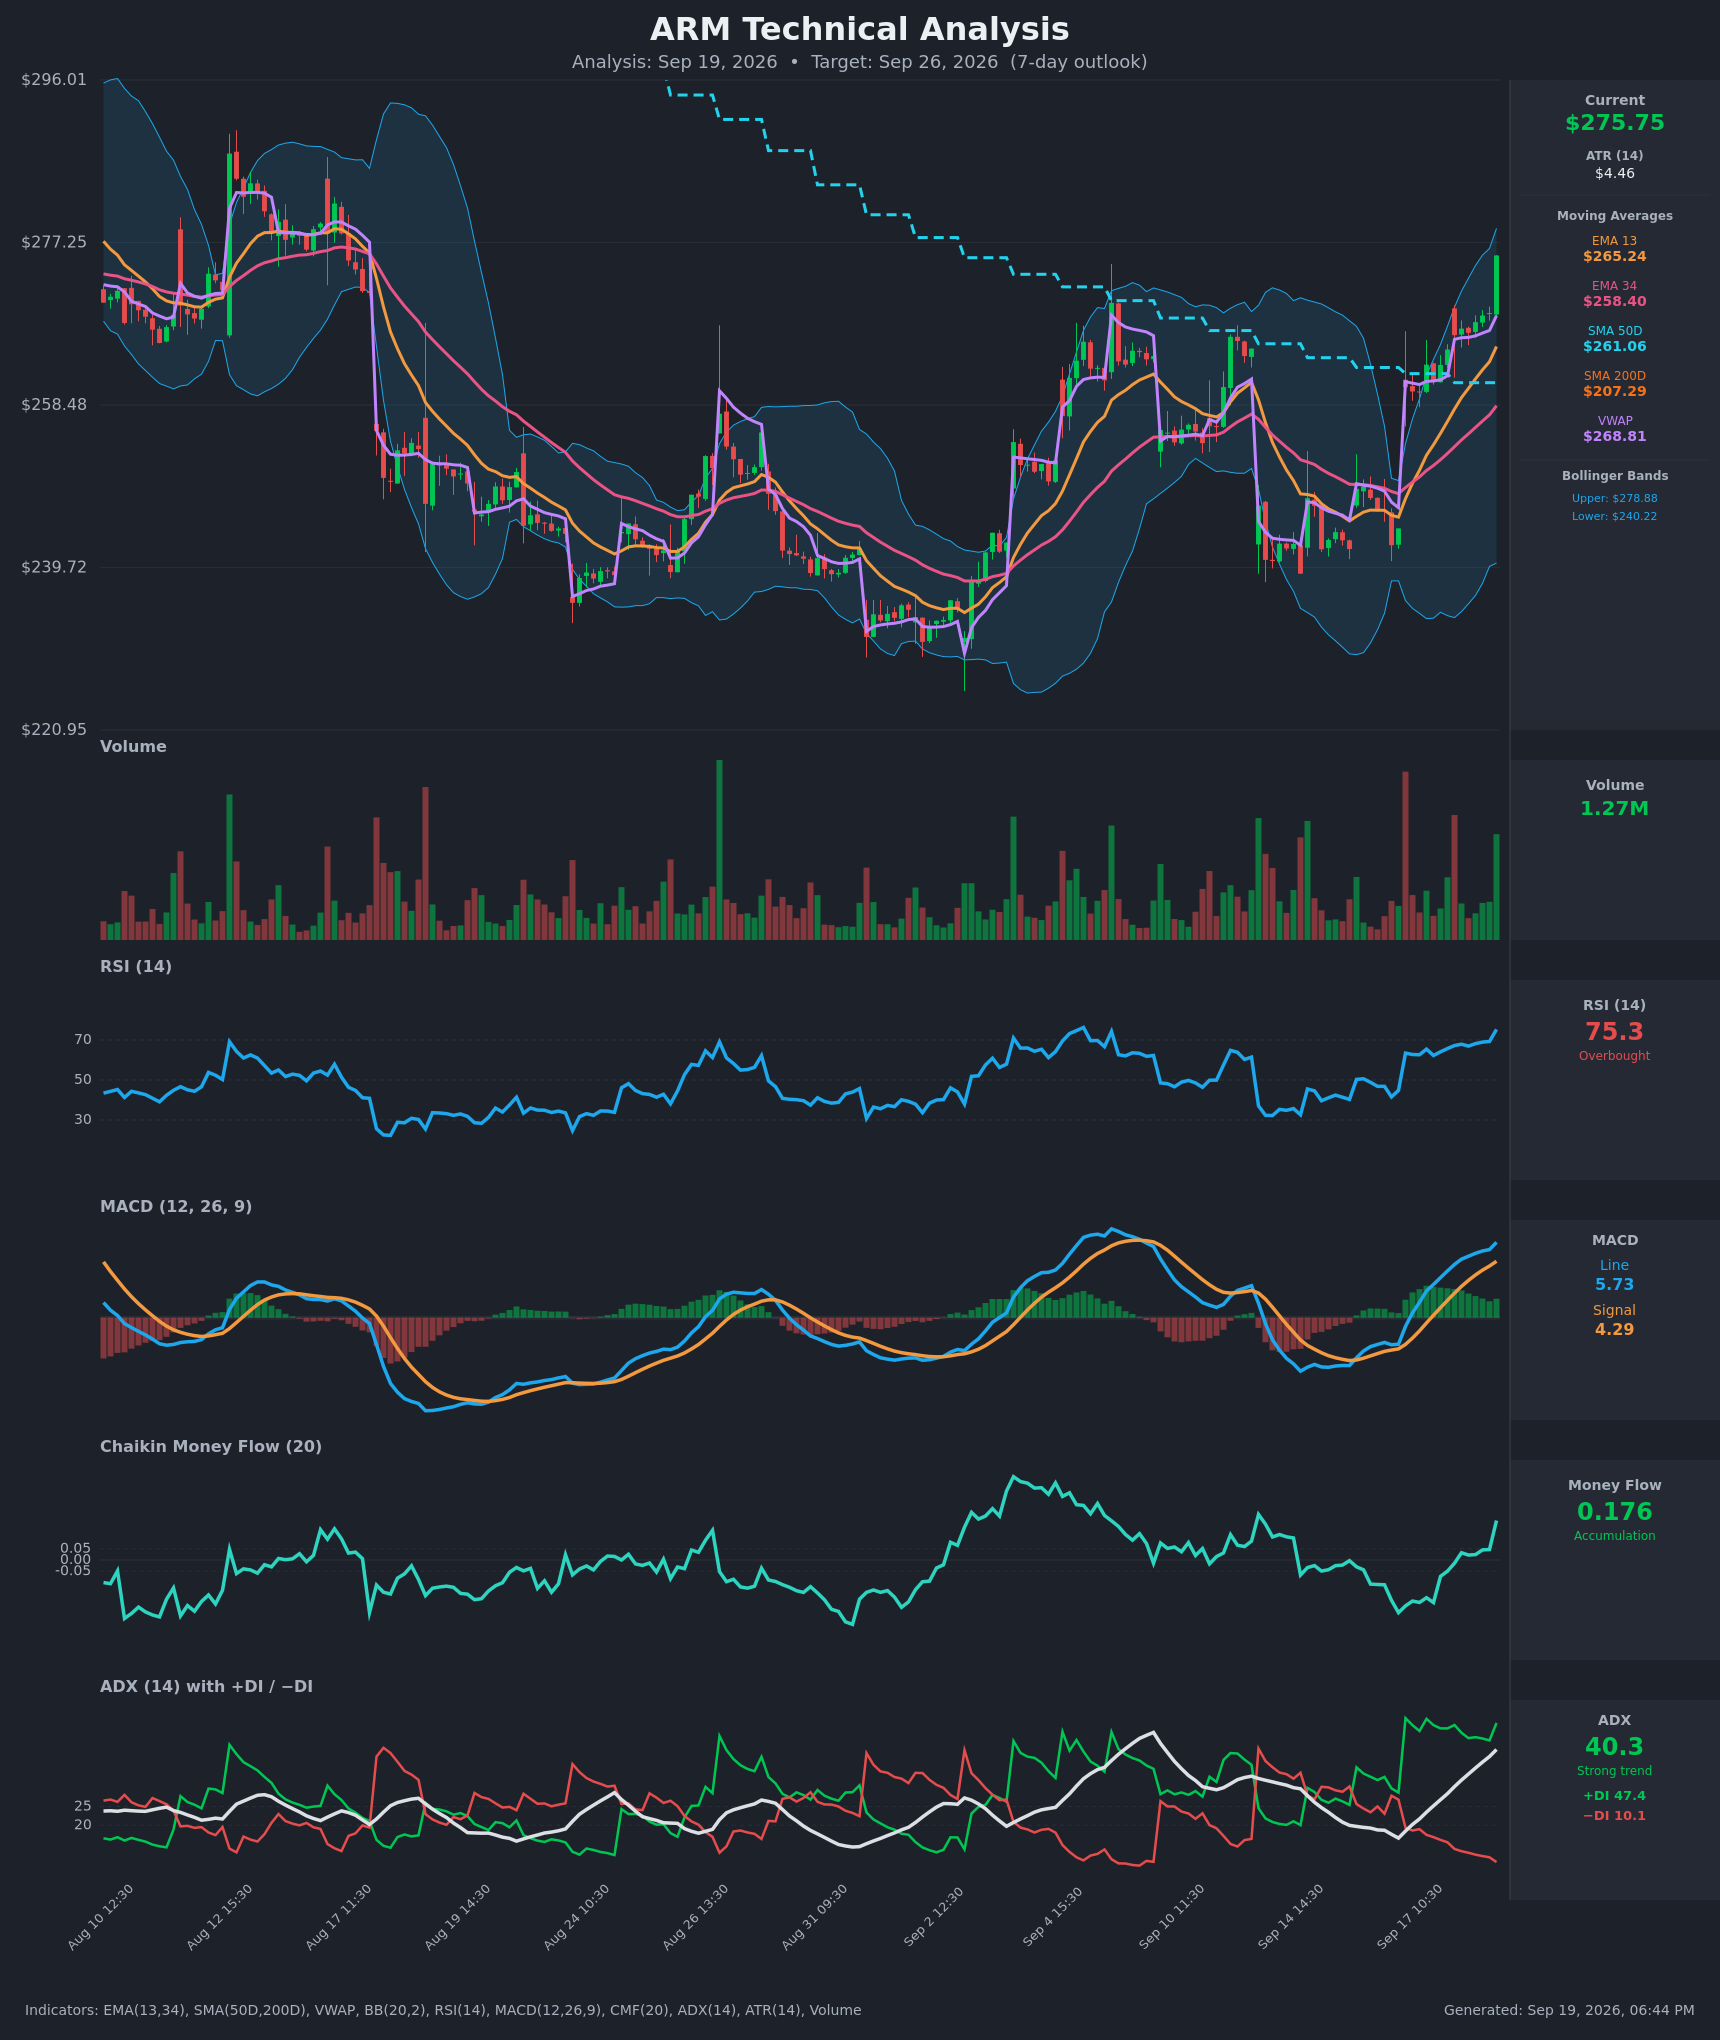
Model vs. Market: The options market implies $250.53–$300.69 into September 25; the 6-day technical model targets $283.50 inside a $264.00–$290.00 band. The technical view is the narrower of the two and sits entirely within the options rails — the chart isn't asking for anything the options market hasn't already priced, so the disagreement is about width, not direction.
That confirmation nudged short strike selection modestly higher on the put side than a pure max-pain anchor would suggest, but it did not change the structures themselves.
Full technical write-ups: 3-day report → · 6-day report →
4 · Three ways the next six days can go
If ARM pushes above the call wall ($300): That strike now holds 6,692 contracts of call open interest at this expiration and is the heaviest call strike in the entire chain. Concentrations that large tend to slow rallies as they approach, because the hedging around them cuts against the move. A clean break through it would leave thin positioning overhead until the $303.67 swing cluster — and the top of the week's implied range at $300.69 sits right there too, so a close above $300 would be the market trading outside what it priced.
If ARM drifts between the walls: This is the base case the positioning supports. Max pain for September 25 sits at $255.00, well below spot, and the estimated dealer-gamma regime for this expiration is the pinning kind rather than the accelerating kind. Expiring open interest and hedging flows tend to pull price toward the heavier strikes as the week runs down; between $255 and $300 there is a lot of room for ARM to churn without touching either rail. Note that max pain sitting $20 below spot means the gravitational pull, such as it is, points down — one of the few genuinely bearish facts on this board.
If ARM breaks below the put wall ($247.50): That would require roughly a 10% drop in six days, at the very bottom of the implied range. The put wall at this expiration is thin — 587 contracts — so it's a weak floor; the chain-wide put pile at $250.00 (15,838 contracts) is the more meaningful shelf, and the 20-day moving average at $249.27 sits in the same zone. Spot is sitting unusually far above the estimated gamma flip level for this name, so the acceleration mechanic that turns a drop into a cascade is not in play at these prices.
5 · Three defined-risk structures
Prices are end-of-day midpoints as of September 18. All structures are hypothetical. Verify live prices before trading — these will be stale by the open.
If you lean bullish: September 25 $260/$250 put credit spread
- Trade: Sell the September 25 $260 put, buy the September 25 $250 put. You collect a credit up front and keep it all if ARM stays above $260 at expiration.
- Credit: $2.07 · Max profit: $207 · Max loss: $793 · Break-even: $257.93
- Why it fits: The short strike sits below max pain ($255.00 is lower still, but $260 is inside the shelf where the chain-wide put pile begins) and roughly 5.7% below spot, comfortably inside the $250.53 lower rail of the implied move. It is the structure that gets paid by the flow tilt — call-heavy volume, thinning put open interest, and calls priced 6.5 vol points over puts — without requiring ARM to actually rally.
- Makes sense only if: you accept the bullish-to-sideways read and are willing to risk nearly four times the credit to collect it.
- Invalidated if: ARM closes below $266.53.
- Managing it: Close at roughly 50% of max credit; with the short-term trend running against a still-negative two-month trend, take profit early rather than holding into expiration Friday. If ARM closes through $260, close the position rather than hoping for a bounce.
- Liquidity note: the $260 puts were quoted $3.60/$3.90 (about 30¢ wide, ~8% of mid) and the $250 puts $1.63/$1.74. Both are wider than ideal — work the order toward the mid and don't pay the market.
- Analyze this position →
If you expect the range to hold: September 25 $250/$255/$300/$305 iron condor
- Trade: Sell the $255 put and buy the $250 put; sell the $300 call and buy the $305 call, all September 25. You collect a credit and keep it if ARM finishes between $255 and $300.
- Credit: $1.56 · Max profit: $156 · Max loss: $344 · Break-evens: $253.44 and $301.56
- Why it fits: The short strikes are placed directly on the two structural levels the chain names for this expiration — max pain at $255.00 on the put side, the $300 call wall on the call side. The break-evens at $253.44 and $301.56 sit just outside both rails of the ±9.10% implied move, so the position only loses if ARM does something the market itself isn't pricing.
- Makes sense only if: you think the breakout has already done its work and the week grinds inside the corridor. A powerful trend read is the main argument against it.
- Invalidated if: ARM closes above $300.00 or below $255.00 — either short strike being breached turns a small credit into a losing position quickly with six days on the clock.
- Managing it: Take profit at roughly 50% of the credit, or close the untested side once one wing decays to pennies. With only six days to run there is no time to repair a tested side, so exit rather than adjust.
- Liquidity note: the $300 calls are the best-quoted contract in the chain at $2.93/$3.00 (7¢ wide, ~2% of mid) on 11,491 contracts traded. The $305 calls ($2.25/$2.40), $255 puts ($2.50/$2.71) and $250 puts ($1.63/$1.74) are each 6–8% wide, so all four legs together will leak real edge on a market order — leg it or use a limit at the natural mid.
- Analyze this position →
If you lean bearish: September 25 $290/$300 call credit spread
- Trade: Sell the September 25 $290 call, buy the September 25 $300 call. You collect a credit and keep it if ARM stays below $290.
- Credit: $2.04 · Max profit: $204 · Max loss: $796 · Break-even: $292.04
- Why it fits: This is the fade of an overbought breakout, and it has two facts on its side: max pain for the week is $255.00, twenty dollars below spot, and RSI at 75.3 is stretched enough that both technical write-ups give a pullback or consolidation roughly a one-in-three chance. The long $300 leg is bought at the call wall itself, so the position's worst case is capped exactly where the heaviest positioning in the chain sits.
- Makes sense only if: you are explicitly trading against the dominant options read. The flow, the skew and both chart models all point the other way — size accordingly.
- Invalidated if: ARM closes above $291.55, the first swing resistance above spot.
- Managing it: Take profit at 50% of credit; because the short-term trend is running hard against this trade, exit on strength rather than waiting for expiration. If ARM trades through $290 intraday, close.
- Liquidity note: the $290 calls quoted $4.90/$5.10 (20¢, ~4% of mid) on 878 traded and 674 open, and the $300 calls are 7¢ wide — this is the tightest of the three structures to execute.
- Analyze this position →
If none of these: no trade
There is a real case for standing aside here. The premium is only fractionally richer than the movement ARM has actually delivered — about 0.3 vol points — so the usual reason to sell a spread into a rangebound week barely applies, and IV rank near 40 puts option prices squarely in the middle of their own 52-week range. Meanwhile realized volatility is accelerating: the stock's five-day swings are running well above its own monthly pace, and it has gapped more than 1.5% in four of the last five sessions. Short premium into accelerating realized movement, at a fair rather than rich price, is a thin edge. If you don't have a view on direction, the honest answer this week is that the chain is not paying you enough to guess.
6 · Quick FAQ
What is ARM's expected move this week? ±$25.08 (±9.10%) into the September 25 expiration, per the options market's straddle pricing as of the September 18 close — a range of $250.53 to $300.69 around the $275.61 close.
Is ARM expected to go up or down over the next six days? Options positioning as of September 18 leans bullish — call volume outran puts more than 3-to-1, put open interest is thinning, and calls are priced about 6.5 vol points above equidistant puts — but that's a read of what traders have done, not a forecast. The actionable map is the $250.53–$300.69 range and the $247.50 / $300.00 levels.
Are ARM options expensive right now? Two lenses. IV rank of 39.9/100 says option prices are lower than about 60% of the past year's readings. On top of that, they're running only about 0.3 vol points above the movement ARM has actually delivered over the past twenty days — a gap that is nonetheless richer than roughly two-thirds of this stock's own recent readings, because that gap has often been negative lately. Verdict: fairly priced, not cheap and not a premium-seller's gift.
Where is ARM's biggest options support and resistance? For the September 25 expiration, the put wall is $247.50 (587 contracts) and the call wall is $300.00 (6,692 contracts). The chain-wide heaviest put strike sits slightly higher at $250.00 with 15,838 contracts, and the chain-wide heaviest call strike is also $300.00.
What invalidates this week's read? A close below $266.53 — the nearest swing-support shelf and the retest zone for this week's breakout.
Methodology & disclosures. Data: end-of-day options-chain snapshot for ARM, 2026-09-18, generated 2026-09-19T18:44:52.444Z. Prices shown are midpoints and will differ from live markets. Momentum/positioning scores and volatility-premium comparisons are descriptive measurements of past option flow and past price movement — not investment advice, signals, forecasts, or guarantees. All trade structures are hypothetical. Every structure shown has a defined maximum loss; you can lose the entire max-loss amount. Options involve substantial risk and are not suitable for all investors.