ASTS Options Are Pricing a $5.30 Move Into September 25 — The Chart Model Sees $56.90
The options market implies a $53.22–$63.82 range for ASTS into the September 25 expiration, and positioning reads genuinely neutral — but both technical models point lower. Here's the level map, the premium math, and three defined-risk ways to structure it.
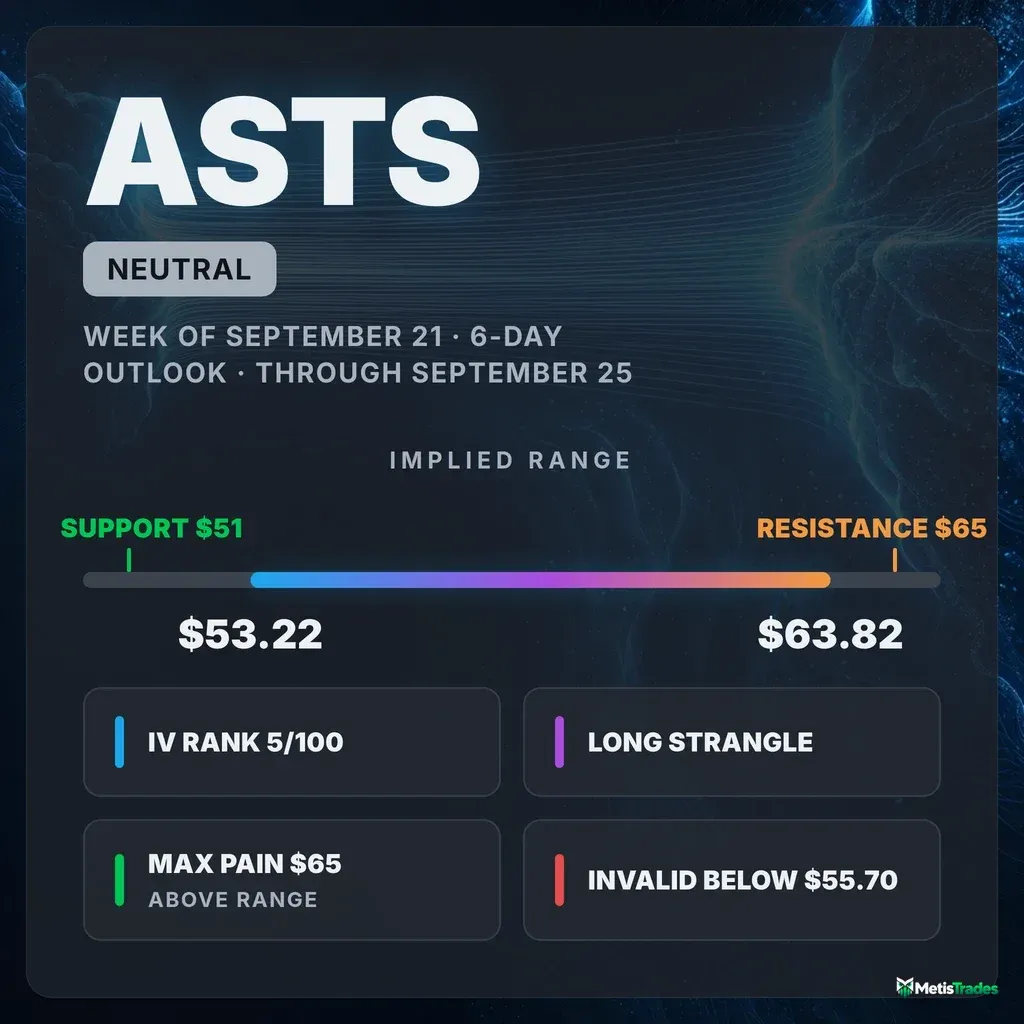
The options market implies a $53.22–$63.82 range into the September 25 expiration; here's what's driving it, where the walls sit, and three defined-risk ways to trade it.
Published Saturday, September 19, 2026 · Data as of Friday, September 18 close
Explore the live ASTS options data in the Detailed Options Analyzer →
Quick answer
| Item | Answer |
|---|---|
| Market bias | Neutral |
| Options-implied range (into September 25) | $53.22 – $63.82 (±9.05%, or ±$5.30) |
| Major support | $51.00 (September 25 put wall) |
| Major resistance | $65.00 (September 25 call wall) |
| Max pain (September 25) | $65.00 |
| Dealer gamma regime (estimate) | Negative — hedging tends to amplify moves; flip level ≈ $20, far below spot and not in play this window |
| Volatility condition | Falling — IV rank 4.6/100 · ATM IV 70.1% · premium thin: options priced about 11 vol points below delivered movement |
| Technical check | Diverges (bearish, 3-day and 6-day) |
| Best-fitting strategy | Long September 25 $58 put / $60 call strangle |
| Analysis invalidated if | ASTS closes below $55.70 |
1 · What matters today
ASTS closed Friday, September 18 at $58.52 after a violent two-day round trip — up to $62.71, then all the way back. The options market is pricing a move of about ±$5.30 (±9.05%) into the September 25 expiration, which frames a $53.22–$63.82 range. That's the number to anchor on.
Our read of options flow lands genuinely neutral this week: near-dated sentiment leans bullish, call open interest is building, but the price trend and the skew both pull the other way. The signals disagree, and the honest answer is to say so rather than manufacture a lean. The single most useful fact is that option prices are cheap — IV rank 4.6 out of 100, and priced for less movement than ASTS has actually been delivering. Both technical models disagree with the neutral read and point lower. A close below $55.70 says they were right and this read was wrong.
2 · What the options market is pricing
What changed this week
Price did most of the talking: ASTS is down 2.24% over the past five sessions and 10.05% over twenty, and Friday's session erased a 4.35% gap-up from the day before. Option volume ran 1.61× its 20-day average — heavy, but not the 2×-plus that would flag a genuine flow event.
The positioning underneath leaned call-side. Between the September 17 and September 18 snapshots, call open interest grew by 25,770 contracts against just 2,571 puts, and the put/call open-interest ratio has slid from 0.64 to 0.55 over five sessions — for every call contract held open there are now 0.55 puts, against a 14-day average of 0.62. Puts are being retired faster than they're being added. Put/call volume told the same story on the day at 0.45, well below the 7-day average of 0.59.
Implied volatility — the market's estimate of how much ASTS will move, baked into option prices — barely budged: down 0.45% on the day, up 1.17% over five sessions, but down 33.19% over thirty. The single biggest change in contracts held open among still-live strikes was the November 20 $65 put, which added 2,554 contracts to 5,734; inside our own window, the September 25 $70 call added 1,578 contracts on 2,407 lots traded.
One tension worth naming: the short-, medium- and long-term trend reads all point the same way — down 2.2% over the past week, 10.1% over the past month and 20.8% over roughly two and a half months — and the momentum composite flipped from a bullish to a bearish configuration on September 16. That's an aligned downtrend sitting underneath call-heavy positioning. Both things are true at once.
Expected move
The expected move is the move the options market is pricing in, derived from what straddles cost. Into September 25 that's ±$5.30, or ±9.05% of the $58.52 close — a $53.22–$63.82 range.
| Expiration | Implied move | Range around $58.52 |
|---|---|---|
| September 25 (7 days) | ±9.05% | $53.22 – $63.82 |
| October 2 (14 days) | ±13.08% | $50.87 – $66.17 |
| October 16 (28 days) | ±19.40% | $47.17 – $69.87 |
The ladder scales almost exactly with the square root of time — there is no hump, no kink, no expiration where the chain is bracing for something specific. That is itself information: the market isn't pricing a dated event inside the next month.
Volatility
At-the-money implied volatility is 70.1%. IV rank is 4.6 out of 100 — where today's IV sits versus the past year, so 4.6 means it's pinned near the bottom of its past-year range; only about 2% of the last year's readings were lower. Current IV sits below both its 30-day average (78.5%) and its 90-day average (101.2%), and it has fallen a third over the past month. The front-month read is unavailable today, an artifact of Friday's expiration rather than missing data.
Realized movement is the other half of the picture. Twenty-day realized volatility is 81.3% — high in absolute terms, but compared against this stock's own recent history it is actually depressed, well below its norm for ASTS. Short-term movement is running about in line with the past month (the 5-day/20-day realized ratio is 0.89).
Premium rich or cheap? The volatility risk premium — the gap between how much movement options are priced for and how much ASTS has actually delivered — is running at about negative 11 vol points. When it's positive, option sellers have been collecting more than realized movement cost them; here it's the reverse. That reading sits at the 41st percentile of this stock's own recent history, meaning it's thinner than roughly six out of ten recent days. Combine it with an IV rank of 4.6 and the verdict is clear: this is a week to own premium rather than sell it. The gap has widened over the past five sessions (from about −1.5 vol points on September 16 to −11.2 on Friday) as Friday's drop pushed realized movement up while implied volatility stayed flat — nothing mechanical about it, just the stock moving more than the chain is charging for.
Skew and sentiment
Skew measures how puts and calls the same distance from the stock price are priced relative to each other. In ASTS, calls are the expensive side: 25-delta call IV is 73.2% against 69.9% for the equivalent put, so calls cost about 3.4 vol points more than puts — the fingerprint of persistent upside speculation in this name. But the norm is a 6.0-point call premium over the past 60 days, so that gap has narrowed by roughly half. Traders have been bidding puts relatively harder over the last week, and that shift is the single most bearish input in our read.
Flow cuts the other way. Put/call volume at 0.45 is 17% below its 60-day median, call-side sweeps outnumbered put-side ones four to one among contracts clearing the unusual-volume bar, and both the call-tilted volume and the net new open interest are running well above their own norms for this stock. Sentiment in short-dated options is the most bullish rung on the curve: the 0–7 day bucket scores +32 and the 60–120 day bucket +25, with the middle of the curve flat. The overall label is "broadly bullish" — but note that the front bucket's score is driven almost entirely by call open interest building while puts shrank, not by directional sweeps.
The key levels map
One caution before the table: the September 25 expiration's own walls are not the same as the whole chain's. Across all nine listed expirations combined, the heaviest call strike is $70 (33,870 contracts) and the heaviest put strike is $55 (31,214). For the expiration this article is built around, they sit at $65 and $51. When they disagree, the near-dated row is the one that governs the week.
| Level | Price | Why it matters |
|---|---|---|
| Whole-chain call wall | $70.00 | 33,870 calls held open across all expirations — the longer-term ceiling, and a swing-resistance cluster sits at $70.10 |
| Swing resistance | $67.20 | Recent pivot high |
| Call wall + max pain (Sept 25) | $65.00 | 7,710 calls held open at this strike for the week's expiration, and the price where the most option value would expire worthless — the chain's most magnetic single level |
| Swing resistance | $64.17 | First price-structure barrier overhead |
| Top of implied range | $63.82 | Upper 1σ rail into September 25 |
| 50-day moving average | $63.25 | Price is 7.5% below it |
| 20-day moving average | $61.09 | Price is 4.2% below it |
| Last close | $58.52 | Friday, September 18 |
| Swing support | $57.27 | First shelf beneath spot |
| Swing support / invalidation | $55.70 | A close below here says the downtrend, not the neutral read, is in charge |
| Whole-chain put wall | $55.00 | 31,214 puts across all expirations — mostly October 16, not this week |
| Bottom of implied range | $53.22 | Lower 1σ rail into September 25 |
| Swing support | $53.07 | Last structural shelf before the low-$50s |
| Put wall (Sept 25) | $51.00 | 2,690 puts — the week's heaviest put strike, but thin and 12.8% below spot |
| 52-week low | $40.15 | Price sits 56.3% below the $133.86 52-week high |
Positioning and unusual flow
One rough estimate of dealer positioning puts the September 25 expiration in a negative-gamma regime, where market-maker hedging tends to amplify moves rather than cushion them — but the estimated net figure for that expiration is essentially zero, so there is very little hedging pressure of either kind attached to this week's contracts. The estimated flip level sits near $20, far below spot; that reading is unusually far from the current price even by this stock's own standards, which is a polite way of saying gamma mechanics are not the story here.
Three live flow items stood out on Friday. The September 25 $66 call traded 5,322 contracts against 888 held open — six turns of its own open interest, and a 100th-percentile print versus comparable contracts, worth roughly $190,000 of premium. The September 25 $70 call traded 2,407 lots and added 1,578 contracts of open interest, so that is new positioning, not closing. And the largest single premium print anywhere in the chain was the November 20 $65 call: 3,886 contracts, about $2.13 million. All three are upside bets — cheap, far out of the money, and paid for with the low implied volatility described above.
3 · Technical check
Both chart-model horizons read bearish, and both are fresh as of September 19 with a reference price of $58.50 against our $58.52 close. The 3-day model targets $57.20 with a projected range of $56.10–$59.70 into September 22; the 6-day model targets $56.90 with a projected range of $55.50–$60.20 into September 25. Their case rests on two decisive reads: a MACD bearish crossover completed on September 18 after the failed push to $63.40, and an ADX near 25 with the negative directional line (28.6) above the positive (20.3) — a trend that is strengthening, not chopping.
Against the options-implied range, both targets sit comfortably inside the rails — they are not extreme calls. But the direction contradicts our neutral positioning read, so this classifies as a divergence rather than a confirmation. The gap that resolves it is narrow and specific: the models name $60.14 as their invalidation level, and the option chain's own structure has nothing meaningful between $58.52 and the $65 call wall. Reclaim $60.14 and the bearish chart case is dead; lose $55.70 and the neutral options read is.
Model vs. Market: The options market implies $53.22–$63.82 into September 25; the 6-day technical model targets $56.90. The chart says drift lower inside the range — not break it — which is why the structures below are built around the range's rails rather than a directional bet on either end.
The practical effect on strike selection: the bearish structure below is shaded toward the technical target rather than toward the distant $51 put wall, and the neutral structure uses the two most heavily traded strikes surrounding spot rather than stretching for the implied-range edges.
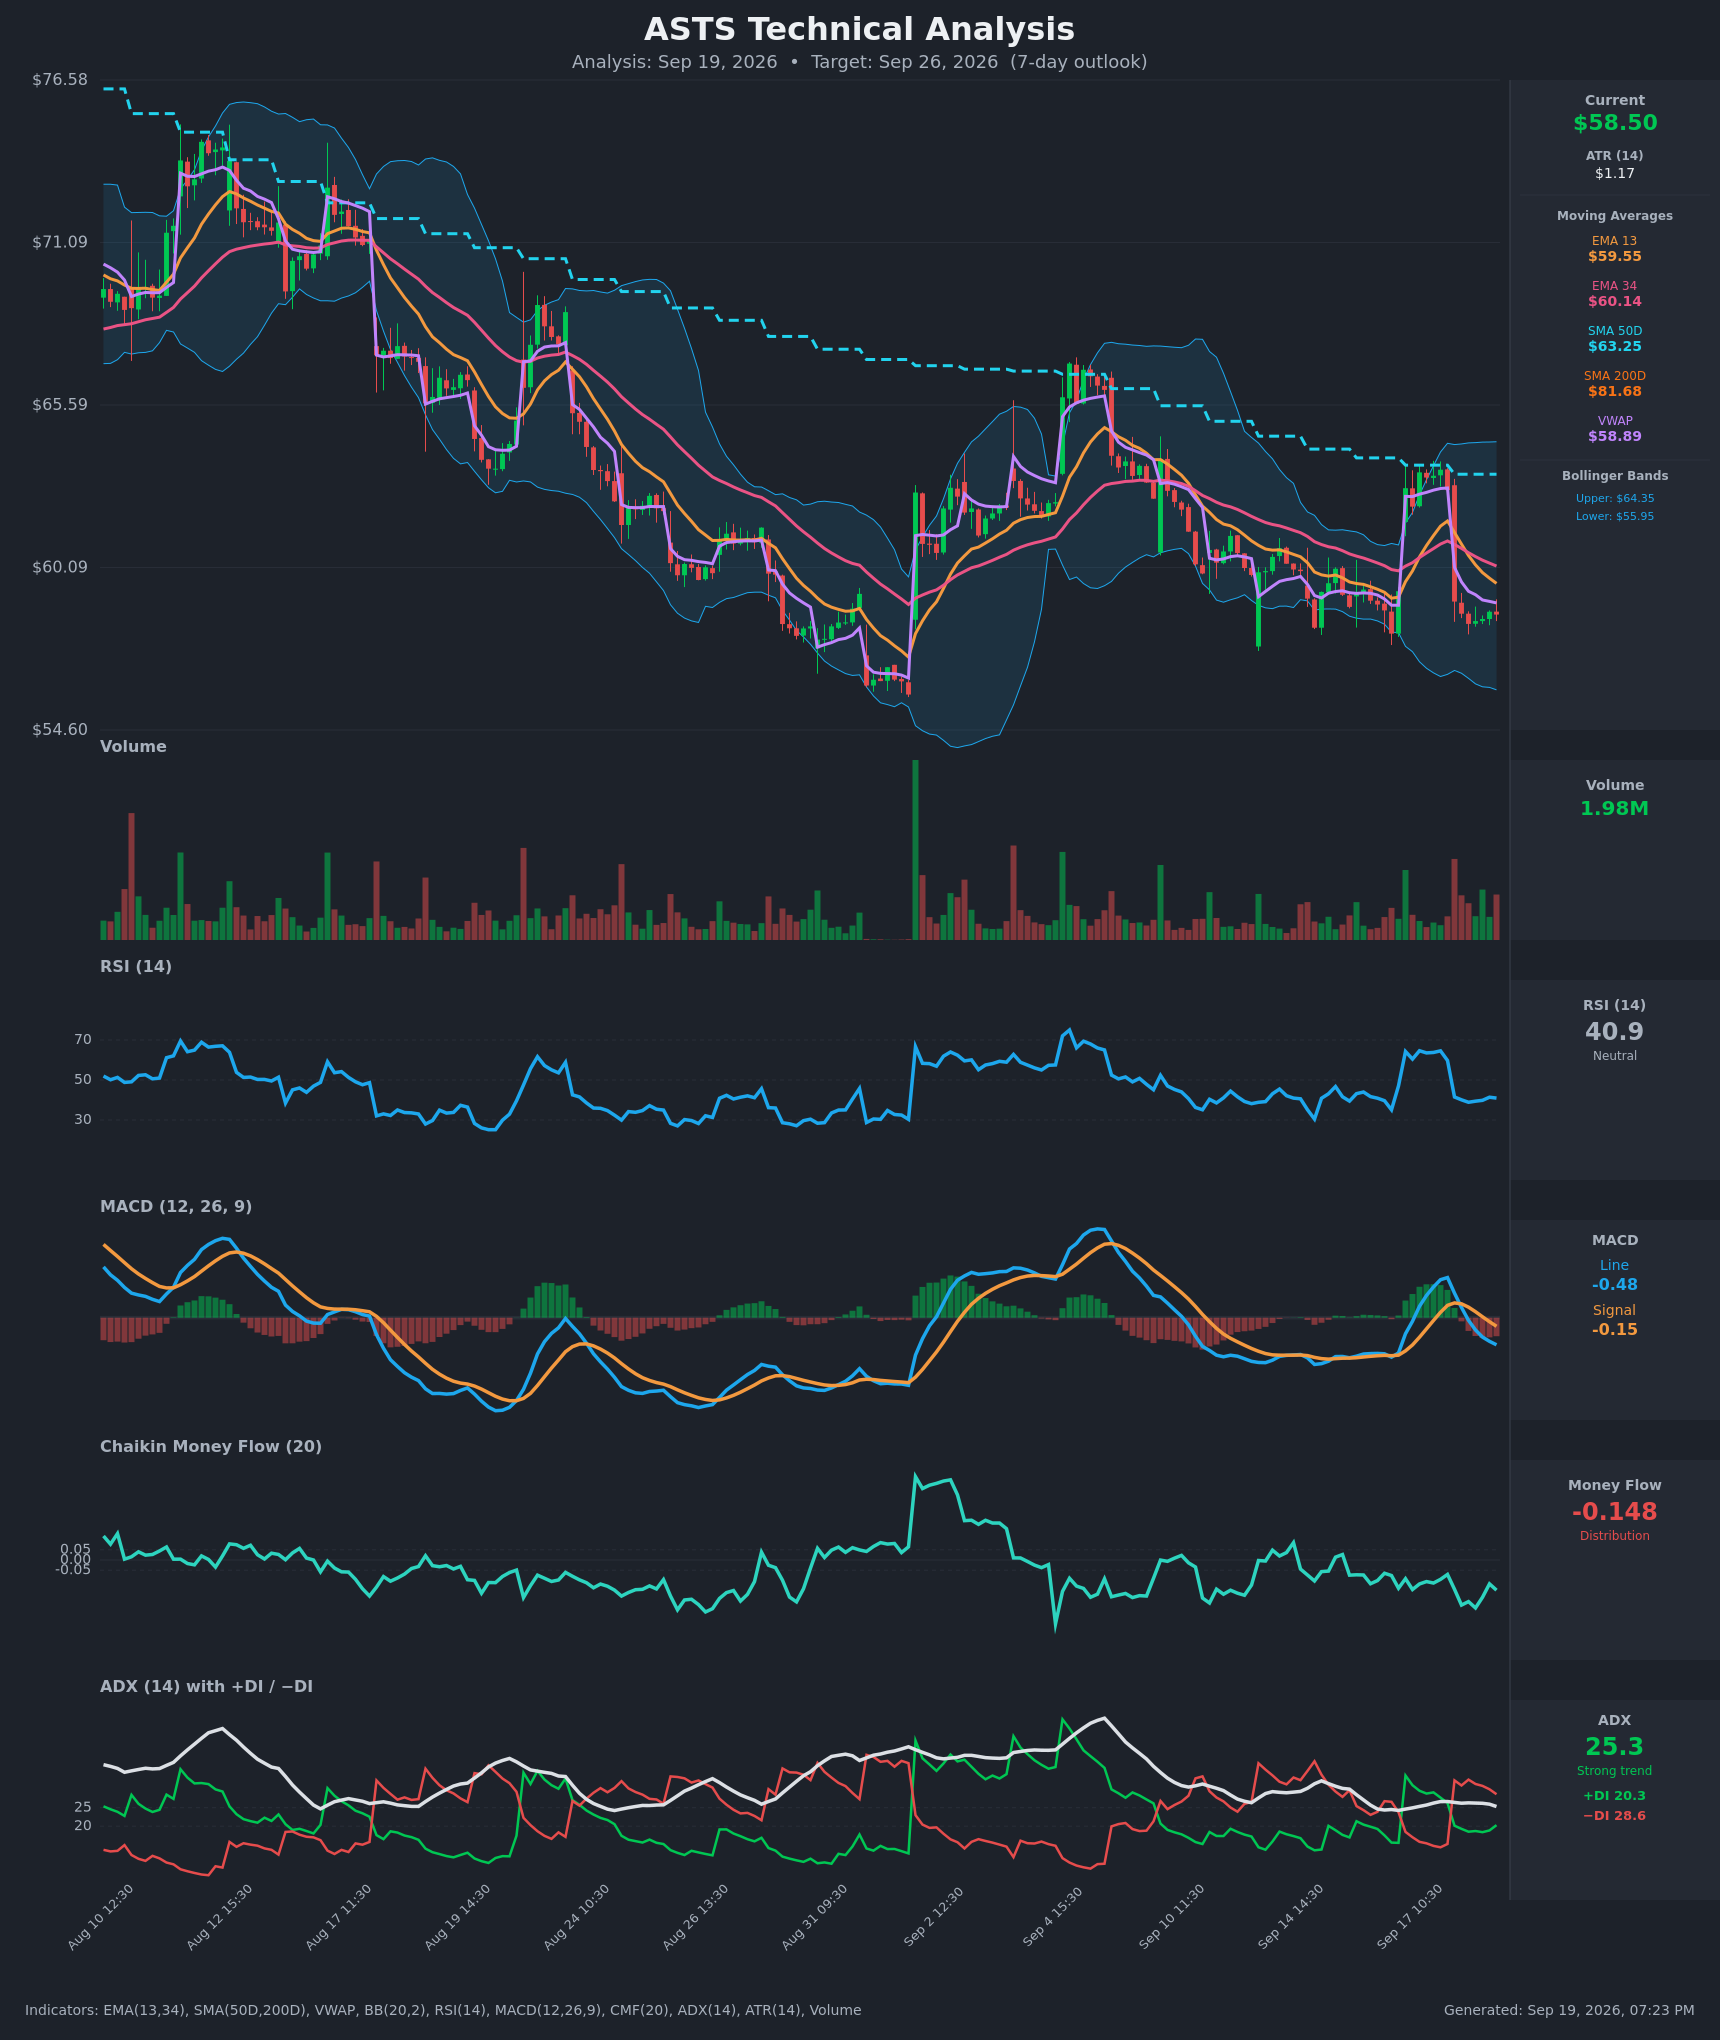
Full technical write-ups: 3-day report → · 6-day report →
4 · Three ways the next six days can go
If ASTS pushes toward the call wall ($65.00): that strike is doing double duty for this expiration — heaviest call open interest and max pain, the price where the most option value would expire worthless. Expirations sometimes gravitate toward that level, and it happens to sit above spot this week, so the pin case here is an upward pull. Above $65 the week's positioning thins quickly, with nothing substantial until the chain-wide $70 pile.
If ASTS drifts between the rails: the most likely outcome by the chain's own math. There's almost no net dealer hedging pressure attached to the September 25 contracts under the estimate, which means very little to pin price and very little to accelerate it. In that state the $61.09 twenty-day average overhead and the $57.27 shelf beneath do more work than the option structure does, and the week resolves as chop between roughly $56 and $61.
If ASTS breaks below the September 25 put wall ($51.00): that would require a 12.8% drop, more than the full expected move, so treat it as the tail rather than the base case. The realistic downside sequence runs $57.27, then $55.70, then the $53.07–$53.22 zone where the swing shelf and the bottom of the implied range overlap. The estimated gamma flip level at roughly $20 is nowhere near in play, so the usual "hedging amplifies the selling" framing does not apply this week — a break lower would be plain trend continuation, not a mechanical cascade.
5 · Three defined-risk structures
Prices are end-of-day midpoints as of 2026-09-18. All structures are hypothetical. Verify live prices before trading — these will be stale by the open.
If you expect the range to break either way: long September 25 strangle
- Trade: Buy the September 25 $58 put and buy the September 25 $60 call
- Debit: $3.28 ($1.81 + $1.465) · Max loss: $327.50 per 1-lot (the debit) · Max profit: uncapped to the upside, substantial to the downside · Break-evens: $54.73 and $63.28
- Why it fits: This is the direct expression of the premium math. Options are priced about 11 vol points below what ASTS has actually delivered over the past twenty sessions, and IV rank is 4.6/100 — you are buying movement at the cheap end of its own year. Both break-evens sit inside the $53.22–$63.82 implied range, and the bias is genuinely neutral, so paying for both directions is honest rather than lazy. A debit structure is the right family this week; selling premium here is the thing to avoid.
- Makes sense only if: you believe the last two weeks' daily swings (a 4.4% gap up, a 6.7% reversal) continue rather than settle. If ASTS goes quiet, this loses slowly and certainly.
- Invalidated if: ASTS sits inside $56–$61 with implied volatility unchanged by the September 22 checkpoint — that is the theta bill arriving with nothing to show for it.
- Managing it: take profit on the winning leg at roughly a 1σ move ($53.22 or $63.82) rather than holding for more; exit the whole position by September 23 if price is still within a dollar of $58.52. With the short-term direction fighting the longer trend, don't hold either leg into the final session.
- Liquidity note: the $58 puts traded $1.76/$1.86 — 10¢ wide on about $190,000 of premium — and the $60 calls $1.43/$1.50, 7¢ wide and the single heaviest contract in the expiration at roughly $295,000. Both fill cleanly for this name.
- Analyze this position →
If you lean bearish: long September 25 $60/$55 put debit spread
- Trade: Buy the September 25 $60 put, sell the September 25 $55 put
- Debit: $2.28 ($2.975 − $0.70) · Max profit: $272.50 · Max loss: $227.50 · Break-even: $57.73
- Why it fits: You pay a debit up front and profit as price falls toward the short strike — this is the technical divergence expressed with defined risk. Both chart horizons target $56.90–$57.20, which sits between the break-even and the short strike, and the short $55 leg sells exactly the level the whole chain treats as its heaviest put strike. Because premium is thin rather than rich, paying for the long leg costs less than it usually would.
- Makes sense only if: you weight the aligned downtrend and the negative money-flow reading above the call-heavy option flow.
- Invalidated if: ASTS closes above $60.14, which is also the technical models' own stated invalidation.
- Managing it: close at roughly 60% of maximum value rather than holding for the last few cents of intrinsic; with the near-term direction fighting a $65 max pain magnet above, take profits earlier than you'd like.
- Liquidity note: the $60 puts traded $2.85/$3.10 — 25¢ wide, but on about $273,000 of premium — and the $55 puts $0.68/$0.72, just 4¢ wide. Work the long leg with a limit inside the spread.
- Analyze this position →
If you lean bullish: long September 25 $60/$65 call debit spread
- Trade: Buy the September 25 $60 call, sell the September 25 $65 call
- Debit: $1.03 ($1.465 − $0.435) · Max profit: $397 · Max loss: $103 · Break-even: $61.03
- Why it fits: It sells exactly the level the week's positioning is most likely to stall at — $65 is simultaneously the September 25 call wall and max pain, so the short strike is placed where the chain says upside gets capped. Nearly four-to-one payoff for a 2.6% move to break even, funded by cheap volatility and Friday's four-to-one call-side sweep imbalance.
- Makes sense only if: ASTS reclaims $60.14 early in the window; without that, this is a lottery ticket against an intact downtrend.
- Invalidated if: ASTS closes below $55.70.
- Managing it: this is a cheap spread that dies quietly — size it as a loss you're happy to take in full, and close if price is still under $59 on September 23.
- Liquidity note: the $60 calls traded 7¢ wide and the $65 calls $0.42/$0.45, 3¢ wide on 3,150 contracts. This is the cleanest fill in the expiration.
- Analyze this position →
If none of these: no trade — and specifically, don't sell the condor
The obvious-looking setup this week is the one to skip. A short iron condor around the $51 and $65 walls looks tempting when a stock is rangebound and the walls are far apart — but you'd be collecting premium that has been running roughly 11 vol points below what ASTS actually delivers, at an IV rank of 4.6 out of 100. That is the textbook definition of getting paid too little for a short-gamma position in a name that has moved 4–7% in a single session twice in the past week. If you don't want to own premium and you don't have a directional view, standing aside is the correct fourth option here.
6 · Quick FAQ
What is ASTS's expected move this week? ±$5.30, or ±9.05%, into the September 25 expiration — a $53.22–$63.82 range around the $58.52 close, per the options market's straddle pricing as of 2026-09-18.
Is ASTS expected to go up or down over the next six days? Options positioning as of September 18 reads neutral — bullish short-dated sentiment and call-side flow offset by a steepening put skew and an aligned downtrend — but that's a read of what traders have done, not a forecast. The actionable map is the $53.22–$63.82 range with $51.00 and $65.00 as the positioning rails.
Are ASTS options expensive right now? No. IV rank of 4.6/100 says option prices are lower than about 95% of the past year's readings; on top of that, they're running roughly 11 vol points below the movement ASTS has actually delivered, a gap thinner than about 59% of this stock's own recent readings. That combination favors owning premium over selling it.
Where is ASTS's biggest options support and resistance? For the September 25 expiration, the put wall is $51.00 and the call wall is $65.00. Across the whole chain combined those levels sit at $55.00 and $70.00 — the near-dated pair is what governs this week.
What invalidates this week's read? A close below $55.70.
Methodology & disclosures. Data: end-of-day options-chain snapshot for ASTS, 2026-09-18, generated 2026-09-19T19:23:05.052Z. Prices shown are midpoints and will differ from live markets. Momentum/positioning scores and volatility-premium comparisons are descriptive measurements of past option flow and past price movement — not investment advice, signals, forecasts, or guarantees. All trade structures are hypothetical. Every structure shown has a defined maximum loss; you can lose the entire max-loss amount. Options involve substantial risk and are not suitable for all investors.