ASTS Options Are Pricing a $4.71 Move Into October 30, and Our Read Sees a Two-Sided Range
ASTS options imply a $35.08–$44.50 range into the October 30 expiration, with the $38 put wall just under the stock and max pain up at $45. Friday's flip to call-buying is real but fragile inside a steep downtrend, so our read is neutral. Below: the levels that matter and three defined-risk structures.
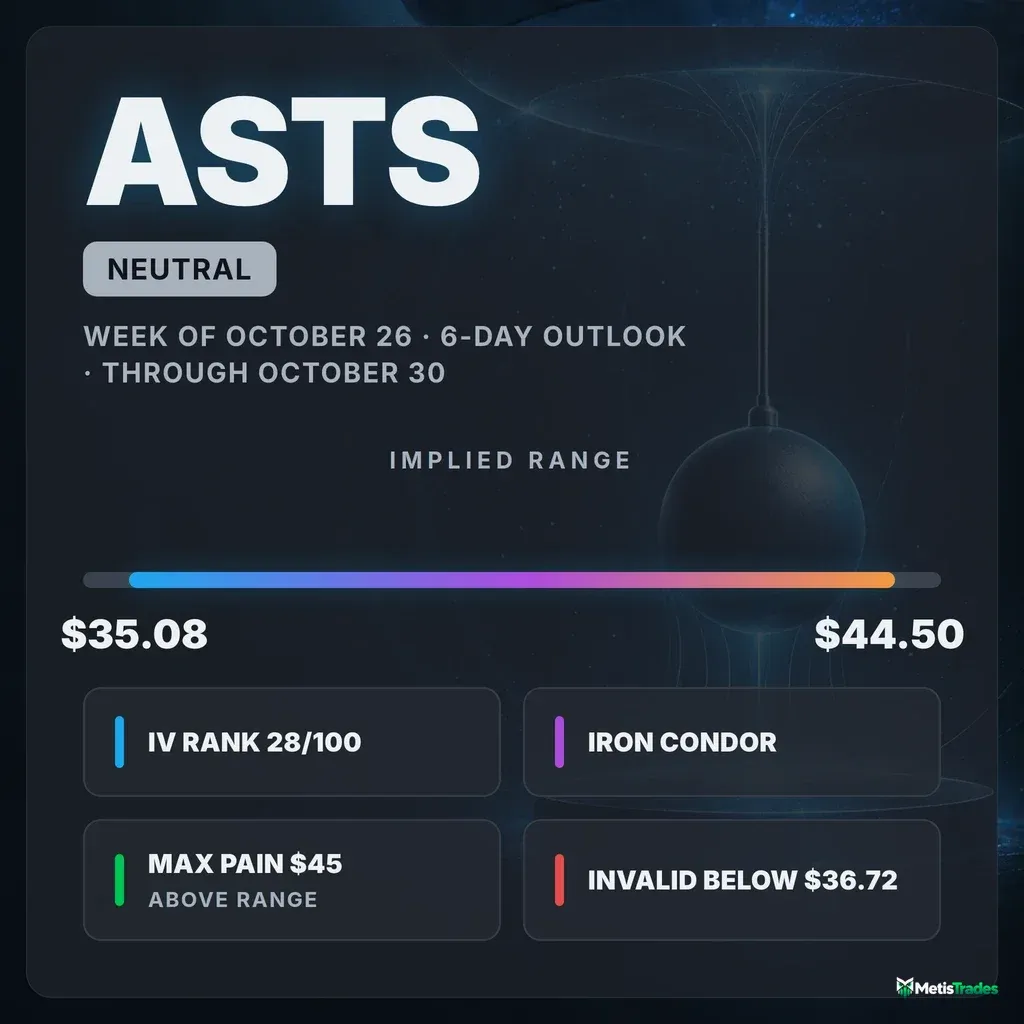
The options market implies a $35.08–$44.50 range for ASTS into the October 30 expiration. Here's what's driving it, where the key levels sit, and three defined-risk ways to trade it.
Published Saturday, October 24, 2026 · Data as of Friday, October 23, 2026 close
Explore the live ASTS options data in the Detailed Options Analyzer →
Quick answer
| Item | Answer |
|---|---|
| Market bias | Neutral |
| Options-implied range (into Oct 30) | $35.08 – $44.50 (±11.84%, about ±$4.71) |
| Major support | $38.00 (Oct 30 put wall); whole-chain heaviest put strike $40 |
| Major resistance | $60.00 (Oct 30 call wall). Nearer friction sits at $40.66 and $45 |
| Max pain (Oct 30) | $45.00 |
| Dealer gamma regime (estimate) | Negative: hedging tends to amplify moves. Flip level ≈ $5 (whole-chain estimate, far below spot, so there's no nearby pivot) |
| Volatility condition | Rising. IV rank 28/100 (ATM IV 95.16%). Premium is rich: options are priced ~11.7 vol pts above delivered movement (earnings-inflated) |
| Next earnings | November 13 (after close), 14 days after the Oct 30 expiration |
| Technical check | Mixed. The 3-day model is bearish (target $39.10, range $38.30–$40.90). The 6-day model is bullish (target $40.50, range $38.30–$41.50). |
| Best-fitting strategy | Iron condor (Oct 30 $34/$36 put spread + $44/$46 call spread), only if you accept two-sided risk |
| Analysis invalidated if | ASTS closes below $36.72 |
1 · What matters today
Our read on ASTS for the six days through October 30 is neutral. The main reason is that the evidence pulls both ways.
- The bullish pull: Friday's flow swung abruptly from heavily bearish to call-buying.
- The bearish pull: that swing came inside a downtrend that has cut the stock by about 36% in a month, and put activity is still running well above normal for this name.
The options market is pricing a move of about $4.71 either way, which is a $35.08 to $44.50 range around Friday's $39.79 close. The biggest pile of put contracts for that expiration sits at $38, just under the stock. A close below $36.72, the 52-week low, breaks the range read.
With the November 13 earnings report on the calendar, options expiring after that date carry extra premium. The two chart models split: bearish over three days, mildly bullish over six.
2 · What the options market is pricing
What changed this week
Price. ASTS slipped 2.1% over the past five sessions, from $40.66 to $39.79. It touched $38.77 on October 22 before bouncing Friday. That small weekly loss sits on top of a much bigger slide: down about 36% over a month and about 44% over the last ~50 sessions. The short-, medium- and longer-term trend reads all still point down.
Put building. The put/call open-interest ratio (how many put contracts are held open for every call) climbed from 0.71 to 0.91 over five days. Its 14-day average is 0.80, so traders added downside protection steadily all week. The single biggest non-expired build was in the October 30 $37 puts: open interest jumped from 307 to 1,966 contracts. The October 30 $38 puts added 693 to reach 2,515, which made $38 that expiration's put wall. Into Friday's expiration, the now-settled October 23 $40 calls also added 2,255 contracts, a last-day bounce bet.
Implied volatility. IV barely moved on the week (+1.6%). IV rank is 28, near its 7-day average of 27 and well above its 14-day average of 20.
The Friday turn. Our options-flow momentum gauge eased to −24 from a 7-day average of −55. Flow turned sharply less bearish on Friday after a week of heavy put-leaning readings. One good day doesn't undo a 36% monthly slide, which is why we don't chase it.
Expected move
The expected move is the move the options market is pricing in, derived from what straddles cost. For the October 30 expiration it's ±11.84%, or about $4.71 either way from the $39.79 chain price: a range of $35.08 to $44.50.
That number comes from the October 30 at-the-money implied volatility of 85.5%. Implied volatility (IV) is the market's estimate of how much ASTS will move, baked into option prices.
| Expiration | Implied move | Range around $39.79 |
|---|---|---|
| October 30 | ±11.84% | $35.08 – $44.50 |
| November 6 | ±17.46% | $32.84 – $46.74 |
| November 13 | ±23.6% | $30.40 – $49.18 |
| November 20 | ±26.87% | $29.10 – $50.48 |
The rungs widen quickly. Even the 6-day window prices a near-$10 swing from top to bottom, and the mid-November rungs bracket the earnings report, which is where the steepest premium lives (see below).
Volatility
IV level and rank. The headline at-the-money IV is 95.16%. IV rank is 28/100, which shows where today's IV sits versus the past year: 28/100 means option prices are cheaper than 72% of the past year's readings by that range-based measure. The IV percentile is lower still, at 22.
IV direction. The shorter view looks different. IV is about 21% above its 30-day average of 78.9% and up 37% over 30 sessions, though roughly in line with its 90-day average of 90.9%. It slipped 1.6% on Friday. So options got much more expensive during October's selloff and have held there. The front-month term-structure read (comparing option prices across different expiration dates) is unavailable today because Friday was an expiry day.
Realized movement. ASTS's 20-day realized volatility is 83.5%, about typical for this stock's own recent history. But the past five sessions have been noticeably calmer than the past month: the short-versus-month realized-volatility ratio is running well below this stock's norm. The stock has been grinding rather than lurching lately.
Premium rich or cheap. The volatility risk premium is the gap between how much movement options are priced for and how much ASTS has actually delivered. When it's positive, option sellers have been collecting more than realized movement cost them. Today options are priced about 11.7 vol points above what ASTS has delivered over the past 20 days. That reading is at the 93rd percentile versus this stock's own recent readings, meaning richer than 93% of them, and the gap is running well above its norm.
The gap has widened fast, from under 3 points on October 14 to 14 points on October 22. That combination normally favors collecting premium. The caveat: some of that richness is the market pre-pricing the November 13 report, not free premium. Treat it as a reason to keep any premium selling short-dated and expiring before the report, not as an edge in itself.
Earnings on the calendar
ASTS reports on November 13, after the close. That's two weeks after the October 30 expiration, so nothing in this article's window spans it.
The chain prices the report further out. ATM IV climbs from 85.5% for October 30 to about 98% for November 13 and 97% for November 20. November 20 is the first rung that actually expires after the report, and its implied move reaches ±26.87%.
The last four reports all showed wider losses than expected. Most recently, ASTS reported a $0.44 loss against an expected $0.28 loss.
Skew and sentiment
Skew. Puts and calls the same distance from the stock price don't cost the same; when puts are pricier, traders are paying up for crash protection. On ASTS it's the reverse today. 25-delta calls carry 99.9% IV versus 93.8% for puts, so calls cost about 6.1 vol points more. That's almost exactly this stock's 60-day norm of 6.2 points.
The story is the path. During the selloff, puts briefly cost as much as or more than calls; the 7-day average skew was close to flat. That protection premium bled off over the last five sessions.
Put/call ratios. The put/call volume ratio shows how much put activity there is relative to calls; above 1 means puts dominate. It read 0.82, close to its 7-day average of 0.85 and above its 14-day average of 0.70. Put trading is running unusually heavy for ASTS versus its own recent norm.
At the same time, Friday saw an unusually large one-day build in call open interest (contracts currently held open): roughly 14,000 calls added against about 1,200 puts closed. Total option volume was light, at about 0.63× its 20-day average.
Sentiment by expiration. Sentiment in short-dated options is strongly bullish:
- The 0–7 day reading is +78. It rests on a single input, call-side open-interest building, so treat it as one data point.
- The 7–30 day reading is a milder +21.
- The 60–120 day reading is slightly negative.
That pattern reads as a leveraged front-end chase: traders grabbing cheap near-dated calls for a bounce, while longer-dated money stays unconvinced. We read it as bounce speculation inside an intact downtrend, not a trend change.
The key levels map
| Level | Price | Why it matters |
|---|---|---|
| 100-day moving average | $65.78 | Long-term trend line, far overhead |
| Call wall (Oct 30 and whole chain) | $60.00 | Heaviest call open interest (8,965 for Oct 30; 27,154 chain-wide). It's a barrier only in theory this window |
| 50-day moving average | $57.68 | Price is 31% below it |
| Swing resistance | $53.07 | Nearest heuristic pivot-cluster resistance |
| 20-day moving average | $50.66 | Where the month's average close sits, 21% above spot |
| Large gamma strike | $50 | Third-largest concentration of gamma in the chain |
| Max pain (Oct 30) / gamma strike | $45.00 | Where the most Oct 30 option value expires worthless, and the second-largest gamma strike |
| Implied range top (Oct 30) | $44.50 | Upper edge of the expected move |
| TA upper Bollinger Band | $41.64 | Chart models' bounce ceiling |
| TA EMA 34 | $40.66 | First resistance both chart models flag |
| Oct 22 gap zone | $39.01 – $40.90 | Gap-down area the stock is trying to work back into |
| Whole-chain put wall / largest gamma strike | $40 | 31,504 puts open across all expirations, sitting right on top of spot |
| Friday close | $39.79 | Reference price |
| Put wall (Oct 30) | $38.00 | Heaviest put open interest for the target expiration (2,515), and it grew all week |
| TA lower Bollinger Band | $37.56 | 3-day model's support |
| 52-week low | $36.72 | A close below it is a new low and breaks the range read |
| Implied range bottom (Oct 30) | $35.08 | Lower edge of the expected move |
| Large gamma / put strike | $35 | 15,392 puts open chain-wide, the next big downside magnet |
| Gamma flip (estimate) | ≈ $5 | Rough whole-chain estimate, too far away to act as a pivot |
Positioning and unusual flow
Dealer gamma. Market makers hedge the options they've sold. One rough estimate puts ASTS in a negative-gamma regime, both for the October 30 expiration and for the chain as a whole. In that regime their hedging tends to amplify moves rather than dampen them, which fits a stock that has been averaging 80%-plus annualized realized volatility.
Unusual contracts. Friday's standouts were two-sided:
- October 30 $39 calls: 1,832 contracts against just 269 previously open, about 6.8× turnover and roughly $433,000 in premium. This is a direct bounce bet.
- October 30 $40 calls: 1,371 contracts against 394 open, about $247,000 in premium.
- October 30 $36 and $35 puts: 1,402 and 1,580 contracts, with open interest up 493 and 337 respectively. Someone is still buying protection under the 52-week low.
Calls near the money and puts below the low point to a market braced for movement, not one with a settled direction.
3 · Technical check
3-day report. The near-term chart model leans bearish, targeting $39.10 by October 27 with a range of $38.30 to $40.90. Its case:
- ADX near 40 with sellers in control.
- Price below all its key moving averages.
- A relief bounce running into EMA 34 resistance at $40.66 on light volume.
Its dominant scenario is invalidated by a close above $41.65. The target sits well inside the options-implied range, so this is a mild directional divergence from our neutral read, not a magnitude disagreement.
6-day report. The longer model, which matches the October 30 expiration, leans bullish. It targets $40.50 with a range of $38.30 to $41.50. It leans on the MACD bullish cross and RSI's rebound from deeply oversold levels, with support at $38.07 and resistance at $40.66.
Read together. Two opposite-leaning models with targets 1.4 dollars apart, both straddling spot and both inside the implied range, effectively confirm a range-bound week.
Model vs. Market: The options market implies $35.08 – $44.50 into October 30; the 6-day technical model targets $40.50 (range $38.30 – $41.50). The chart model expects a far tighter week than options are pricing, a gap that only resolves if ASTS breaks decisively out of the $38–$41 band.
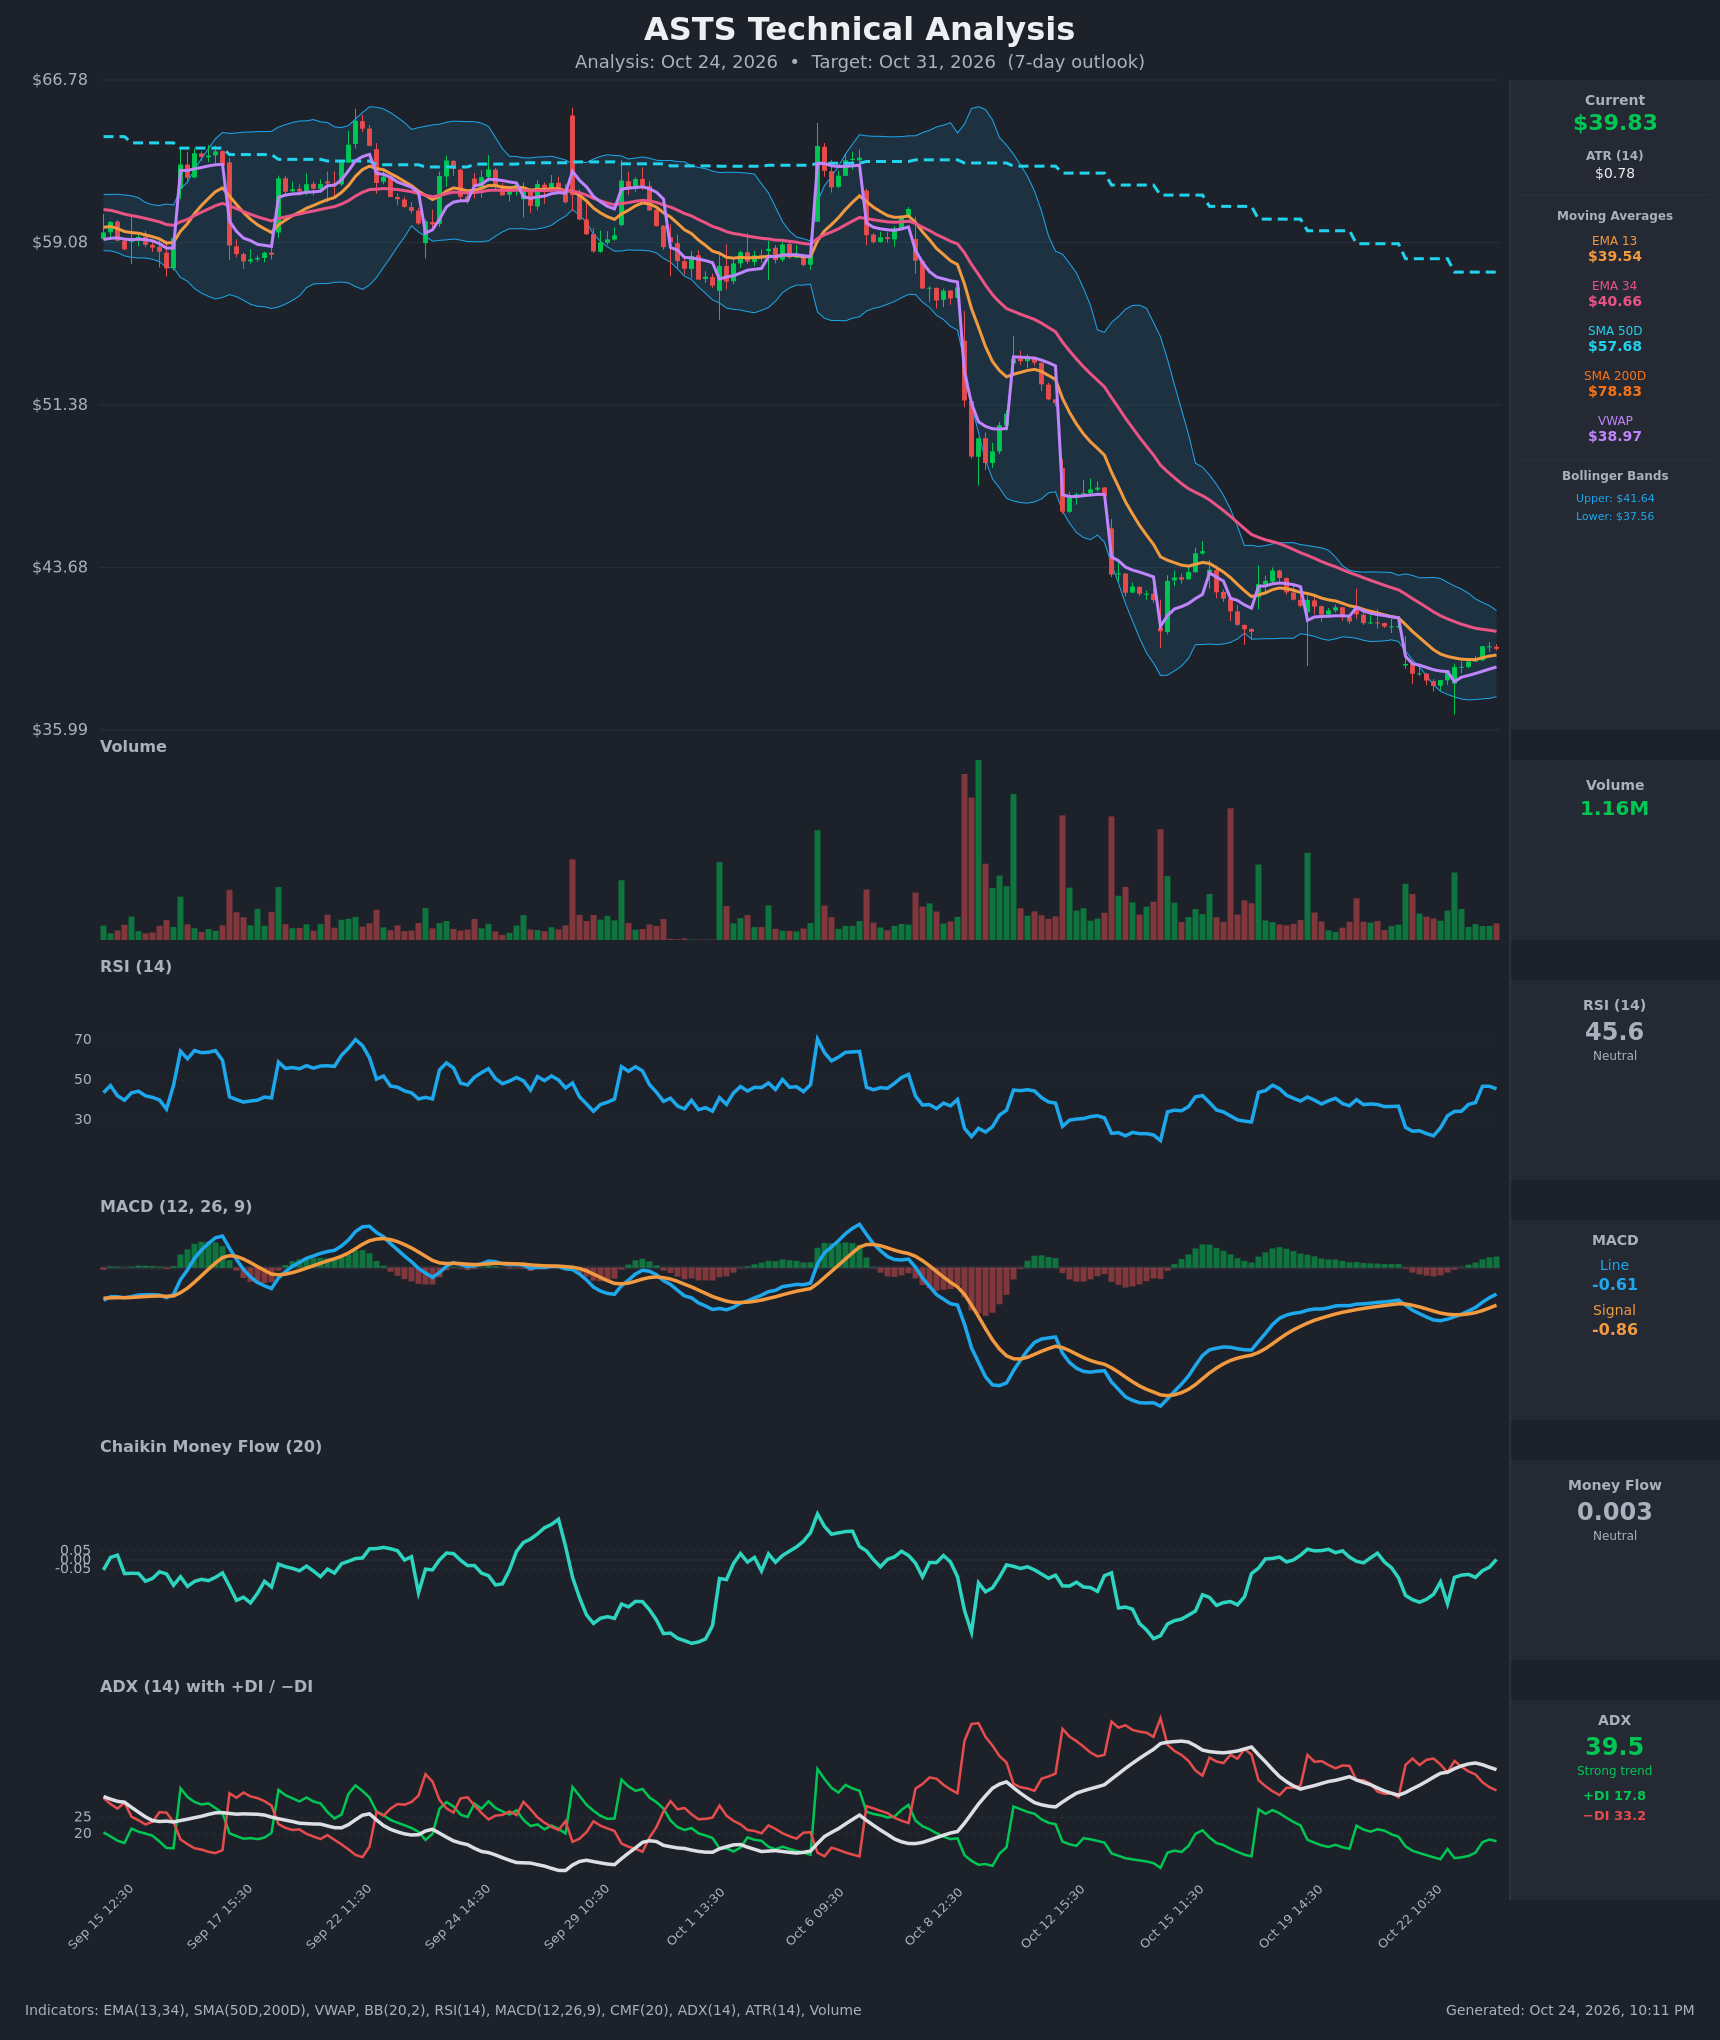
The TA did shape strike selection. The bear put spread's lower strike sits near the $37.56 lower band, and the condor's short call is parked above the models' $41.50–$41.64 ceiling.
Full technical write-ups: 3-day report → · 6-day report →
4 · Three ways the week can go
If ASTS pushes up toward max pain ($45): The October 30 call wall is so far away, at $60, that it won't cap anything this window. The real overhead tests are the $40.66–$41.64 technical band and then the $44.50 top of the implied range. A move into the mid-$40s would carry ASTS toward the $45 max-pain strike, where expiring open interest is most balanced. In a negative-gamma regime, a clean break above $41.64 can extend faster than usual, because hedging adds fuel rather than friction.
If ASTS drifts between $38 and $41: This is the base case. The October 30 put wall at $38 sits under the stock, the chain-wide $40 put strike sits right at spot, and both chart models' ranges live inside this band. Heavy put open interest just below price tends to attract hedging activity around it. A choppy drift that bleeds option premium on both sides is what the condor below is built for.
If ASTS breaks below the put wall ($38): Losing $38, and then the $36.72 52-week low, would put the stock into the zone where the $36 and $35 puts were being bought Friday. The rough dealer-gamma estimate is already negative, so hedging is more likely to accelerate selling than cushion it. The next big open-interest shelf sits at $35, near the bottom of the implied range at $35.08.
5 · Three defined-risk structures
Prices are end-of-day midpoints as of Friday, October 23, 2026. All structures are hypothetical. Verify live prices before trading — these will be stale by the open.
If you lean bullish: October 30 $38/$36 bull put spread
- Trade: Sell the Oct 30 $38 put ($1.065 mid), buy the Oct 30 $36 put ($0.495 mid). You collect a credit and win if ASTS stays above $38 at expiration.
- Credit: $0.57 ($57 per spread) · Max profit: $57 · Max loss: $143 · Break-even: $37.43
- Why it fits: The short strike sits right at the October 30 put wall, the level that grew all week. Option premium is running about 11.7 vol points over delivered movement, so the seller collects a fat price for a two-dollar-wide spread.
- Makes sense only if: You think Friday's call-buying bounce at least holds the $38 shelf.
- Invalidated if: ASTS closes below $38.
- Earnings exposure: Expires 14 days before the November 13 report, so there's no earnings-gap risk.
- Managing it: Close at about 50% of max credit. Exit regardless by October 29. If ASTS closes through $38, close rather than hope. All three trend reads still point down, so take profits early.
- Liquidity note: The $38 puts quoted 7¢ wide ($1.03/$1.10) and the $36 puts 5¢ wide ($0.47/$0.52). Fills near mid are realistic.
- Analyze this position →
If you expect the range to hold: October 30 $34/$36/$44/$46 iron condor
- Trade: Sell the $36 put / buy the $34 put, and sell the $44 call / buy the $46 call, all October 30. You collect premium and win if ASTS finishes between the short strikes.
- Credit: $0.535 (put side $0.30 + call side $0.235), or $53.50 per condor · Max profit: $53.50 · Max loss: $146.50 · Break-evens: $35.47 and $44.54
- Why it fits: The break-evens line up almost exactly with the $35.08–$44.50 implied range. The short put sits below the $38 wall and the 52-week low. The short call sits above both chart models' ceilings. This is our best-fitting structure for a neutral read with rich premium.
- Makes sense only if: You accept that a negative-gamma stock can break either edge quickly. This is a bet on chop, not calm.
- Invalidated if: ASTS closes below $36.72 or above $44.50.
- Earnings exposure: Expires 14 days before the November 13 report, so there's no earnings-gap risk.
- Managing it: Close at 40–50% of the credit. Exit by October 29 at the latest to avoid expiration-day gamma. The $45 max pain sits just above the short call, so close the call side if ASTS trades above $43.
- Liquidity note: The short legs are tight: the $36 puts are 5¢ wide and the $44 calls 3¢ wide ($0.52/$0.55). The wings are wide in percentage terms: the $34 puts are 7¢ on a 19.5¢ mid and the $46 calls 10¢ on a 30¢ mid. Work limit orders near mid or expect slippage.
- Analyze this position →
If you lean bearish: October 30 $39/$37 bear put spread
- Trade: Buy the Oct 30 $39 put ($1.47 mid), sell the Oct 30 $37 put ($0.755 mid). You pay a debit and profit if ASTS falls toward $37.
- Debit: $0.715 ($71.50 per spread) · Max profit: $128.50 · Max loss: $71.50 · Break-even: $38.29
- Why it fits: It targets the 3-day model's $37.56 lower-band support and the busy $37 put strike. Selling the $37 put offsets much of the rich premium you'd otherwise overpay for a lone put.
- Makes sense only if: Friday's bounce fails at the $40.66 EMA 34, as the 3-day model expects.
- Invalidated if: ASTS closes above $41.65.
- Earnings exposure: Expires 14 days before the November 13 report, so there's no earnings-gap risk.
- Managing it: Take profits around $1.20 of spread value. Exit by October 29. Cut the trade on a close above $41.65 rather than waiting for expiration.
- Liquidity note: The $39 puts quoted 14¢ wide ($1.40/$1.54) and the $37 puts 15¢ wide ($0.68/$0.83). That's workable, but don't pay the ask on both legs.
- Analyze this position →
If none of these: no trade
Standing aside is a real option this week. The premium looks rich, but part of that richness reflects the November 13 report rather than easy money. In a negative-gamma stock, a 7-day credit position can go from comfortable to max loss in a single session.
Each structure also risks about $1.40 to make about $0.55, or $0.70 to make $1.30. Those trades are only worth taking with a clear view. With the flow, the chart models, and the trend all disagreeing, "no edge" is an honest conclusion.
6 · Quick FAQ
What is ASTS's expected move into October 30? About ±$4.71 (±11.84%), a $35.08–$44.50 range, per straddle pricing as of the October 23 close.
Is ASTS expected to go up or down over the next week? Options positioning as of October 23 reads neutral. Friday's call-buying burst runs against a steep downtrend and still-heavy put activity. That's a read of what traders have done, not a forecast. The actionable map is the $35.08–$44.50 range, the $38 put wall, and the $45 max pain.
Are ASTS options expensive right now? Two lenses give different answers:
- Versus the past year: IV rank 28/100 says option prices are lower than 72% of the past year's readings.
- Versus actual movement: options are running about 11.7 vol points above the movement ASTS has delivered, richer than 93% of this stock's own recent readings.
Some of that richness is the market pricing the November 13 report.
When is ASTS's next earnings report? November 13, after the close. That's after the October 30 and November 13 expirations, which is why options from November 20 onward carry noticeably more premium.
What invalidates this week's read? A close below $36.72, the 52-week low.
Methodology & disclosures. Data: end-of-day options-chain snapshot for ASTS, 2026-10-23, generated 2026-10-24T22:11:36.187Z. Prices shown are midpoints and will differ from live markets. Momentum/positioning scores and volatility-premium comparisons are descriptive measurements of past option flow and past price movement — not investment advice, signals, forecasts, or guarantees. Earnings dates and reported results are from the data provider's earnings feed as of 2026-10-24T22:11:36.187Z; report dates can change. All trade structures are hypothetical. Every structure shown has a defined maximum loss; you can lose the entire max-loss amount. Options involve substantial risk and are not suitable for all investors.