IREN Options Are Pricing a $4.98 Move by September 25 — And the Walls Are Only $8 Apart
The options market implies a $41.70–$51.66 range for IREN into the September 25 expiration, with the heaviest call open interest at $50 and the heaviest put open interest at $42. Here's what Friday's flow actually showed, and three defined-risk ways to trade the corridor.
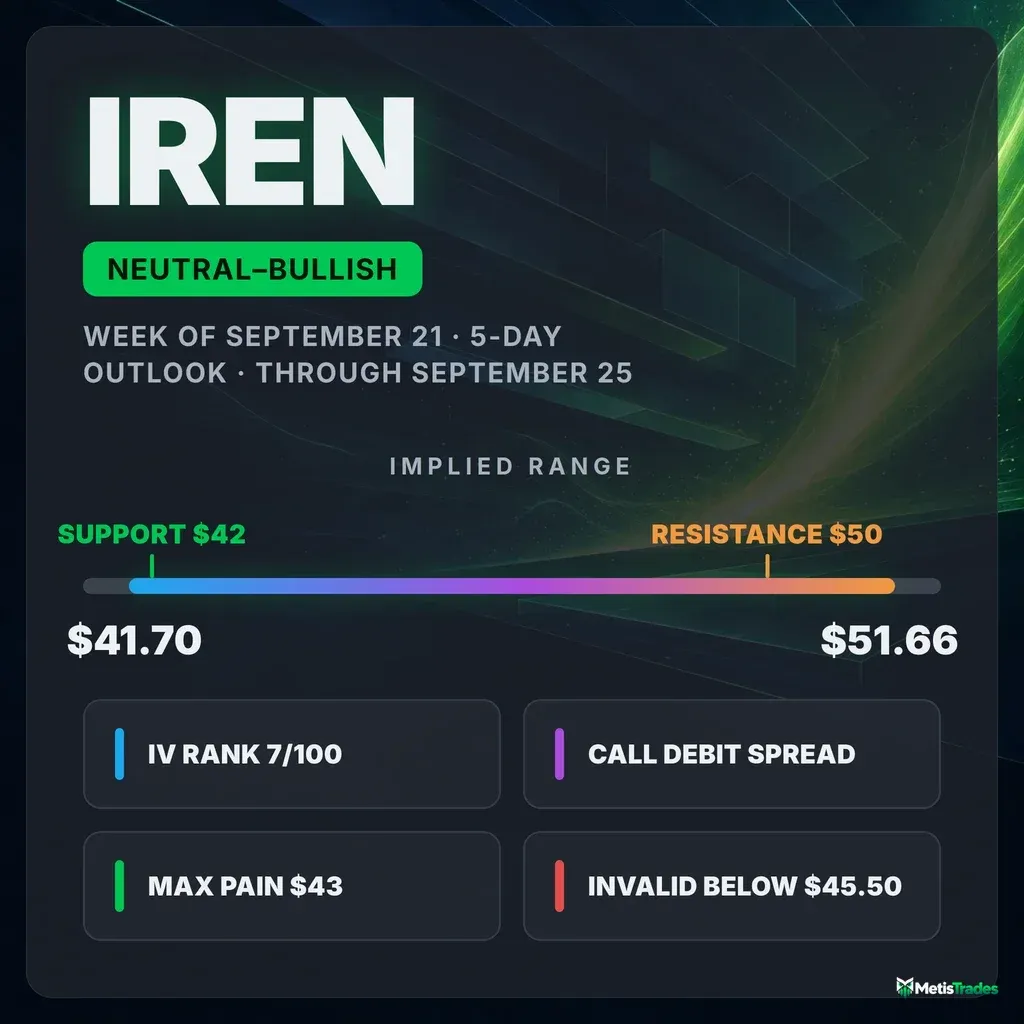
The options market implies a $41.70–$51.66 range into the September 25 expiration; here's what's driving it, where the walls sit, and three defined-risk ways to trade it.
Published Sunday, September 20, 2026 · Data as of Friday, September 18 close
Explore the live IREN options data in the Detailed Options Analyzer →
Quick answer
| Item | Answer |
|---|---|
| Market bias | Slightly bullish |
| Options-implied range (into September 25) | $41.70 – $51.66 (±10.67%) |
| Major support | $42.00 (put wall, September 25 expiration) |
| Major resistance | $50.00 (call wall, September 25 expiration) |
| Max pain (September 25) | $43.00 |
| Dealer gamma regime (estimate) | Positive — hedging tends to dampen moves; flip level ≈ $20 (rough estimate) |
| Volatility condition | Flat-to-quiet — IV rank 6.54/100 · premium thin: options priced about 5 vol points below delivered movement |
| Technical check | Confirms (bullish, 3-day and 5-day chart models) |
| Best-fitting strategy | September 25 $47/$50 call debit spread |
| Analysis invalidated if | IREN closes below $45.50 |
1 · What matters today
IREN closed Friday, September 18 at $46.68 after a 6.5% five-day run, and the options market is pricing roughly $4.98 of movement up or down — a $41.70 to $51.66 band — through the September 25 expiration. That is the move the options market is pricing in, derived from what straddles cost, and at ±10.67% over five sessions it is a wide corridor for a wide-moving stock.
Our read of options flow leans slightly bullish: call-side open interest built aggressively on Friday, put activity thinned, and calls are actually priced above puts — the opposite of the usual crash-protection premium. The single most important number is $50.00, the strike holding the most call contracts for September 25; that pile tends to act as a ceiling. Below, $42.00 carries the heaviest put open interest. Both chart-model reads also point higher over the next few days. A close below $45.50 kills this view.
2 · What the options market is pricing
What changed this week
The last three sessions rewrote the near-term story. IREN gapped up three days running — +2.09% on September 16, +6.76% on September 17 and +2.81% on September 18 — closing +6.50% over five trading days and +9.58% over twenty. Option flow followed: put/call volume (how much put activity there is relative to calls — above 1 means puts dominate) printed 0.49 on Friday against a 7-day average of 0.57 and a 60-day median of 0.68, so traders leaned harder toward calls than they have been. The put/call ratio on open interest (contracts currently held open) slid from 0.86 to 0.82 over five sessions, versus a 14-day average of 0.90 — for every call contract held open there are now 0.82 puts, and that number has been falling.
The single biggest one-day build in open contracts among still-live expirations was the January 15, 2027 $37 put, which added 14,940 contracts to reach 18,395 — long-dated downside insurance, not a bet on next week. Closer in, the September 25 $50 call added 2,946 contracts on 7,525 shares of volume, which is exactly the strike that now caps the corridor. Chain-wide, call open interest grew by roughly 85,000 contracts against a 9,265-contract decline on the put side.
Implied volatility barely moved: ATM IV is 81.4%, up 0.73% on the day and 2.71% over five sessions, but down 26.15% over thirty. The short-, medium- and long-term trend reads all point the same way (price +6.5% over the past week, +9.6% over the past month, +11.9% over roughly two and a half months), so there's no horizon conflict to referee — though it is worth noting the flow engine flagged a bearish momentum crossover on September 15 that Friday's surge promptly ran over. This name whipsaws.
Expected move
Into September 25, the options market is pricing ±10.67%, or about ±$4.98 around the $46.68 close — a $41.70 to $51.66 range. That figure comes straight from what at-the-money straddles cost at that expiration.
| Expiration | Implied move | Range around $46.68 |
|---|---|---|
| September 25 (7 days) | ±10.67% | $41.70 – $51.66 |
| October 2 (14 days) | ±15.30% | $39.54 – $53.82 |
| October 16 (28 days) | ±22.50% | $36.18 – $57.18 |
The ladder scales almost exactly with the square root of time — the ATM implied volatility behind each rung sits in a tight 77%–81% band — which means there is no event bump anywhere in the next month. The curve is simply flat and high.
Volatility
ATM implied volatility across the chain is 81.4%, and the September 25 expiration's own at-the-money read is 77.1%. In absolute terms that is a big number; in IREN's own terms it is nothing. IV rank is 6.54/100 — where today's IV sits versus the past year, meaning option prices are cheaper than roughly 93% of the past year's readings — and the IV percentile is 2.79, so IREN's options have been more expensive than this on nearly every day of the past twelve months. Current IV also sits below both the 30-day average (90.8%) and the 90-day average (106.2%). The front-month read is unavailable today, an expiry-day artifact rather than missing data, so there is no term-structure comparison across expiration dates to make this session.
Two "vs its own norm" observations — comparisons against IREN's own recent history, not the broader market — are worth noting. Twenty-day realized volatility is 86.4%, which sounds enormous but is actually below this stock's own recent norm; and the last five sessions have moved at only about three-quarters the pace of the trailing month. IREN is, by its own standards, in a relatively calm stretch.
Premium rich or cheap: the gap between how much movement options are priced for and how much IREN has actually delivered is negative by about 5 vol points — implied volatility of 81.4% against 86.4% of delivered movement. When that gap is positive, option sellers have been collecting more than realized movement cost them; here it is the other way round. The percentile is 52, meaning today's gap is richer than about half of this stock's own recent readings — in other words, a modest negative gap is normal for IREN right now, and the snapshot reading confirms it is about typical for the name. The path matters too: the gap has compressed steadily from about −12 vol points in late August to roughly −0.6 on September 16 before widening again into Friday, with no sign flip. Combine an IV rank of 6.54 with a premium that has been running below delivered movement and the verdict is clear — this is a week to own optionality, not to sell it.
Skew and sentiment
Skew is the observation that puts and calls the same distance from the stock price don't cost the same — when puts are pricier, traders are paying up for crash protection. Here the reverse is true. The 25-delta skew is −2.4 vol points against a 60-day median of −0.6: the 25-delta put prints 82.0% implied volatility while the 25-delta call prints 84.3%. Calls cost more than equidistant puts, and by a wider margin than usual for this name. Traders are paying up for upside, not protection.
The flow tallies agree. Thirteen call contracts cleared the peer-relative unusual-volume bar on Friday against nine puts, a call-side tilt that is unusually heavy versus this stock's own recent history. The pace of new call open interest is likewise well above its norm. Sentiment in short-dated options reads "Bullish Recovery": the 0–7 day bucket scores a mild +10, but the 7–30 day bucket sits at +41 and the 60–120 day bucket at +34 — positioning is building further out the curve rather than in the immediate week.
The key levels map
| Level | Price | Why it matters |
|---|---|---|
| Implied-range top (Sep 25) | $51.66 | Upper edge of the ±10.67% band the options market is pricing |
| Swing resistance | $50.90 | Heuristic swing-pivot cluster from recent price structure |
| Call wall (Sep 25) | $50.00 | 7,595 contracts of call open interest — the heaviest at this expiration, and also the whole chain's largest call strike (104,431) and biggest gamma concentration; a genuine ceiling |
| Swing resistance | $49.24 | Prior pivot cluster |
| Chart-model resistance | $48.00 | Prior early-September swing high named by the 3-day technical report |
| 100-day moving average | $47.12 | Price is 0.93% below it — the last major average still overhead |
| Spot | $46.68 | Friday's close |
| Swing support | $45.82 | Nearest pivot support below spot |
| 200-day moving average | $45.54 | Reclaimed on Friday; price sits 2.50% above it |
| Swing support | $43.72 | Pivot cluster |
| Max pain (Sep 25) | $43.00 | The price where the most option value would expire worthless — expirations sometimes gravitate toward it; note it sits $3.68 below spot |
| Swing support | $42.24 | Pivot cluster |
| Put wall (Sep 25) | $42.00 | 7,305 contracts of put open interest — the heaviest at this expiration; the floor of the corridor |
| 20-day moving average | $41.83 | Price is 11.59% above it — stretched |
| Implied-range floor (Sep 25) | $41.70 | Lower edge of the priced band |
| 50-day moving average | $40.38 | Price is 15.60% above it |
| Whole-chain put wall | $30.00 | 97,267 puts across all expirations — far below spot, and a different strike from the September 25 wall; that is long-dated insurance, not a level for this week |
Worth saying plainly: the September 25 expiration's own walls ($50 call / $42 put) and the whole chain's aggregate walls ($50 call / $30 put) agree on the ceiling and disagree sharply on the floor. For a five-day trade, use $42.
Positioning and unusual flow
Market makers hedge the options they've sold, and one rough estimate of that positioning puts the September 25 expiration — and the chain overall — in a positive gamma regime, where hedging flows tend to dampen moves rather than amplify them. The same estimate places the gamma flip level near $20, far below spot; spot is sitting unusually far above that estimated pivot for this name. Treat all of that as an estimate built on an assumed dealer sign convention, not as observed dealer inventory.
Three non-expired flow items stood out on Friday:
- September 25 $50 calls — 7,525 contracts traded against 7,595 open, adding 2,946 contracts of open interest and about $658,000 of premium. Traders are actively building the very strike that caps the corridor.
- October 16 $55 calls — 5,033 contracts on 10,125 open, roughly $823,000 of premium. Upside positioning reaching well beyond the implied range.
- October 2 $45.50 puts — 1,056 contracts against just 9 open. Turnover of more than 100× open interest means this was fresh, same-day positioning, not an existing book being adjusted — a small hedge planted just under spot.
3 · Technical check
Both chart models line up with the options read. The 3-day model (target date September 23, the halfway checkpoint of this outlook window) is bullish with a target of $47.40 and a projected range of $45.20 to $48.10. The 5-day model (target date September 25, matching our expiration) is also bullish, targeting $48.30 within a projected $44.40 to $49.00 band. Both targets sit comfortably inside the options-implied $41.70–$51.66 corridor, which classifies both as Confirms rather than Extends — the chart models want the same direction as the flow, and less magnitude than the options are pricing.
The strongest technical reads are an ADX of 35.4 with +DI at 39.7 versus −DI at 10.0 — a genuinely strong, directionally clean uptrend rather than a range — and the reclaim of the 200-day average at $45.54 after a week beneath it. The caution flag is money flow: the CMF reading is essentially flat at −0.009 while price makes new local highs, a mild non-confirmation suggesting the rally is momentum-driven rather than accumulation-driven. RSI at 72.8 is at the same overbought extreme that preceded the mid-August and early-September reversals. The dominant scenario in the 3-day report invalidates on a close back below $45.50, which is why that level, and not a wall, is this article's kill switch.
Model vs. Market: The options market implies $41.70–$51.66 into September 25; the 5-day technical model targets $48.30 inside a $44.40–$49.00 band. The chart model is picking a direction the options are only leaning toward, and asking for roughly a third of the movement the straddle is paying for — which argues for spreads that sell off some of that priced-in magnitude rather than buying the whole move.
The practical effect on strikes below: the bullish structure's short leg sits at $50, where the call wall and both models' upper bounds converge, rather than reaching for the top of the implied range.
Full technical write-ups: 3-day report → · 5-day report →
4 · Three ways the next five days can go
If IREN pushes above the call wall ($50.00): that strike holds 7,595 contracts of call open interest at this expiration and the chain's single largest gamma concentration. Heavy call open interest overhead tends to slow rallies as hedging flows lean against the move, so the first approach is more likely to stall than to slice through. A clean break and hold above $50 leaves thinner positioning until the $50.90 swing pivot and the $51.66 top of the implied range.
If IREN drifts between the walls ($42.00–$50.00): this is the base case the positioning supports. Max pain for September 25 is $43.00 — well below Friday's close — and expirations sometimes gravitate toward that level as expiring open interest unwinds. With the dealer-gamma estimate reading positive for this expiration, hedging flows would tend to damp movement rather than accelerate it, favouring a grind rather than a gap. Note the tension: the $3.68 gap between spot and max pain is the one meaningful piece of data pulling against the bullish lean this week.
If IREN breaks below the put wall ($42.00): the 20-day average sits at $41.83 and the bottom of the implied range at $41.70, so a decisive break through $42 clears three levels at once and leaves the 50-day at $40.38 as the next structural stop. Spot currently sits unusually far above the estimated gamma flip level of roughly $20 for this name, so the "hedging amplifies the selling" scenario is not in play at these prices — but a fall of that size would still mean the entire three-day gap sequence that created this setup has been given back.
5 · Three defined-risk structures
Prices are end-of-day midpoints as of 2026-09-18. All structures are hypothetical. Verify live prices before trading — these will be stale by the open.
Because the premium gap is negative — options are priced roughly 5 vol points below what IREN has actually been delivering, on top of an IV rank of 6.54 — the debit structures lead here, and the credit structure carries a health warning.
If you lean bullish: September 25 $47/$50 call debit spread
- Trade: Buy the September 25 $47 call, sell the September 25 $50 call
- Debit: $1.01 · Max profit: $199 per spread · Max loss: $101 per spread · Break-even: $48.01
- Why it fits: You pay a debit and are betting the stock finishes above $48.01, with everything above $50 given up. The short leg is parked exactly at the call wall, where 7,595 contracts of call open interest are most likely to slow the advance — you are selling the level the market has already decided is hard to pass. And with IV rank at 6.54 and the premium gap negative, long optionality is unusually cheap for this name. Both chart models target the zone between the strikes ($47.40 and $48.30).
- Makes sense only if: you believe Friday's call-side build and the reclaim of the 200-day average carry through rather than mean-reverting, as the flat money-flow reading warns they might.
- Invalidated if: IREN closes below $45.50.
- Managing it: the whole position decays into September 25, so take profits early — closing at roughly 60–70% of maximum value beats holding for the last few cents. With a strong short-term move fighting a stock that has reversed hard from this exact zone twice in six weeks, err toward taking the money at the halfway checkpoint on September 23 rather than riding into expiration.
- Liquidity note: the $47 calls traded 4¢ wide (about 2% of mid) and the $50 calls 5¢ wide; both are among the most actively traded contracts in the chain. Fills should be easy.
- Analyze this position →
If you expect the range to hold: September 25 $40/$42/$50/$52 iron condor
- Trade: Sell the $42 put / buy the $40 put, and sell the $50 call / buy the $52 call, all September 25
- Credit: $0.71 · Max profit: $71 per condor · Max loss: $129 per condor · Break-evens: $41.29 and $50.71
- Why it fits: You collect a credit up front and keep it if IREN finishes between $42 and $50. The short strikes sit exactly on the two walls for this expiration, so both wings are defended by the heaviest open interest in the chain, and the estimated positive gamma regime argues for damping rather than amplification inside that corridor.
- Health warning: you're selling premium that hasn't been rich lately. With IV rank at 6.54 and implied volatility running about 5 vol points below IREN's delivered movement, you are collecting less than the stock has historically been paying out in realized movement. Risking $129 to make $71 on a stock priced for a ±10.67% swing is a thin proposition, and it only works if the walls do their job.
- Makes sense only if: you specifically believe the three-day gap sequence exhausts itself and IREN stalls, and you want the max-pain pull at $43.00 working for you.
- Invalidated if: IREN closes outside $42.00–$50.00 before expiration — close the tested side rather than hoping.
- Managing it: take profit at roughly 50% of max credit; exit regardless by September 24 to avoid expiration-day pin risk at a short strike.
- Liquidity note: the $42 puts traded 5¢ wide and the $40 puts 1¢ wide — both fine. The $52 call is the problem leg: bid $0.30 / ask $0.52, more than half the mid price. Work that leg with a limit order or substitute the $53 call (10¢ wide) and accept the wider wing; do not pay the offer.
- Analyze this position →
If you lean bearish: September 25 $45/$42 put debit spread
- Trade: Buy the September 25 $45 put, sell the September 25 $42 put
- Debit: $0.79 · Max profit: $221 per spread · Max loss: $79 per spread · Break-even: $44.22
- Why it fits: This is the mean-reversion trade against our own bias, and it is cheap for two reasons — puts are running 2.4 vol points below calls, so downside optionality is the discounted side of this chain, and the short leg sits at the put wall where the heaviest put open interest should slow a decline. Max pain at $43.00 sits between the strikes. If the flat money-flow reading is telling the truth about this rally, this is how it resolves.
- Makes sense only if: you read the three consecutive up-gaps and an RSI of 72.8 as exhaustion rather than strength — the same setup preceded sharp reversals in mid-August and early September.
- Invalidated if: IREN closes above $48.00.
- Managing it: this fights an aligned short-, medium- and long-term uptrend, which argues for taking profit quickly rather than holding for the full move — target roughly half of maximum value and close by September 24.
- Liquidity note: the $45 puts traded 8¢ wide (about 7% of mid) and the $42 puts 5¢ wide (about 12% of mid). Both are workable but use limit orders; the $42 put is the looser of the two.
- Analyze this position →
If none of these: no trade
There is a legitimate case for standing aside. The bullish lean rests on a single explosive session — Friday's momentum reading jumped to +47 from a seven-day average of +7 — and three days earlier the same flow engine flagged a bearish turn that this rally promptly erased. That is a signal that has whipsawed repeatedly in this name. Meanwhile, the level that would make the bullish structure pay ($48.01 break-even) sits above the 100-day average at $47.12 and right into the $48.00 shelf both chart models flag as resistance, while max pain at $43.00 pulls the other way. Selling premium is also not the answer this week: with implied volatility priced below delivered movement, the condor is taking in less than the stock's recent behaviour justifies. If you have no strong view on whether the gap sequence continues or unwinds, waiting for a decisive close on either side of $47.12 or $45.50 costs you nothing but a few days of theta you weren't collecting anyway.
6 · Quick FAQ
What is IREN's expected move this week? ±$4.98 (±10.67%) into the September 25 expiration, giving a $41.70–$51.66 range, per the options market's straddle pricing as of September 18.
Is IREN expected to go up or down over the next five days? Options positioning as of September 18 leans slightly bullish — call open interest built by roughly 85,000 contracts in a day while puts thinned, and calls are priced above equidistant puts — but that's a read of what traders have done, not a forecast. The actionable map is the $41.70–$51.66 range and the $42.00/$50.00 wall pair.
Are IREN options expensive right now? No. IV rank of 6.54/100 says option prices are lower than roughly 93% of the past year's readings; on top of that, they're running about 5 vol points below the movement IREN has actually delivered over the past twenty days — a gap that is about mid-pack versus this stock's own recent history. That combination favours owning premium over selling it this week.
Where is IREN's biggest options support and resistance? For the September 25 expiration, the put wall is $42.00 (7,305 contracts) and the call wall is $50.00 (7,595 contracts). Across the whole chain the heaviest put strike is far lower at $30.00 — that's long-dated insurance, not a level for this week.
What invalidates this read? A close below $45.50, which would surrender the 200-day average reclaim that both chart models build their bullish case on.
Methodology & disclosures. Data: end-of-day options-chain snapshot for IREN, 2026-09-18, generated 2026-09-20T13:33:52.158Z. Prices shown are midpoints and will differ from live markets. Momentum/positioning scores and volatility-premium comparisons are descriptive measurements of past option flow and past price movement — not investment advice, signals, forecasts, or guarantees. All trade structures are hypothetical. Every structure shown has a defined maximum loss; you can lose the entire max-loss amount. Options involve substantial risk and are not suitable for all investors.