NIO Options Are Pricing a $0.27 Move — Our Read Sees a Stand-Off at the Lows
NIO options imply a $3.02–$3.56 range into the October 30 expiration. Bullish-leaning positioning is running into an intact downtrend near the 52-week low, so the levels matter more than a directional call.
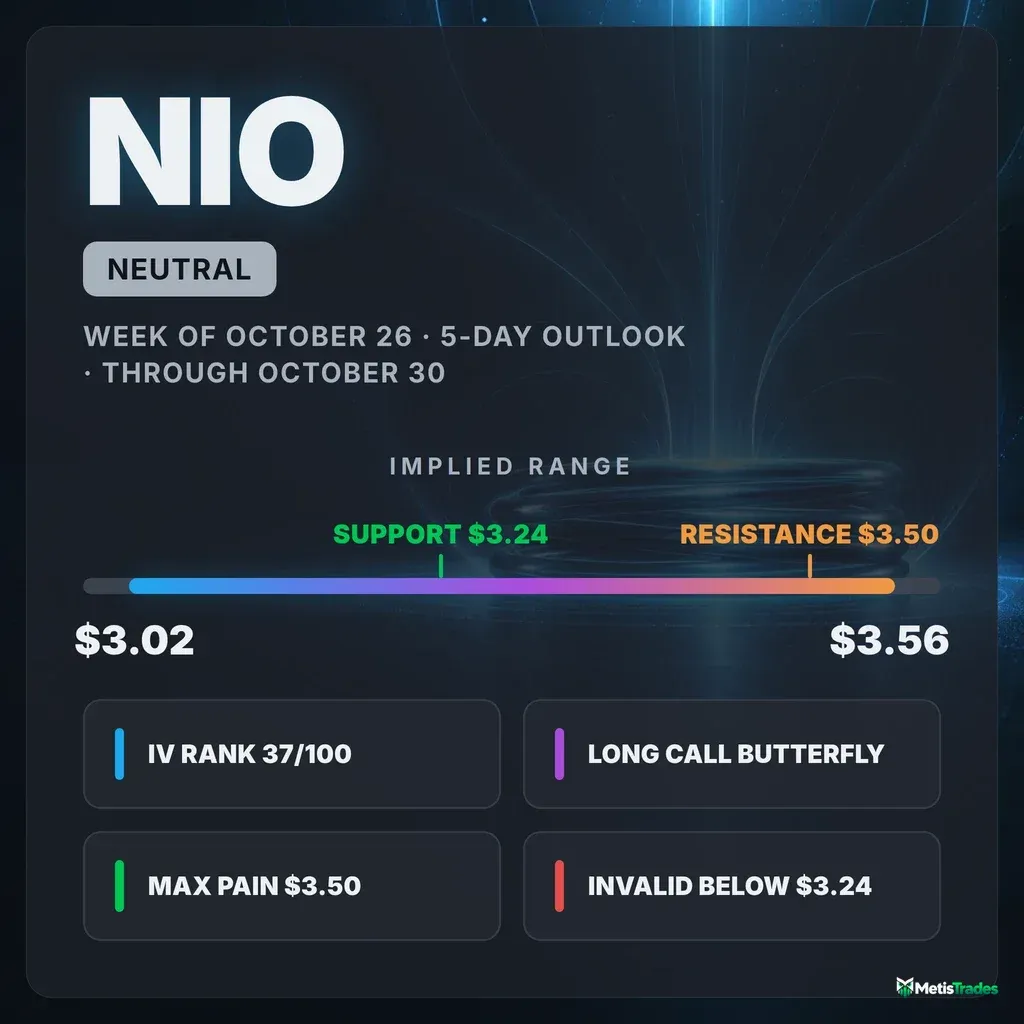
The options market implies a $3.02–$3.56 range into the October 30 expiration. Here is what's driving it, where the levels sit, and three defined-risk ways to trade it.
Published Sunday, October 25, 2026 · Data as of Friday, October 23, 2026 close
Explore the live NIO options data in the Detailed Options Analyzer →
Quick answer
| Item | Answer |
|---|---|
| Market bias | Neutral |
| Options-implied range (into October 30) | $3.02 – $3.56 (±$0.27, ±8.16%) |
| Major support | $3.24 (52-week low). The October 30 put wall is at $3.50, which sits above the stock. |
| Major resistance | $3.50 (October 30 max pain and put wall), then the $4.00 October 30 call wall |
| Max pain (October 30) | $3.50 |
| Dealer gamma regime (estimate) | Positive for the October 30 expiration, so hedging tends to dampen moves. The whole-chain estimate is negative. Flip level ≈ $1 |
| Volatility condition | Rising. IV rank 37.1/100 · premium thin: options priced ~11 vol pts above delivered movement |
| Technical check | Mixed (bearish, 3-day target $3.27 and 5-day target $3.26) |
| Best-fitting strategy | Long October 30 $3.00/$3.50/$4.00 call butterfly, only if the 52-week low holds |
| Analysis invalidated if | NIO closes below $3.24 |
1 · What matters today
Our read on NIO for the next five days is neutral. Options traders have been quietly positioning for a bounce. Call buying outpaces puts, and an early-turn gauge we track is flashing bullish. But that is happening inside a downtrend that has taken the stock down about 27% over two months, and bounce bets like this have a poor record of paying off quickly for NIO.
The options market is pricing a move of about 27 cents either way into the October 30 expiration, which gives a range of $3.02 to $3.56. The level that changes the picture is $3.24, the 52-week low. A close below it would mean the bounce positioning failed. Above the stock, $3.50 is where the most October 30 option value would expire worthless, and it acts as a mild magnet. The chart-based models lean slightly bearish but stay well inside that range.
2 · What the options market is pricing
What changed this week
NIO closed Friday at $3.29, down 4.1% over five sessions and 8.1% over 20.
Option prices moved the other way. At-the-money implied volatility, the market's estimate of how much NIO will move baked into option prices, rose 4.6% over five days to 52.55%. IV rank climbed to 37.1, against a 7-day average of 33.5 and a 14-day average of 29.2.
Positioning barely shifted:
- The put/call open-interest ratio (puts held open per call held open) sits at 0.70, essentially its 7-day average of 0.71.
- Option volume was light, at about 0.59 times its 20-day average.
- The single biggest change in open interest was a reduction: 7,639 contracts of the deep in-the-money November 20 $5 puts closed out. That is profit-taking on old downside bets, not fresh positioning.
The short-, medium- and long-term trend reads all agree on a bearish direction, so the slide is not a one-week blip. Against that backdrop, a fast-momentum crossover turned up on October 21, which is the first sign of near-term flow pushing back.
Expected move
The expected move is the move the options market is pricing in, derived from what straddles cost. For the October 30 expiration it is ±$0.27 (±8.16%) around the $3.29 chain price.
| Expiration | Implied move | Range around $3.29 |
|---|---|---|
| October 30 | ±8.16% | $3.02 – $3.56 |
| November 6 | ±11.08% | $2.93 – $3.65 |
| November 13 | ±12.59% | $2.88 – $3.70 |
| November 20 | ±14.65% | $2.81 – $3.77 |
The ladder widens smoothly with time, with no single rung stepping up sharply. That means no scheduled event is visibly priced into these expirations.
Volatility
At-the-money IV is 52.55%, and the October 30 expiration's own at-the-money read is a bit higher at 58.9%. IV rank, which shows where today's IV sits versus the past year, is 37.1/100. That means options are cheaper than about 63% of the past year's range. The percentile view is even lower: only about 16% of the past year's sessions closed with lower IV. In other words, the year included some big spikes, and today is well short of them.
The direction is up:
- IV rose 3.0% on the day and 13.8% over 30 sessions.
- It sits above its 30-day average of 47.5%, though still just under its 90-day average of 53.2%.
- Longer-dated options (around 60 days) price only 44.9%, so near-term options carry the richer volatility.
- The front-month term-structure read itself is unavailable today because of the October 23 expiry.
Two "vs its own norm" readings stand out. These compare NIO against its own recent history, so "unusual" means unusual for NIO, not versus the broader market:
- NIO's 20-day realized volatility of 41.4% is running well above its own recent norm.
- The past week has been unusually quiet relative to that month. Five-day movement is running at less than half the 20-day pace.
The recent grind lower has been orderly rather than violent.
Is premium rich or cheap? The volatility risk premium is the gap between how much movement options are priced for and how much NIO has actually delivered. When it's positive, option sellers have been collecting more than realized movement cost them. Today options are priced about 11 vol points above what NIO has delivered over 20 days.
That gap is only at the 28th percentile of this stock's own recent readings, meaning it is richer than just 28% of them. It widened over the past week, from roughly 9 points on October 21 to 11 points Friday, but it remains thin by NIO's standards. Put together, an IV rank of 37 and a 28th-percentile premium over delivered movement favor owning premium through defined-risk debit structures rather than collecting it.
Skew and sentiment
Skew captures the fact that puts and calls the same distance from the stock price don't cost the same. When puts are pricier, traders are paying up for crash protection. For NIO the usual pattern has flipped:
- The 25-delta put trades at 51.8% IV while the 25-delta call shows 97.9%. Puts are running about 46 vol points below calls.
- Normally, over the prior 60 days, puts sit about 10 points above calls.
That is stretched well beyond its own norm, and the read has swung wildly. The 7-day average still shows puts 25 points richer. Part of the swing is the arithmetic of far out-of-the-money calls quoted at a penny, which inflates their implied volatility. The direction is still real, though: traders are not paying up for downside protection right now.
Flow confirms the calm on the put side:
- The put/call volume ratio, which measures put activity relative to calls (above 1 means puts dominate), is 0.23. That is roughly four calls traded for every put, in line with its 14-day average of 0.23.
- Sentiment in short-dated options is mildly positive. The 0–7 day group reads slightly bullish, and the 7–30 day group is flat.
- Further out, the 30–60 and 60–120 day groups lean bullish, so the overall regime reads "broadly bullish."
- That said, the 7–30 day group was negative on a 7-day average basis, so the warming is recent.
The key levels map
| Level | Price | Why it matters |
|---|---|---|
| Whole-chain heaviest call strike | $7.00 | 232,067 open calls, mostly long-dated lottery tickets far from spot |
| 200-day moving average | $4.93 | Stock is 33% below it, a deep long-term downtrend |
| Swing resistance | $4.46 | Prior pivot cluster |
| 100-day moving average | $4.35 | Long-term trend marker |
| Call wall (October 30) | $4.00 | Biggest pile of open calls for the expiration (6,995); also the chain's largest-gamma strike |
| Swing resistance / 50-day MA | $3.79 / $3.78 | Where the last leg down started |
| Swing resistance | $3.63, $3.55 | Stacked overhead supply |
| Upper implied rail (October 30) | $3.56 | Top of the options-implied range |
| Max pain + put wall (October 30) | $3.50 | Where the most option value expires worthless; 4,108 open puts, already in the money |
| 20-day moving average | $3.44 | Near-term trend line |
| Swing resistance / October 22 gap | $3.36 | Unfilled gap-down from $3.36; first real hurdle |
| Spot | $3.29 | Friday close |
| 52-week low | $3.24 | The line in the sand for this read |
| Lower implied rail (October 30) | $3.02 | Bottom of the options-implied range |
| High-gamma strike | $3.00 | Second-largest gamma concentration across the chain |
| Whole-chain put wall | $2.00 | 188,122 open puts, mostly January expiry |
| Gamma flip (estimate) | ≈ $1 | One rough estimate places it far below spot |
Positioning and unusual flow
Market makers hedge the options they've sold, and in a positive-gamma regime their hedging tends to dampen moves. One rough estimate puts the October 30 expiration in positive gamma, which favors pinning over runaways this week.
The whole-chain estimate tilts negative, where hedging amplifies moves. That reading is driven by the huge January open interest and matters more for later months than for these five days.
The October 30 walls are unusual. The put wall at $3.50 sits above the stock: those 4,108 puts are about 21 cents in the money, protection that is already paying. It acts more like a magnet tied to max pain than a floor. The real floor is price structure at the $3.24 yearly low.
Flow worth noting:
- October 30 $3.50 calls: 2,410 contracts traded, the busiest line of the day, with open interest up 573 to 5,976 and the last print at the ask. These calls have shrunk from roughly a coin flip to about a 23-delta bet over two weeks, yet traders keep adding.
- October 30 $3.00 calls: 564 traded against 663 open, about $18,000 of premium. Open interest rose 174, so fresh money is backing a hold above $3.
- December 18 $4 puts: 228 traded against just 100 open (2.3× turnover), about $17,000 in premium. This is in-the-money downside exposure that serves as a reminder that not all flow is bullish.
Into the October 23 expiration, the $3.50 puts shed 432 contracts of open interest as that series settled.
The early-turn positioning gauge we track is in a "bullish setup" state. Over the past 10 sessions, price fell about 6% while the positioning score rose more than 100 points. That divergence has historically preceded attempted turns. It is an early read, not a confirmed one.
3 · Technical check
The two technical reports agree with each other but not with the positioning.
- 3-day report (target October 28): bearish, target $3.27, projected range $3.22–$3.36. Support $3.25, resistance $3.35, invalidation on a close above $3.35.
- 5-day report (target October 30): also bearish, target $3.26, projected range $3.17–$3.35.
Both targets sit comfortably inside the options-implied $3.02–$3.56 band, so this is a modest directional difference, not a magnitude gap. Against our neutral read we classify the technicals as mixed: same range, slightly bearish lean.
The most decisive technical reads cut both ways. Money-flow (CMF) has turned positive at +0.109 while price made lower lows, a sign of accumulation. Meanwhile, trend strength (ADX 17.6 and falling) says the selloff is losing force rather than accelerating. Both reports read the tight $3.28–$3.33 consolidation as a bearish continuation flag, with a falling-wedge bounce as the alternative only on a break above $3.35.
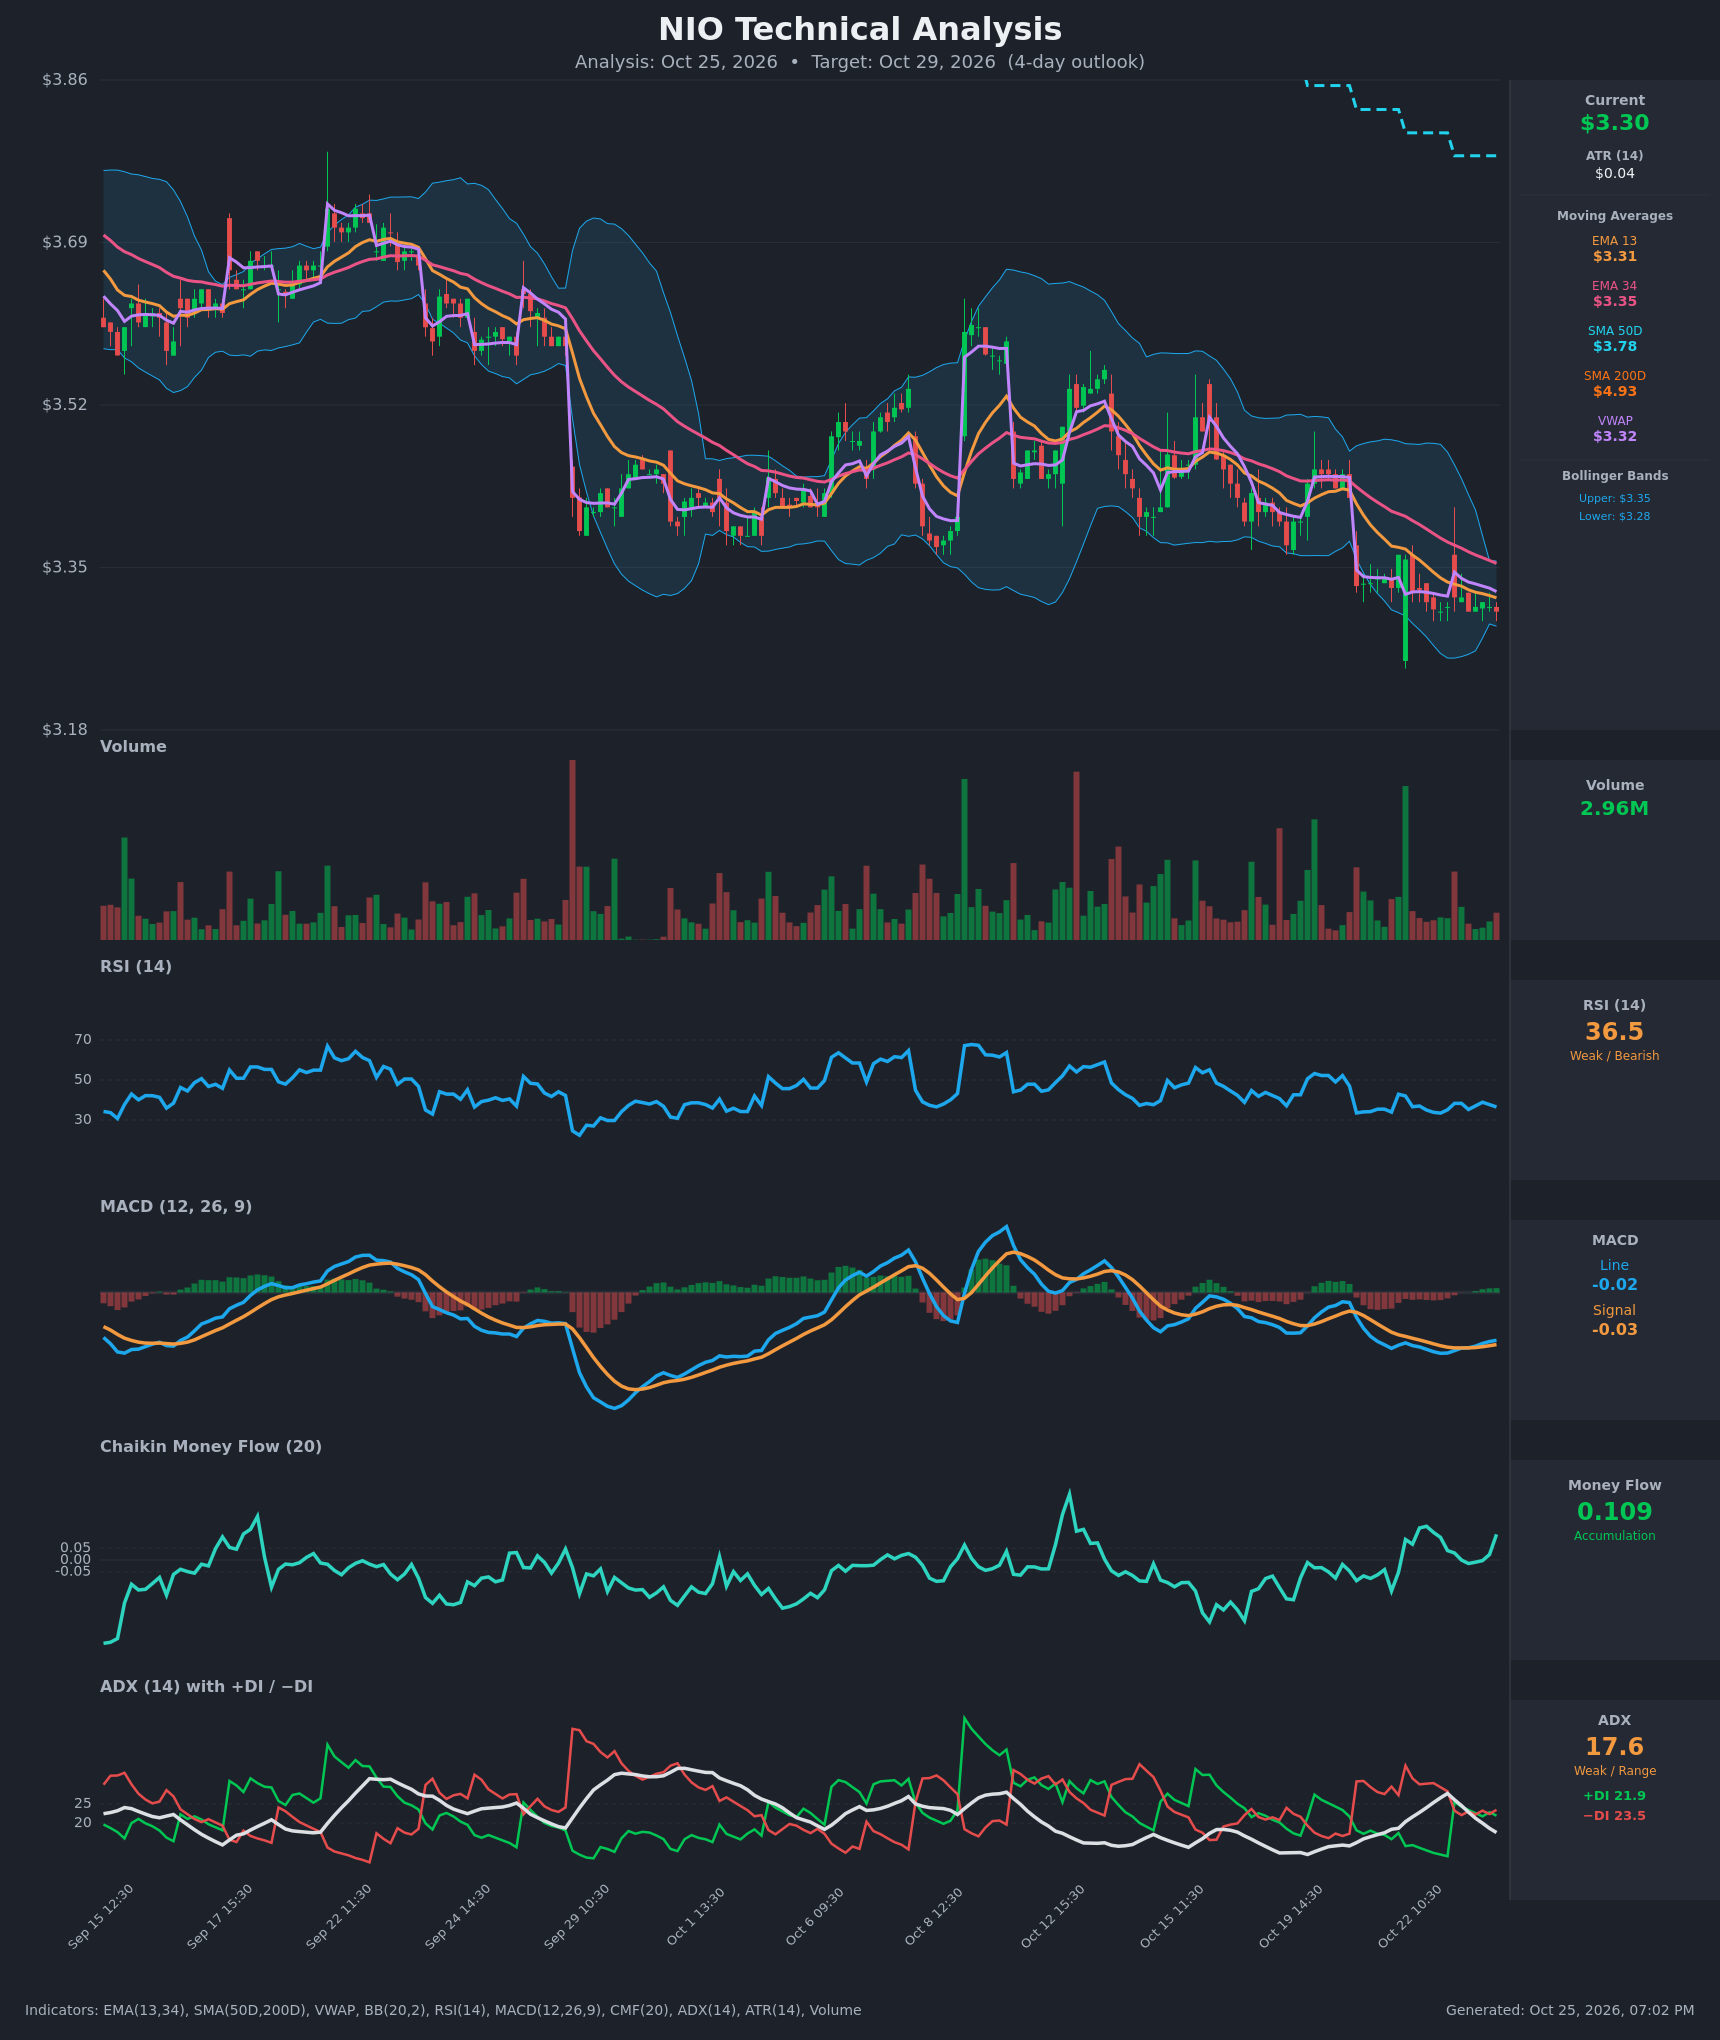
Model vs. Market: The options market implies $3.02–$3.56 into October 30; the 5-day technical model targets $3.26. That target sits 24 cents below the $3.50 max pain the options chain gravitates toward. A close above $3.35 would hand the argument to the positioning, and a close below $3.24 would hand it to the chart.
The technicals did not move our strikes. However, the 5-day target lands exactly on the lower break-even of the butterfly below, which is why we frame that structure as conditional on the yearly low holding.
Full technical write-ups: 3-day report → · 5-day report →
4 · Three ways the next five days can go
If NIO pushes through $3.50 toward the call wall ($4.00): Clearing the $3.36 gap and the $3.50 max-pain/put-wall cluster would put the stock above the busy $3.50 call line. Those 5,976 contracts would turn from lottery tickets into live exposure, and dealers hedging them could add fuel. The next heavy positioning is the $4.00 call wall, which sits well beyond the $3.56 implied rail. Overhead supply at $3.55 and $3.63 tends to slow rallies before then.
If NIO drifts between $3.24 and $3.50: This is the pin case. With the October 30 expiration in positive gamma (an estimate), hedging tends to lean against moves, and expiring open interest tends to pull price toward max pain at $3.50 into October 30. The realistic version for a stock grinding along its lows is a slow drift in the $3.29–$3.45 zone rather than a straight line to $3.50.
If NIO breaks below $3.24: A close under the 52-week low removes the last structural floor until the $3.00 high-gamma strike and the $3.02 lower rail. One rough estimate places the gamma flip near $1, unusually far below spot for this name. So a drop to $3 would not, on its own, flip hedging into an amplifier. That would be a plain breakdown driven by the existing downtrend, not a dealer-driven waterfall.
5 · Three defined-risk structures
Prices are end-of-day midpoints as of October 23. All structures are hypothetical. Verify live prices before trading, because these will be stale by the open. With premium thin versus NIO's own history, the debit structures lead.
If you expect the range to hold (with a pull toward max pain): long call butterfly
- Trade: Buy 1 October 30 $3.00 call, sell 2 October 30 $3.50 calls, buy 1 October 30 $4.00 call
- Debit: $0.26 ($26 per butterfly) · Max profit: $0.24 ($24) at $3.50 · Max loss: $0.26 ($26) · Break-evens: $3.26 and $3.74
- Why it fits: The center sits on the October 30 max pain and put wall at $3.50, the expiration's gamma estimate favors pinning, and premium is thin, so you buy the structure rather than sell it. You are paid for a quiet drift into the middle of the implied range's upper half.
- Makes sense only if: the $3.24 yearly low holds and the stock stays in its orderly, low-movement week.
- Invalidated if: NIO closes below $3.24.
- Managing it: Butterflies gain most in the final days, so check the position at the October 28 checkpoint. Take profits around 50% of max (about 12 cents of gain). If NIO closes below $3.24, exit rather than wait for expiration.
- Liquidity note: The $3.00 calls trade 4¢ wide ($0.30/$0.34), the $3.50 calls 1¢ wide ($0.03/$0.04), and the $4.00 calls are pinned at a penny. Those penny spreads are a large share of a 26-cent structure, so work the order at the mid.
- Analyze this position →
If you lean bullish: call debit spread
- Trade: Buy October 30 $3.00 call, sell October 30 $3.50 call
- Debit: $0.285 ($28.50) · Max profit: $0.215 ($21.50) at $3.50 or above · Max loss: $0.285 ($28.50) · Break-even: $3.285
- Why it fits: It rides the call-heavy flow, the bullish early-turn reading, and the pull toward $3.50 max pain, and it caps the upside where the October 30 positioning clusters. A debit spread pays a fixed amount to bet on a rise. With thin premium, buying is the right side.
- Makes sense only if: NIO reclaims the $3.36 gap area early in the window. The break-even sits right at spot, so this needs follow-through, not a pin at $3.29.
- Invalidated if: NIO closes below $3.24.
- Managing it: The short-term pop is fighting a bearish long-term trend, so take profits early, around 50–60% of max gain. Close no later than October 30 morning to avoid settlement noise around $3.50.
- Liquidity note: The $3.00 calls trade 4¢ wide and the $3.50 calls 1¢ wide. That is fine in cents but meaningful as a percentage, so use limit orders.
- Analyze this position →
If you lean bearish: put debit spread
- Trade: Buy October 30 $3.50 put, sell October 30 $3.00 put
- Debit: $0.225 ($22.50) · Max profit: $0.275 ($27.50) at $3.00 or below · Max loss: $0.225 ($22.50) · Break-even: $3.275
- Why it fits: It sides with the aligned bearish trend and both technical reports, and puts are unusually cheap versus calls right now, so the long $3.50 put is not overpriced. The short $3.00 put sits at the high-gamma strike just under the $3.02 lower rail.
- Makes sense only if: NIO loses $3.24 and confirms the bearish flag the technicals describe.
- Invalidated if: NIO closes above $3.36.
- Managing it: Take profits around 50% of max (about 14 cents of gain). If the stock reclaims the $3.36 gap, close rather than hope. Close by October 30 morning.
- Liquidity note: The $3.50 puts trade 4¢ wide ($0.22/$0.26), and the $3.00 puts are quoted 1¢/2¢. Slippage is a real fraction of the debit.
- Analyze this position →
If none of these: no trade
Standing aside is a legitimate choice this week. The positioning and the price trend point in opposite directions. Every October 30 structure costs a few pennies of bid-ask on a 20-to-30-cent position. The obvious income alternative doesn't work either. An iron condor with short strikes at $3.00 and $3.50 would collect only about 3 cents against 47 cents of risk, and you'd be selling premium that hasn't been rich lately.
If you don't have a view on whether $3.24 holds, waiting for a close either above $3.36 or below $3.24 costs you nothing but a few cents of opportunity.
6 · Quick FAQ
What is NIO's expected move this week? About ±$0.27 (±8.16%) into the October 30 expiration, a $3.02–$3.56 range, per straddle pricing as of the October 23 close.
Is NIO expected to go up or down over the next week? Options positioning as of October 23 reads neutral. Call-heavy flow and a bullish early-turn signal are offset by an intact downtrend and a poor record for quick bounces. That's a read of what traders have done, not a forecast. The actionable map is the $3.02–$3.56 range, the $3.24 low, and the $3.50 max pain.
Are NIO options expensive right now? IV rank of 37.1/100 says option prices are cheaper than about 63% of the past year's range. They run about 11 vol points above the movement NIO has actually delivered, but that gap is richer than only 28% of this stock's own recent readings. Premium is on the thin side, which favors buying defined-risk structures over selling.
Where is NIO's biggest options support and resistance? For October 30, the call wall is $4.00 and the put wall is $3.50. The put wall sits above the stock and doubles as max pain, so the practical floor is the $3.24 52-week low.
What invalidates this week's read? A close below $3.24.
Methodology & disclosures. Data: end-of-day options-chain snapshot for NIO, October 23, 2026, generated 2026-10-25T19:02:00.263Z. Prices shown are midpoints and will differ from live markets. Momentum/positioning scores and volatility-premium comparisons are descriptive measurements of past option flow and past price movement — not investment advice, signals, forecasts, or guarantees. All trade structures are hypothetical. Every structure shown has a defined maximum loss; you can lose the entire max-loss amount. Options involve substantial risk and are not suitable for all investors.