NIO Options Outlook: Will $3.55 Hold Into the October 2 Expiration?
NIO options imply a $3.38–$3.78 range into the October 2 expiration, and positioning leans slightly bearish as the stock sits just above its 52-week low. Here is what's driving the read, the levels that matter, and three defined-risk ways to trade it.
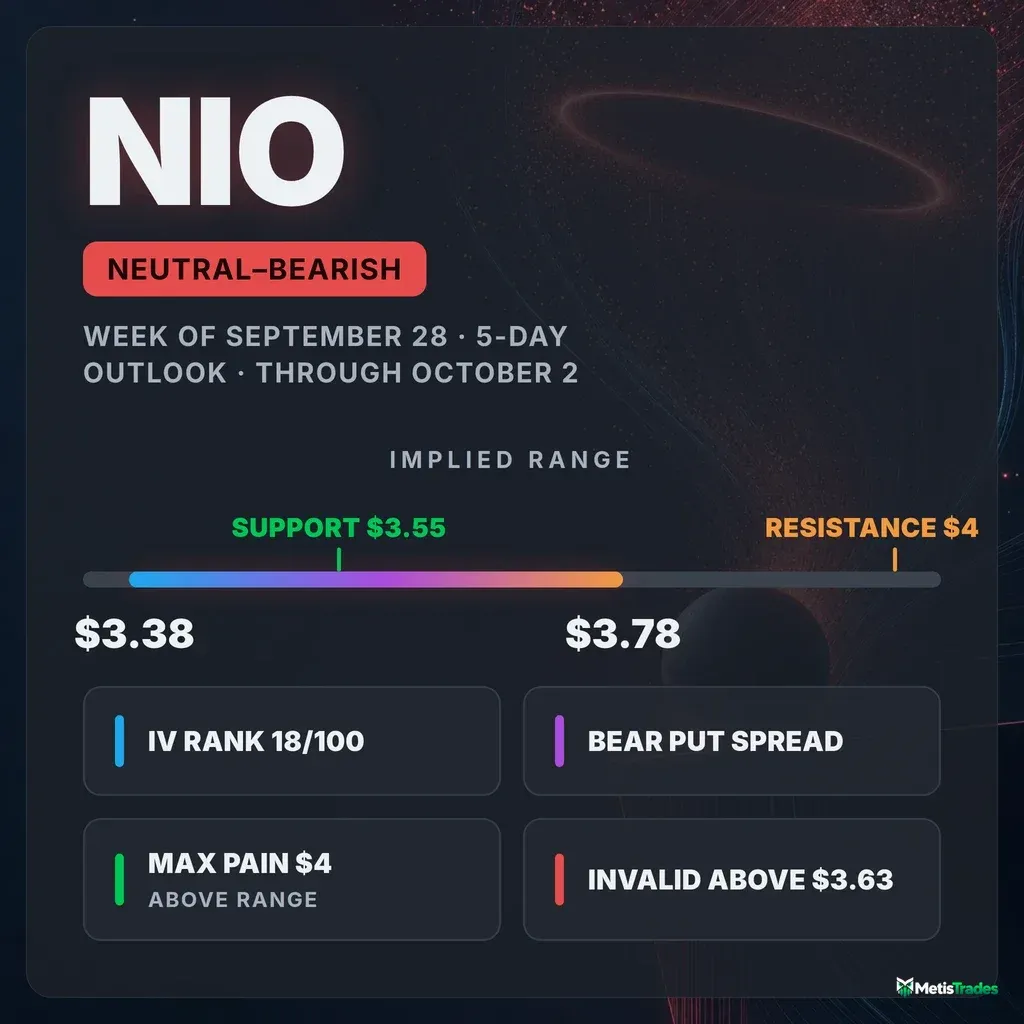
The options market implies a $3.38–$3.78 range for NIO into the October 2 expiration. Positioning leans slightly bearish, and option prices are cheap versus their past year. Below: what's driving the setup, the levels that matter, and three defined-risk ways to trade it.
Published Saturday, September 26, 2026 · Data as of Friday, September 25, 2026 close
Explore the live NIO options data in the Detailed Options Analyzer →
Quick answer
| Item | Answer |
|---|---|
| Market bias | Slightly bearish |
| Options-implied range (into October 2) | $3.38 – $3.78 (±$0.20, ±5.54%) |
| Major support | $3.55 (52-week low and swing support). The October 2 put wall sits at $4.00, which is above spot, so it is not acting as a floor. |
| Major resistance | $4.00 (October 2 call wall); structural resistance at $3.79 |
| Max pain (October 2) | $4.00 |
| Dealer gamma regime (estimate) | Positive: hedging tends to dampen moves. Flip level ≈ $1.50, far below spot. |
| Volatility condition | Falling. IV rank 18/100. Premium fair: options priced about 10.7 vol pts above delivered movement. |
| Technical check | Confirms (bearish on both the 3-day and 5-day checks; model targets $3.51 and $3.49) |
| Best-fitting strategy | October 2 $4/$3.50 bear put spread, if you accept a small payoff for a high-probability, slow-drift bet |
| Analysis invalidated if | NIO closes above $3.63 |
1 · What matters today
NIO closed Friday at $3.58, three cents above its 52-week low of $3.55. Our read of options positioning leans slightly bearish. The main reason is simple: traders are paying far more for downside protection than they normally do on this stock, and the price trend is down on every timeframe we track.
The options market is pricing a move of about $0.20 either way through the October 2 expiration, a range of roughly $3.38 to $3.78. The one level that changes the picture is $3.63. A close above it breaks the recent pattern of lower highs and undercuts the bearish lean.
Option prices are cheap versus their past year, which makes defined-risk debit trades more attractive than usual. The chart-based technical model agrees with the bearish lean, targeting about $3.49 over the same window.
2 · What the options market is pricing
What changed this week
Price. NIO slipped 2.2% over the past five sessions, extending a 17.9% slide over the past month. The trend reads line up in the same direction:
- Over the past week: down 2.2%.
- Over the past month: down 17.9%.
- Over the past two and a half months: down 28.2%.
Short-term flow is not fighting the bigger trend here. The trend reads also flagged a fresh, if faint, bearish turn in flow momentum on Friday, September 25.
Volatility. Implied volatility collapsed while price drifted. At-the-money IV fell 25.5% over five sessions to 42.4%, well under its 30-day average of 52.3%.
Put/call ratios.
- Volume: Put/call volume ran at 0.11, meaning roughly one put traded for every nine calls. That is lighter on puts than the 7-day average of 0.14 and the 14-day average of 0.16.
- Open interest (OI): OI, meaning contracts currently held open, sits at 0.71 puts per call. That matches the 7-day average but is well above the 14-day average of 0.54. Much of that step-up happened in mid-September, partly around a day when the data feed's chain coverage changed, so treat the size of the jump with some caution.
Biggest OI change. The largest single-day build was in the November 20 $4 calls, which added 3,725 contracts to 54,702. Close behind, the October 2 $4 calls added 2,768 to 16,356. Traders keep stacking upside bets at $4 even as the stock drifts lower.
Expected move
The expected move is the move the options market is pricing in, derived from what straddles cost. For the October 2 expiration, it works out to ±$0.20, or ±5.54%, around the $3.58 snapshot price. That puts the one-standard-deviation band at $3.38 to $3.78.
| Expiration | Implied move | Range around $3.58 |
|---|---|---|
| October 2 | ±5.54% | $3.38 – $3.78 |
| October 9 | ±8.34% | $3.28 – $3.88 |
| October 16 | ±10.16% | $3.22 – $3.94 |
| October 23 | ±11.05% | $3.18 – $3.98 |
The rungs widen smoothly, roughly with the square root of time, with no sudden step-up that would signal a scheduled event being priced into one particular expiration. Note that even the October 23 range tops out just under $4.00, the strike where most of the open interest is piled.
Volatility
Implied volatility (IV) is the market's estimate of how much NIO will move, baked into option prices. At-the-money IV is 42.4%, and the trend is lower across every window:
- Down 3.9% on the day.
- Down 25.5% over five sessions.
- Down 17.9% over 30 sessions.
- Below both its 30-day average (52.3%) and its 90-day average (56.5%).
IV rank measures where today's IV sits versus the past year. At 18/100, today's IV is cheaper than 82% of the past year's readings. The 7-day average IV rank is about 16, so options have been sitting near the bottom of their annual range all week.
The front-month term-structure read (comparing option prices across different expiration dates) is unavailable today, because Friday was an expiry day.
Compared against NIO's own recent history, where "unusual" means unusual for NIO rather than versus the broader market, two readings stand out:
- The stock's 20-day realized movement is running well below its norm.
- Movement is decelerating. The 10-day realized figure of 18.9% is barely more than half the 20-day figure of 31.6%.
The speed of the IV decline is also unusually sharp by NIO's standards. This is a stock that has been grinding lower quietly, not crashing.
Is premium rich or cheap? The volatility risk premium is the gap between how much movement options are priced for and how much NIO has actually delivered. When it's positive, option sellers have been collecting more than realized movement cost them.
- Right now, options are priced about 10.7 vol points above NIO's delivered 20-day movement of 31.6%.
- That gap sits at the 34th percentile of this stock's own recent readings. In other words, it is richer than only about a third of them. By NIO's own standards, the gap is somewhat below its usual size.
- Over the past week, the gap slid from roughly 18 points on September 18 to today's level, with a one-day dip near zero on September 23 that quickly reversed.
So what? The combination of IV rank 18 and a 34th-percentile premium over delivered movement doesn't argue for aggressively selling premium. If anything, it modestly favors owning defined-risk structures over collecting thin credits this week.
Skew and sentiment
Skew is the idea that puts and calls the same distance from the stock price don't cost the same. When puts are pricier, traders are paying up for crash protection.
NIO's skew is extreme right now. The 25-delta puts carry an IV around 170% versus about 72% for the matching calls, a gap of roughly 98 vol points. The 60-day norm for this name is about −4 points, meaning calls are usually slightly richer. The skew steepened by about 104 points in five sessions.
Part of that extremity reflects NIO's coarse $0.50 strike spacing on a sub-$4 stock, which makes the 25-delta read jumpy. But the direction is clear: near-dated downside protection has gotten expensive fast. That is the single biggest reason the positioning lean tilts bearish.
The flow picture is more mixed:
- Volume leans calls. The put/call volume ratio of 0.11 is unusually call-heavy even for NIO, which normally runs around 0.28.
- Short-dated sentiment is barely positive. Sentiment in options expiring within 7 days is only marginally positive (+7).
- The 7–30 day window reads strongly bullish (+53), as calls there price richer than usual and call open interest builds.
The overall read across expirations is "broadly bullish." So the market is split: speculators keep buying cheap upside lottery tickets, especially at $4, while the nearest-dated hedging demand is heavily on the put side. Our positioning read weights that hedging demand and the down-trending price more heavily, which is why the net lean is slightly bearish rather than bullish.
The key levels map
| Level | Price | Why it matters |
|---|---|---|
| 52-week high | $8.02 | Context only; spot sits 55% below it. |
| Whole-chain call wall | $7.00 | Heaviest call OI across all expirations (mostly the January contract); irrelevant for a 5-day window. |
| 200-day moving average | $5.09 | Spot trades about 30% below it; the long-term trend is firmly down. |
| Largest-gamma strike #2 | $5.00 | Big call open interest, far outside the implied range. |
| 100-day moving average | $4.83 | Declining overhead average. |
| Swing resistance cluster | $4.46 – $4.82 | Where the late-August breakdown started. |
| 50-day moving average | $4.29 | Spot is 16.5% below it. |
| Call wall, put wall, max pain (October 2); largest-gamma strike | $4.00 | Every positioning marker for the expiration lands here. The strike with the biggest pile of open contracts often acts like a magnet or a barrier. Here it sits above the implied range. |
| Swing resistance | $3.79 | Nearest structural ceiling; lines up with the top of the implied range. |
| Implied range top (October 2) | $3.78 | One-standard-deviation upside rail. |
| 20-day moving average | $3.77 | Spot is about 5% below it. |
| Technical resistance / invalidation | $3.63 | The chart model's key reclaim level; our kill switch. |
| Spot (Friday close) | $3.58 | Reference price. |
| 52-week low / swing support | $3.55 | The floor the week is testing. |
| Technical support; high-gamma strike | $3.50 | The chart model's support and a heavy options strike; our structures center here. |
| Implied range bottom (October 2) | $3.38 | One-standard-deviation downside rail. |
| High-gamma strike | $3.00 | Next big strike below. |
| Whole-chain put wall | $2.00 | Heaviest put OI across all expirations; far below. |
| Gamma flip (estimate) | $1.50 | One rough estimate of where hedging would turn from cushioning to amplifying; not in play. |
Positioning and unusual flow
Market makers hedge the options they've sold. One rough estimate suggests they are positioned in a positive-gamma regime, both across the whole chain and in the October 2 expiration specifically. In this regime, their hedging tends to dampen moves rather than amplify them.
The gamma flip level is the price below which market-maker hedging tends to accelerate selling rather than cushion it. The estimate sits near $1.50, about 58% below spot, which is unusually far away even by NIO's norms. That fits the low realized movement: this is a grind, not a cascade.
One wrinkle: the October 2 put wall and call wall both sit at $4.00. So the heaviest put open interest for the expiration is already in the money, which is leftover hedging from higher prices rather than fresh support.
Flow worth noting, all in live expirations:
- November 20 $4 calls: 8,935 contracts traded, about $138,000 in premium, the day's largest dollar flow. OI rose 3,725 and the last trade printed at the ask. Someone is paying up for a rebound toward $4 over roughly two months.
- October 23 $4 calls: 4,040 contracts traded against 3,613 open, with OI up 779. That turnover is heavy for this contract.
- October 30 $4.50 calls: 1,312 contracts against just 485 open, about 2.7 times open interest. These are small, cheap upside bets.
All the notable volume is call-side, at strikes above the implied range. It is speculative, inexpensive, and dated beyond October 2, so it doesn't change the 5-day lean. It does explain why the $4.00 strike dominates the map.
3 · Technical check
3-day check (target September 30). The near-term technical model is bearish, with a $3.51 target and a projected range of $3.44 to $3.63. It cites a fresh short-term moving-average crossover to the downside and a trend-strength gauge above 25 with sellers in control. Its $3.51 target sits inside the options-implied range and below spot, so it confirms the slightly bearish options read.
5-day check (target October 2). The longer check is also bearish, with a $3.49 target and a projected range of $3.42 to $3.66. That too is inside the $3.38–$3.78 implied band: confirms. Both reports flag the same key levels:
- Support near $3.50.
- A bearish-continuation invalidation on a close back above $3.63.
One mild counterpoint worth knowing: money-flow readings have turned slightly positive while price made marginal new lows. That hints near-term selling pressure may be tiring, even though it is not strong enough to flip the read.
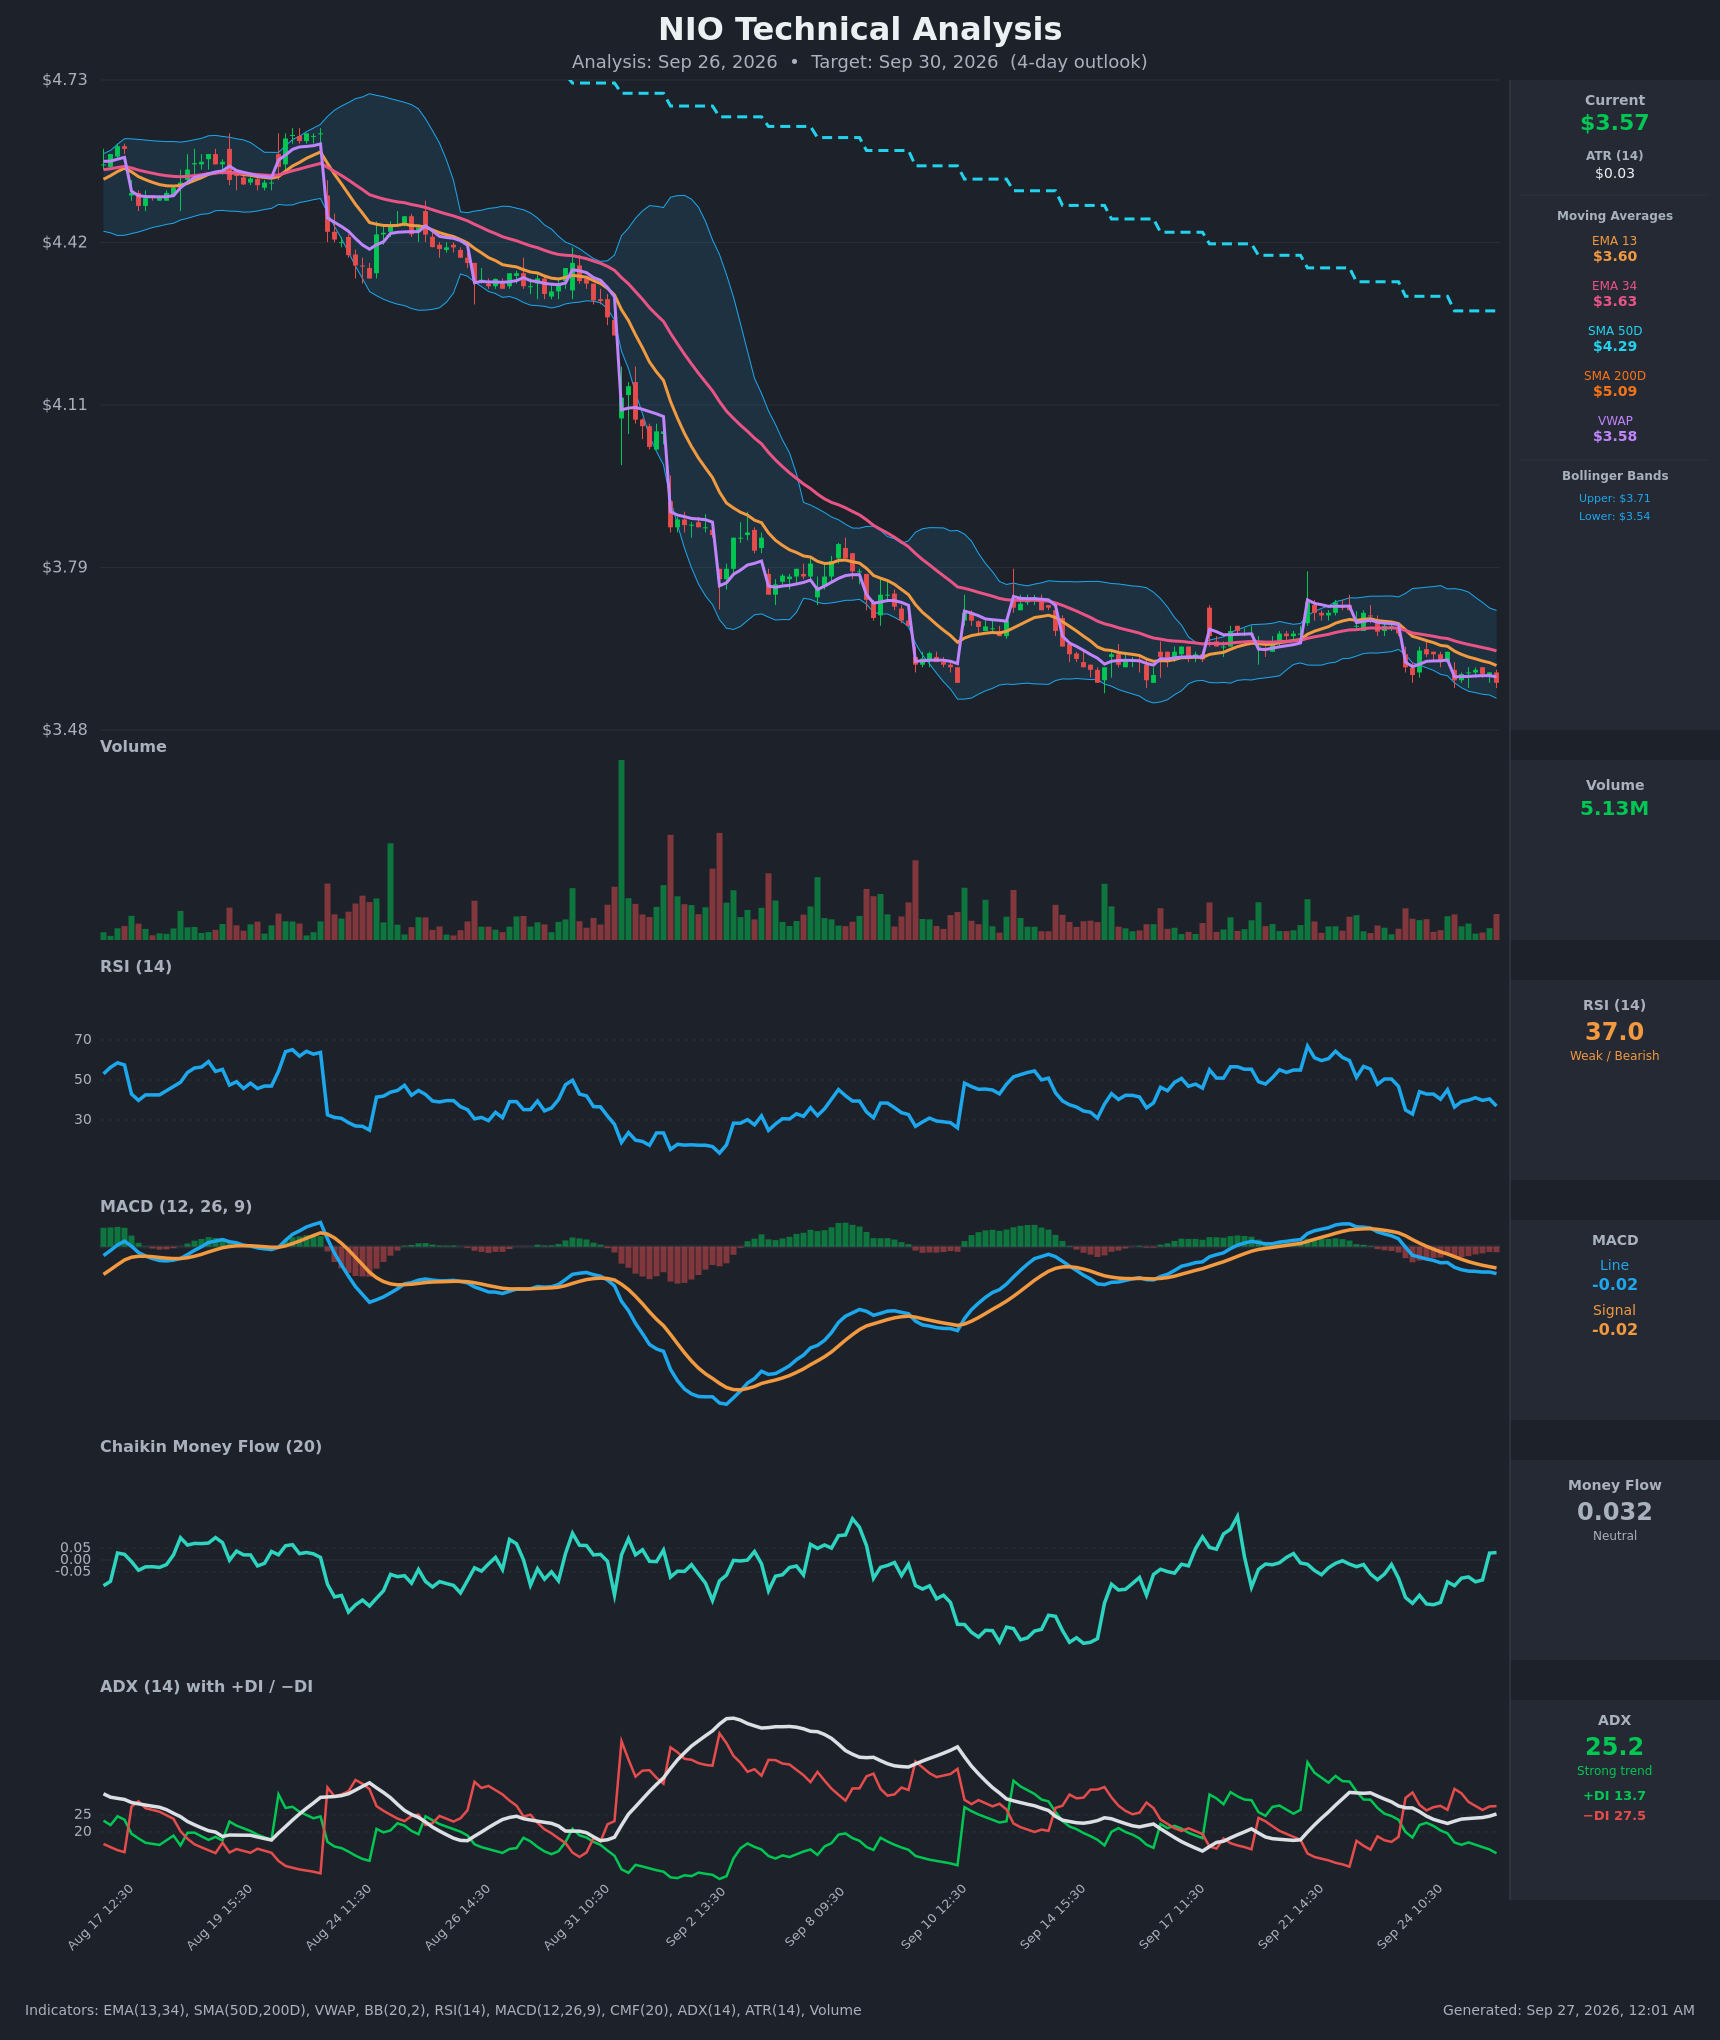
Model vs. Market: The options market implies $3.38–$3.78 into October 2; the 5-day technical model targets $3.49. The two agree on direction and scale. The model's target sits about $0.09 below spot, well within a one-standard-deviation move, so this is a modest drift call, not a breakdown call.
The technical confirmation is why the structures below center their profit zones on $3.50 and use $3.63 as the line in the sand.
Full technical write-ups: 3-day report → · 5-day report →
4 · Three ways the next five days can go
If NIO pushes up toward the $4.00 wall: $4.00 is where the October 2 call wall, put wall, and max pain all converge. It sits above the top of the implied range, so reaching it would take roughly a two-standard-deviation rally. On the way, $3.63 (the technical reclaim level), $3.77 (the 20-day average), and $3.79 (swing resistance) are successive speed bumps. A close above $3.63 alone would invalidate the bearish lean.
If NIO drifts between $3.50 and $3.63: This is the base case that dampening dealer hedging tends to favor. Realized movement has been unusually subdued for NIO, and positive-gamma hedging tends to lean against moves in both directions. Max pain at $4.00 is too far away to act as much of a pull in five days. A slow slide toward the $3.50 strike, where the technical models also point, fits the current tape.
If NIO breaks below $3.55: A fresh 52-week low puts the $3.50 strike and then the $3.38 lower rail in view. The technical models' breakdown scenarios target $3.42–$3.48. Because the gamma flip estimate is far below at about $1.50, hedging flows would still tend to cushion rather than accelerate a slide. A break would likely be orderly rather than a waterfall, unless the expensive put skew starts getting monetized aggressively.
5 · Three defined-risk structures
Prices are end-of-day midpoints as of September 25, 2026. All structures are hypothetical unless flagged as an entered position. Verify live prices before trading — these will be stale by the open.
A note on NIO options: with the stock under $4, most contracts trade just a penny or a few cents wide. That sounds tight, but it can be 10–60% of a cheap option's price. Slippage is the dominant cost here, so use limit orders at or near the midpoint.
If you lean bearish: $4/$3.50 bear put spread (best fit)
- Trade: Buy the October 2 $4 put (mid $0.43), sell the October 2 $3.50 put (mid $0.045).
- Debit: $0.385 ($38.50 per spread) · Max profit: $11.50 at or below $3.50 · Max loss: $38.50 above $4.00 · Break-even: $3.615
- Mechanics: You pay for a put spread and profit as the stock falls toward the short strike.
- Why it fits: The break-even sits above spot, so the trade makes a little money even if NIO simply stays flat. That suits a slight bearish lean whose track record argues for humility. Max profit lands at $3.50, the technical support level both models point toward.
- Tradeoff: You risk more than you can make. This is a high-probability, small-payoff structure, not a lottery ticket.
- Makes sense only if: NIO stays below the $3.63 reclaim level and the steep put skew persists.
- Invalidated if: NIO closes above $3.63.
- Managing it: Take profits around $0.08–$0.09 of the $0.115 potential if a drift toward $3.50 comes early. The trend reads all point down, but a short-dated position fighting a fading-momentum tape is best closed early rather than held to expiration. Exit on any close above $3.63.
- Liquidity note: The $4 puts traded 4¢ wide ($0.41/$0.45, about 9% of mid), and the $3.50 puts 1¢ wide ($0.04/$0.05, about 22% of mid). Expect to give up a cent or two versus the midpoint.
- Analyze this position →
If you expect the range to hold: $4/$3.50/$3.00 put butterfly
- Trade: Buy one October 2 $4 put ($0.43), sell two October 2 $3.50 puts ($0.045 each), buy one October 2 $3 put ($0.015).
- Debit: $0.355 ($35.50) · Max profit: $14.50 at exactly $3.50 · Max loss: $35.50 above $4.00 or below $3.00 · Break-evens: $3.355 and $3.645
- Mechanics: You pay a small debit for a tent-shaped payoff that peaks at the middle strike. You are betting on a pin, not a trend.
- Why it fits: Estimated positive dealer gamma and unusually low realized movement favor a contained drift. The break-evens span most of the $3.38–$3.78 implied range's lower half, and the peak sits on the technical models' target zone.
- Tradeoff versus the bear put spread: It costs a bit less and pays more at $3.50, but it gives the gain back if NIO breaks hard toward $3.
- Makes sense only if: You expect a slow slide, not a breakdown below $3.36.
- Invalidated if: NIO closes above $3.645 or below $3.355.
- Managing it: Butterflies gain most in the final days. Consider closing at 40–50% of max profit if NIO sits near $3.50 by the September 30 checkpoint rather than risking an expiration-day swing.
- Liquidity note: Same strikes as above, plus the $3 puts at 1¢ wide ($0.01/$0.02). Three legs means three rounds of slippage, so work the order as a single spread at the midpoint.
- Analyze this position →
If you lean bullish: $3.50/$4 bull call spread
- Trade: Buy the October 2 $3.50 call (mid $0.125), sell the October 2 $4 call (mid $0.015).
- Debit: $0.11 ($11) · Max profit: $39 at or above $4.00 · Max loss: $11 below $3.50 · Break-even: $3.61
- Mechanics: You pay a small debit for upside, capped at the short strike.
- Why it fits the contrarian case: IV rank 18 makes owning calls cheap. The heaviest call buying keeps concentrating at $4, and money-flow readings hint selling may be tiring. The short strike sits right on the $4.00 wall and max pain.
- Makes sense only if: NIO reclaims $3.63 early in the window. Otherwise it fights both the trend and our positioning read.
- Invalidated if: NIO closes below $3.50.
- Managing it: Take half off if NIO tags the $3.77–$3.79 zone. Every trend horizon points down, so don't hold a bounce trade hoping for more. Close by the September 30 checkpoint if $3.63 hasn't been reclaimed.
- Liquidity note: The $3.50 calls traded 1¢ wide ($0.12/$0.13, about 8% of mid) with 1,221 contracts of volume. The $4 calls were 1¢ wide ($0.01/$0.02) but that's 67% of their mid. Fills are workable, though the short leg's premium is essentially a penny.
- Analyze this position →
If none of these: no trade
Standing aside is a reasonable call this week. The directional lean is only slight, and the nearest-dated skew reading is distorted by NIO's coarse strike spacing. Percentage slippage on sub-$0.50 options can eat a meaningful share of each structure's edge.
Selling premium doesn't rescue the setup either:
- IV rank is 18.
- The gap between priced-in and delivered movement is below its usual size for NIO.
- Out-of-the-money credits at these strikes are a penny or two.
If you can't get fills near the midpoint, or you'd rather not bet against a stock sitting on its 52-week low, waiting for a decisive close either below $3.55 or above $3.63 is a legitimate choice.
6 · Quick FAQ
What is NIO's expected move this week? About ±$0.20 (±5.54%) into the October 2 expiration, a $3.38–$3.78 range, per the options market's straddle pricing as of September 25.
Is NIO expected to go up or down over the next week? Options positioning as of September 25 leans slightly bearish, because near-dated put protection has become unusually expensive and the price trend is down. That is a read of what traders have done, not a forecast. The actionable map is the $3.38–$3.78 range, support at $3.55, and resistance at $3.63 and $4.00.
Are NIO options expensive right now? No. IV rank is 18/100, so option prices are lower than 82% of the past year's readings. They are running about 10.7 vol points above the movement NIO has actually delivered, which is richer than only about a third of this stock's recent readings. That modestly favors buying defined-risk structures over selling premium.
Where is NIO's biggest options support and resistance? For the October 2 expiration, the call wall and the put wall both sit at $4.00, along with max pain. That strike is resistance above the implied range; the put wall there is not acting as support below spot. Structural support is the $3.55 52-week low.
What invalidates this week's read? A close above $3.63.
Methodology & disclosures. Data: end-of-day options-chain snapshot for NIO, 2026-09-25, generated 2026-09-27T00:01:54Z. Prices shown are midpoints and will differ from live markets. Momentum/positioning scores and volatility-premium comparisons are descriptive measurements of past option flow and past price movement — not investment advice, signals, forecasts, or guarantees. All trade structures are hypothetical. Every structure shown has a defined maximum loss; you can lose the entire max-loss amount. Options involve substantial risk and are not suitable for all investors.