PFE Options Outlook: Will the $30 Wall Hold Into November 6?
Options imply a $29.34–$31.70 range for Pfizer into the November 6 expiration. The biggest call and put piles both sit at $30, earnings land the following Monday, and we lean neutral with a slight bullish tilt.
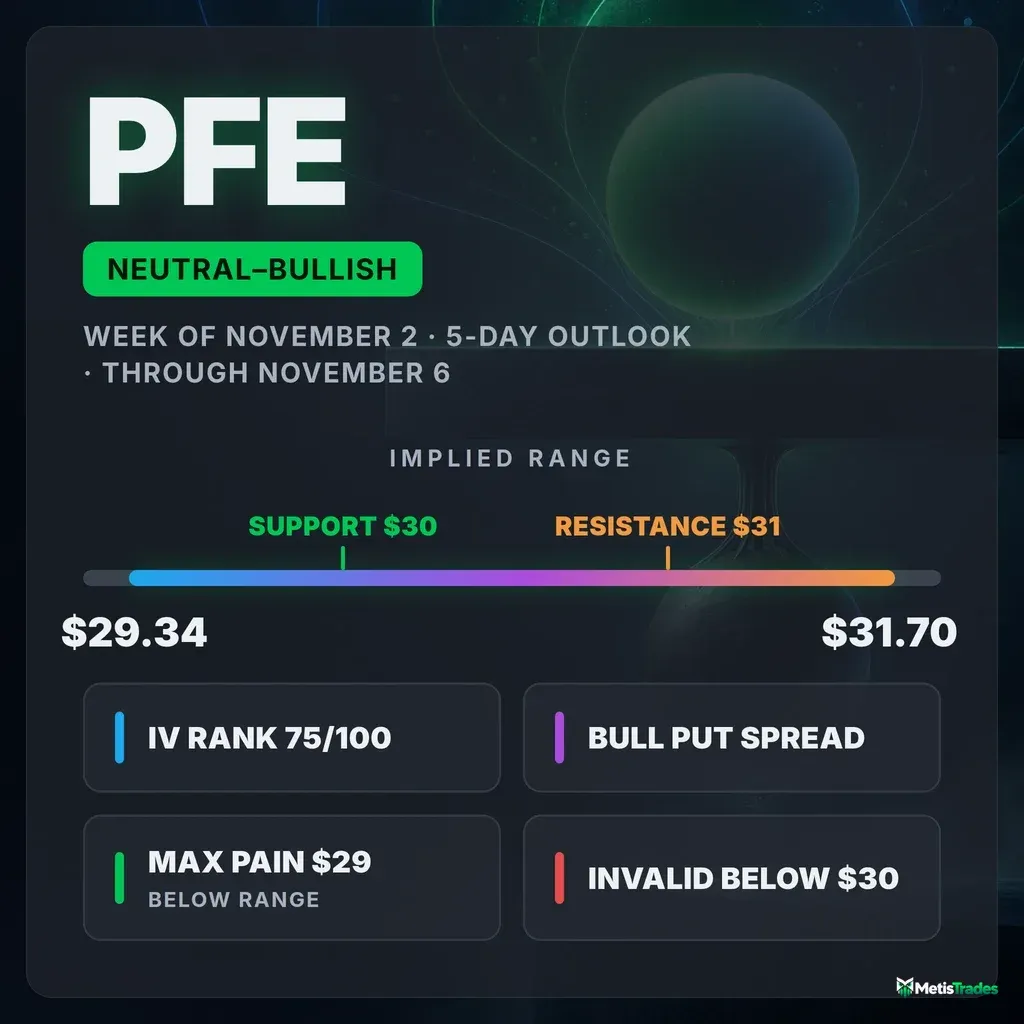
The options market implies a $29.34–$31.70 range for PFE into November 6. Below: what is driving that range, the levels that matter, and three defined-risk ways to trade it that all expire before the November 9 earnings report.
Published Sunday, November 1, 2026 · Data as of Friday, October 30, 2026 close
Explore the live PFE options data in the Detailed Options Analyzer →
Quick answer
| Item | Answer |
|---|---|
| Market bias | Neutral with a slight bullish tilt |
| Options-implied range (into Nov 6) | $29.34 – $31.70 (±3.88%, about ±$1.18) |
| Major support | $30.00 (put wall for the Nov 6 expiration) |
| Major resistance | $31.00 (heaviest Nov 6 call open interest above spot). The Nov 6 call wall is $30.00, which already sits below the $30.52 close. |
| Max pain (Nov 6) | $29.00 |
| Dealer gamma regime (estimate) | Positive, so hedging tends to dampen moves; flip level ≈ $29.00 |
| Volatility condition | Rising. IV rank 75/100 (75.38). Premium is rich: options are priced about 7 vol pts above delivered movement (earnings-inflated) |
| Next earnings | Monday, November 9, 2026 (before open), after the Nov 6 expiration |
| Technical check | Confirms (bullish; 4-day target $30.80, 6-day target $30.85) |
| Best-fitting strategy | Bull put credit spread, Nov 6 $29.50/$28.50. Fits only while PFE holds above $30. |
| Analysis invalidated if | PFE closes below $30.00 |
1 · What matters today
Our read on Pfizer (PFE) for the five sessions through November 6 is neutral with a slight bullish tilt. The main reason is the trend. The stock has climbed almost 10% in a month to $30.52, just under its 52-week high. The heavy put demand in the chain reads more like protection on a stock near its highs than a bet on a drop.
The options market is pricing about $1.18 of movement either way. That is the move baked into option prices, and it gives a $29.34–$31.70 range.
The level that changes the picture is $30.00. The biggest piles of both calls and puts expiring November 6 sit there, and a close below it kills the tilt. Options expiring after November 6 carry extra premium because earnings land before the open on Monday, November 9.
Both chart-model reads lean bullish, which confirms the tilt.
2 · What the options market is pricing
What changed this week
PFE gained 1.63% over the past five sessions and 9.78% over twenty. That longer climb agrees with the bigger picture: the trend reads up over roughly one and two months, and only the past week has been flat to choppy.
Implied volatility rose 5.6% over five days, including a 6.1% jump on Friday alone. IV rank finished at 75.38, against a 7-day average of about 67, so option prices firmed into the weekend.
Flow swung hard toward calls on Friday:
- Put/call volume, meaning put activity relative to calls (above 1 means puts dominate), was just 0.18. That compares with a 7-day average of 0.45 and a 14-day average of 0.52, so Friday's buyers were overwhelmingly in calls.
- Put/call open interest (contracts currently held open) barely moved: 0.80 versus a 7-day average of 0.81. It has eased from 0.83 five sessions ago.
- Our broader read of options flow went from clearly put-heavy on October 28 to roughly flat on Friday. Its 7-day average still leans mildly bearish.
The largest new positions in live contracts were January 15, 2027 protective puts. The $27 puts added 1,518 contracts (now 35,637) and the $23 puts added 1,494. Separately, the November 13 $33 calls jumped from 51 to 1,047 contracts open.
Into Friday's expiration, the October 30 $30 calls added 2,680 contracts of open interest. That contract has now settled, so treat it as history.
Expected move
The expected move is the move the options market is pricing in, derived from at-the-money option prices. For the November 6 expiration it is about ±3.88%, or ±$1.18, around the $30.52 chain price. That gives $29.34 – $31.70.
One caveat on how that number was built. Quotes on the November 6 contract nearest the money were too lopsided to price that rung on its own: the call side showed 32.9% IV and the put side 46.8%. So we scaled the chain's blended 27.99% at-the-money IV to seven days instead. The same quote problem affects the November 13, 20 and 27 rungs, so the ladder skips to December.
| Expiration | Implied move | Range around $30.52 |
|---|---|---|
| Nov 6 (7 days; scaled from blended ATM IV) | ±3.88% | $29.34 – $31.70 |
| Dec 4 (35 days) | ±8.55% | $27.91 – $33.13 |
| Dec 11 (42 days) | ±9.39% | $27.65 – $33.39 |
| Dec 18 (49 days) | ±9.65% | $27.58 – $33.47 |
The December rungs are wide partly because of time and partly because every one of them spans the November 9 report.
Volatility
Implied volatility (IV) is the market's estimate of how much PFE will move, baked into option prices. At-the-money IV is 27.99%.
IV rank is 75/100, meaning today's IV sits three-quarters of the way up its 52-week range. The IV percentile puts it above roughly 92% of the past year's daily readings. IV is up 33.9% over 30 sessions and sits well above both its 30-day average (25.5%) and its 90-day average (23.6%). The ~60-day IV is a lower 26.4%.
Term structure means comparing option prices across expiration dates. The front-month read is unavailable today because Friday was an expiry day. On Thursday, though, front-month IV was running about 11 vol points over the ~60-day tenor, a clear sign that near-dated options are bracing for something.
The stock itself has been moving a bit more than usual. Realized volatility over 20 days is 21.0%, somewhat above this stock's own recent norm. A reading against its own norm compares PFE with its own recent history, not with the broader market.
Is premium rich or cheap? The volatility risk premium is the gap between how much movement options are priced for and how much PFE has actually delivered. When it is positive, option sellers have been collecting more than realized movement cost them.
- Options are priced about 7 vol points above what PFE has actually moved.
- That gap is richer than about 77% of this stock's own recent readings.
- The gap shrank from about 14 points in mid-October to about 5 by Thursday, then bounced Friday as IV jumped.
On paper, IV rank 75 plus a 77th-percentile premium favors collecting premium. However, some of that richness is the market pre-pricing the November 9 report, not free premium. That is why every structure below expires before the report.
Earnings on the calendar
PFE reports before the open on Monday, November 9. That is one trading day after the November 6 expiration and before the November 13 expiration.
Options expiring after a scheduled report price in the extra jump risk of that report. You can see it in the chain: November 6 at-the-money contracts carry 33–47% IV against a 28% blend, and Thursday's front-month IV sat about 11 points over the 60-day tenor. Every December rung carries that report inside it.
Each of the last four reports came in above the consensus estimate, most recently $0.77 per share against an expected $0.68.
Skew and sentiment
Skew captures the fact that puts and calls the same distance from the stock price don't cost the same. When puts are pricier, traders are paying up for crash protection.
- Downside puts are priced at 30.6% IV versus 25.1% for comparable upside calls, a gap of 5.6 vol points.
- Over the prior 60 days the median was −1.5 points, meaning calls were usually slightly richer.
- That makes the current tilt unusually steep for PFE versus its own history, and it has held near this level all week (7-day average 5.7 points).
Two things cut against that put demand:
- Friday's call-buying pace was unusually heavy for this name. Peer-relative unusual flow showed three call contracts to one put.
- Sentiment in the shortest-dated options (0–7 days) leans mildly bullish. The 7–30 day window leans mildly bearish, mostly on that same put richness. The overall regime reads "calm."
Put together, traders are buying protection and chasing calls at the same time. That is typical behavior near a 52-week high ahead of an event.
The key levels map
| Level | Price | Why it matters |
|---|---|---|
| Large gamma strike (whole chain) | $32.00 | Heavy call positioning across all expirations; a natural slow-down zone |
| Nov 6 heaviest call strike above spot | $31.00 | 4,968 calls open; the first real overhead magnet or barrier |
| 52-week high | $30.67 | Price is 0.49% below it |
| Close / chain price | $30.52 | Friday's close |
| Swing support | $30.44 | Nearest heuristic pivot support |
| Nov 6 call wall and put wall; whole-chain call wall; largest gamma strike | $30.00 | The biggest pile of open contracts on both sides for Nov 6 (5,593 calls, 4,005 puts). Walls like this often act as magnets or barriers. This is the article's line in the sand. |
| Oct 30 gap (prior close) | $29.95 | Friday's opening gap is not yet filled |
| 20-day moving average | $29.17 | Short-term trend support |
| Swing support | $29.08 | Heuristic pivot |
| Nov 6 max pain; gamma flip (estimate) | $29.00 | Max pain is the price where the most option value would expire worthless. It is also where one rough estimate places the hedging pivot. |
| 50-day moving average | $28.55 | Intermediate trend support |
| Swing support | $28.40 | Heuristic pivot |
| Large gamma strike (whole chain) | $27.00 | Second-heaviest gamma strike overall |
| 100-day / 200-day moving averages | $26.93 / $26.80 | Long-term trend floor |
| Whole-chain put wall | $25.00 | 149,139 puts open, mostly in longer-dated expirations |
| 52-week low | $23.62 | The bottom of the year's range |
Positioning and unusual flow
Market makers hedge the options they've sold. One rough estimate puts PFE in a positive gamma regime, where that hedging tends to dampen moves. This holds both for the whole chain and for the November 6 expiration on its own.
The gamma flip level is the price below which market-maker hedging tends to accelerate selling rather than cushion it. The estimate puts it near $29.00, about 5% below spot. That is roughly typical distance for this name.
In practice, this backdrop favors pinning around $30 rather than runaway moves.
Notable live flow:
- Nov 6 $33.50 calls: 1,721 traded against just 67 open. These are lottery-ticket calls at 2.5¢, roughly $4,300 of premium in total. It is a cheap upside punt, not conviction money.
- Nov 6 $25 puts: 1,010 traded against 189 open, at a penny and a half. Someone wanted crash insurance through Friday.
- Nov 20 $29.50 puts: 2,042 traded against 866 open. About $116,000 of premium, last printed at the ask. This is real money buying protection that spans the earnings report.
3 · Technical check
4-day report (target November 4): bullish, with a target of $30.80 and a projected range of $29.90–$31.35. The model cites a strong and rising trend reading (ADX 32.6, with buyers firmly in control). The target sits inside the options-implied range, so it confirms our tilt. The report's dominant scenario is invalidated on a close below $30.20, which lines up neatly with the $30 wall.
6-day report (target November 6): also bullish, with a target of $30.85 and a projected range of $29.85–$31.55, again inside the implied range. This one confirms as well.
Both reports flag the same caution: money-flow readings are flat near zero, so buying volume hasn't fully backed the gap higher.
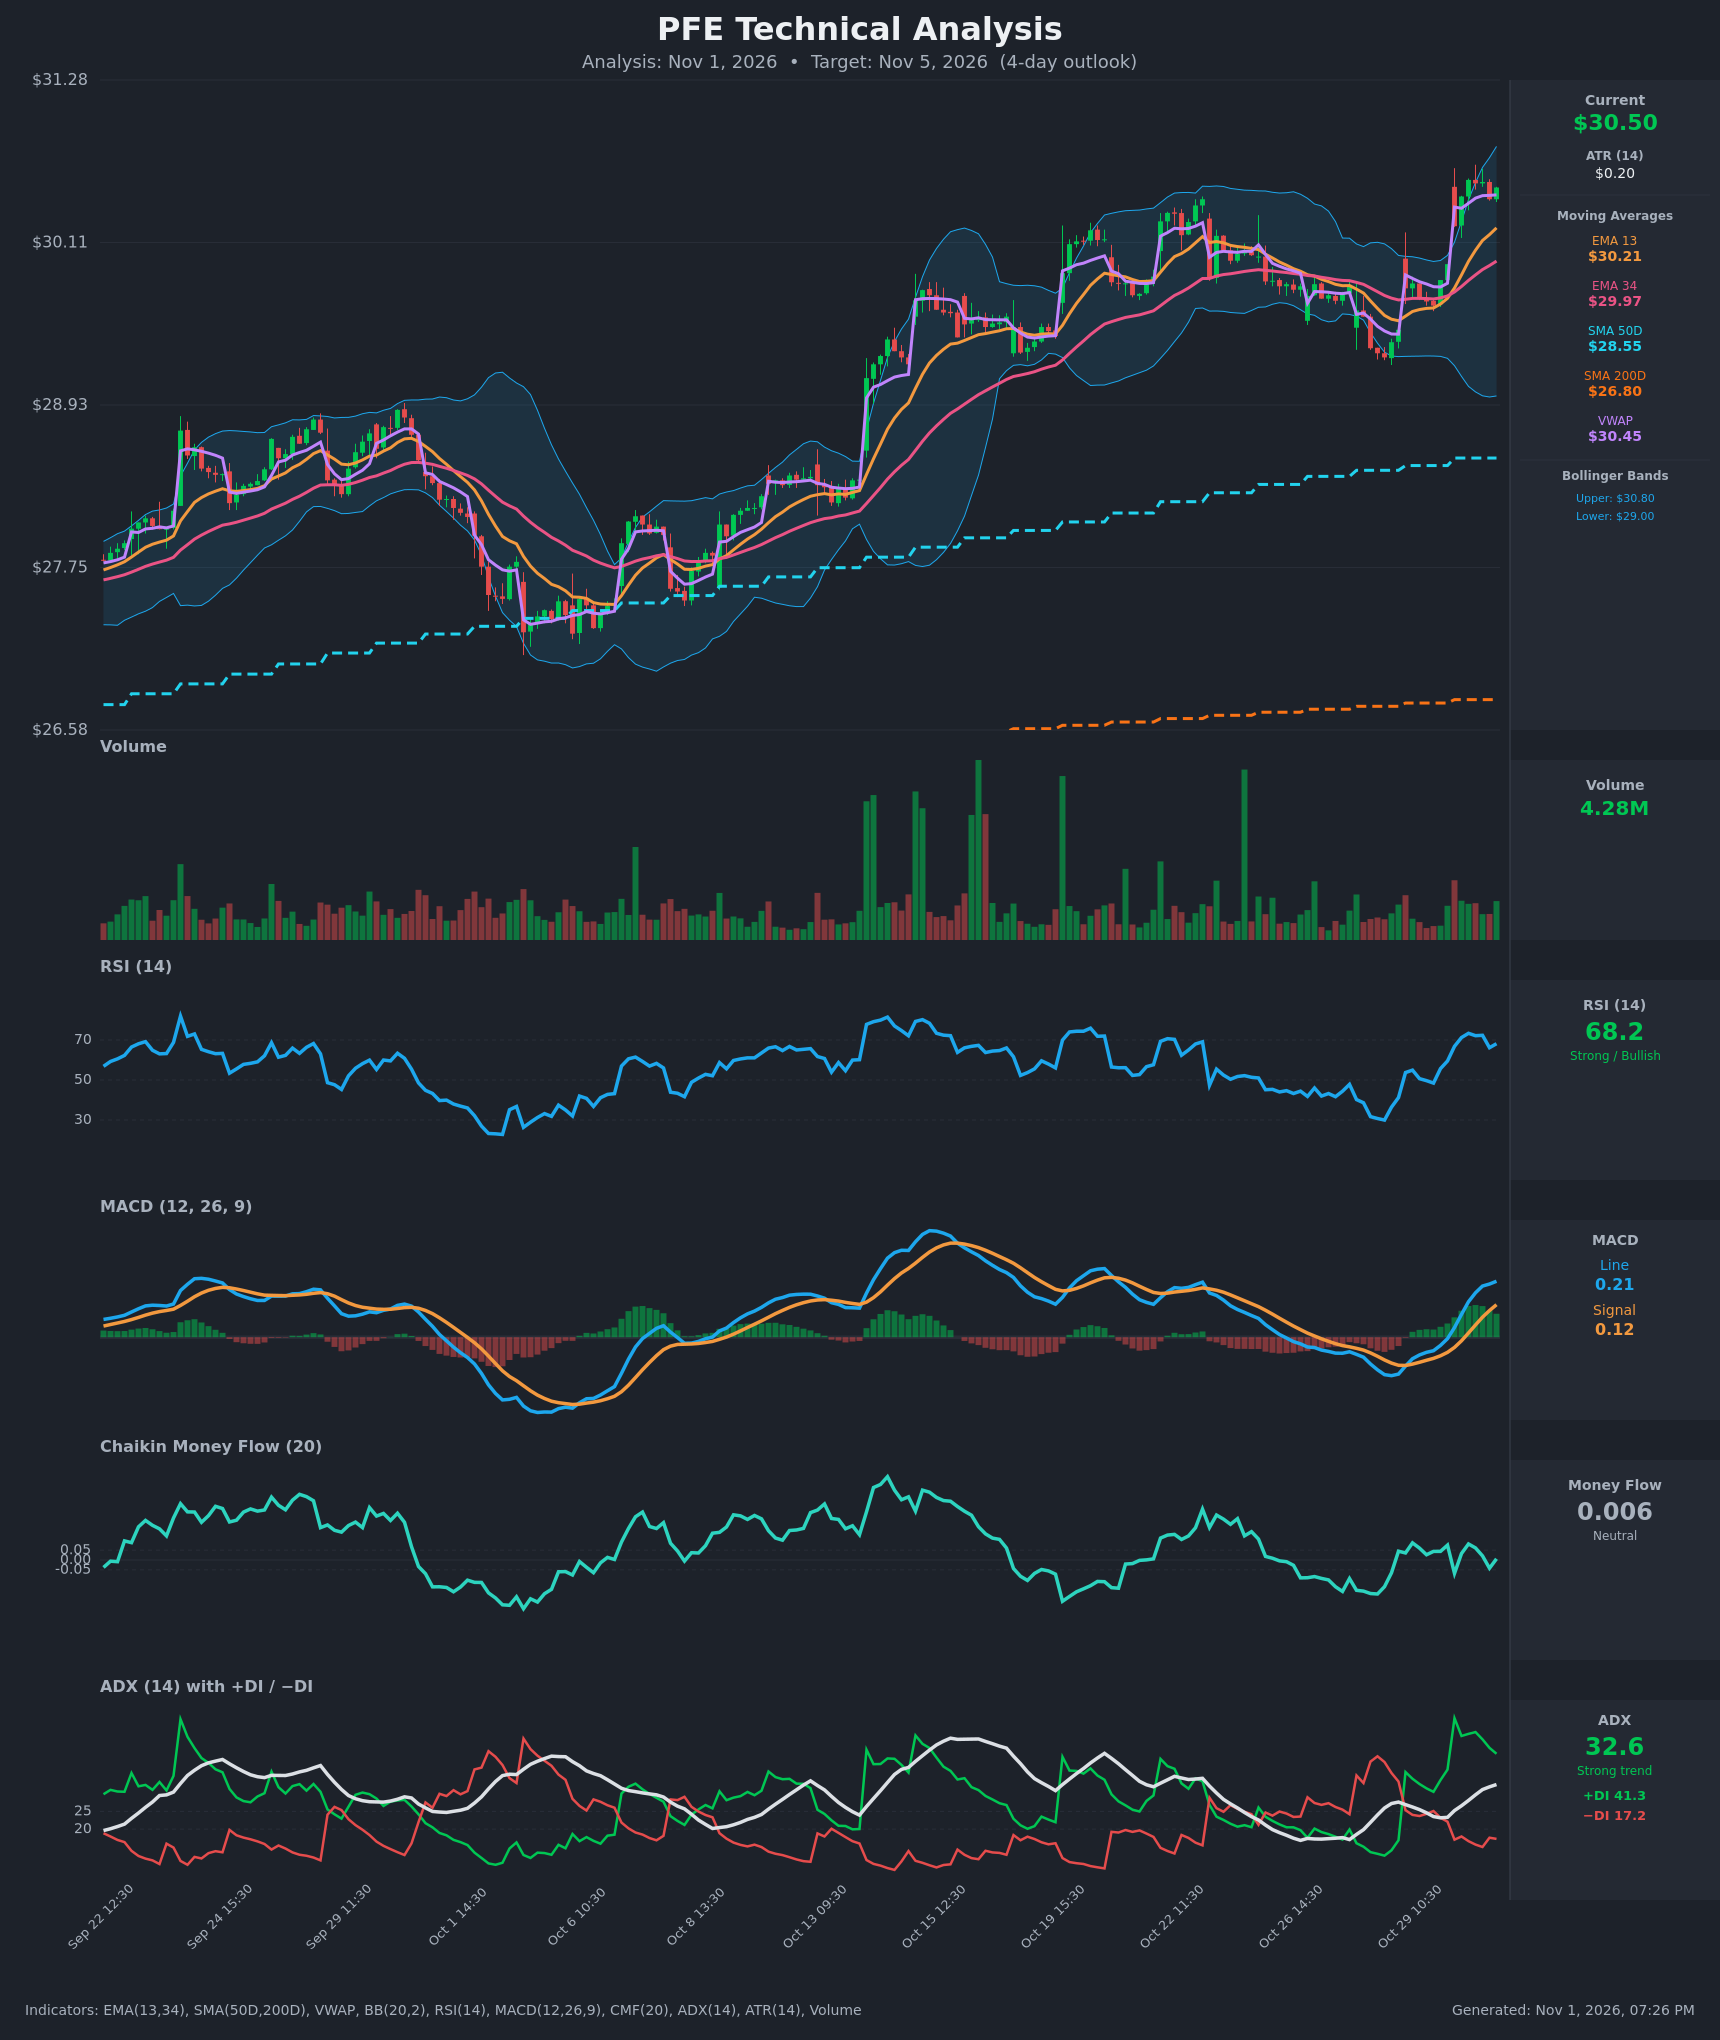
Model vs. Market: The options market implies $29.34–$31.70 into November 6; the 6-day technical model targets $30.85. The chart sees modest continuation, while options positioning ($30 walls, $29 max pain) leans toward a pin just below spot. Which side wins the $30.00–$30.80 zone decides the week.
The TA nudged strike selection: short strikes were kept below $30 and above $31.50, leaving room for the model's $30.80–$30.85 target.
Full technical write-ups: 3-day report → · 5-day report →
4 · Three ways the next five days can go
If PFE pushes above $31.00: The heaviest November 6 call open interest above spot tends to slow rallies. A clean break would also mean new 52-week highs. Above that, positioning thins out until the $32 area, where whole-chain gamma is heavy.
If PFE drifts around the $30.00 wall: This is the pin case. With both the call and put walls at $30 and estimated positive gamma, hedging flows tend to pull price toward the strike into Friday, November 6. Max pain at $29 is a weaker pull below.
If PFE breaks below $30.00: The wall support is gone, and the unfilled gap near $29.95 and the 20-day average at $29.17 come into play. If spot approaches the $29 gamma flip estimate, one rough estimate suggests market-maker hedging starts amplifying selling instead of cushioning it. That would be a headwind just as max pain sits at the same strike.
5 · Three defined-risk structures
Prices are end-of-day midpoints as of October 30, 2026. All structures are hypothetical. Verify live prices before trading — these will be stale by the open.
If you lean bullish: Bull put credit spread
You collect a credit up front and keep it if PFE stays above the short strike through expiration.
- Trade: Sell the Nov 6 $29.50 put, buy the Nov 6 $28.50 put.
- Credit: $0.24 ($24) · Max profit: $24 · Max loss: $76 · Break-even: $29.26
- Why it fits: You're selling the steeply priced puts (5.6 vol points over calls, against a negative norm) below the $30 wall. The one- and two-month trends both point up.
- Makes sense only if: PFE holds the $30.00 wall.
- Invalidated if: PFE closes below $30.00.
- Earnings exposure: Expires November 6, one trading day before the November 9 report, so it carries no earnings-gap risk.
- Managing it: Close at about 50% of max credit. Close on any daily close below $30 rather than waiting for $29 max pain to pull it in. Never carry anything into the report.
- Liquidity note: The $29.50 puts were quoted $0.33/$0.39 (6¢ wide) and the $28.50 puts $0.10/$0.14 (4¢). Pennies in dollar terms, but wide relative to these cheap prices, so work a limit near the mid.
- Analyze this position →
If you expect the range to hold: Iron condor
You sell a put spread and a call spread together, collecting a credit that you keep if PFE stays between the short strikes.
- Trade: Sell the Nov 6 $29.50/$28.50 put spread and the Nov 6 $31.50/$32.50 call spread.
- Credit: $0.38 ($38) · Max profit: $38 · Max loss: $62 · Break-evens: $29.12 and $31.88
- Why it fits: Estimated positive gamma and stacked $30 walls favor a pin. The short strikes sit just inside the $29.34–$31.70 rails, and both TA targets fall well inside.
- Makes sense only if: IV stays elevated into Friday and no surprise headline breaks the range.
- Invalidated if: PFE closes below $29.50 or above $31.50.
- Earnings exposure: Expires before the November 9 report, so it carries no earnings-gap risk.
- Managing it: Take profits at 50% of the credit. If either short strike is touched on a closing basis, close the whole condor.
- Liquidity note: The $31.50 calls traded $0.18/$0.23 (5¢) and the $32.50 calls $0.05/$0.08 (3¢). Expect to give up a cent or two per leg versus mid.
- Analyze this position →
If you lean bearish: Bear put debit spread
You pay a debit for a put spread that gains if PFE falls toward the lower strike.
- Trade: Buy the Nov 6 $30 put, sell the Nov 6 $29 put.
- Debit: $0.325 ($32.50) · Max profit: $67.50 · Max loss: $32.50 · Break-even: $29.675
- Why it fits: It targets the $29 max pain and gamma-flip estimate if the $30 wall gives way. Selling the $29 put offsets part of the rich put pricing.
- Makes sense only if: PFE loses $30 early in the week.
- Invalidated if: PFE closes above $31.00.
- Earnings exposure: Expires before the November 9 report, so it carries no earnings-gap risk.
- Managing it: This fights the one- and two-month uptrend, so take profits early (around 50% of max). Exit by the November 4 checkpoint if PFE is still above $30.20.
- Liquidity note: The $30 puts were quoted $0.51/$0.57 (6¢) and the $29 puts $0.19/$0.24 (5¢). Use limit orders.
- Analyze this position →
If none of these: no trade
Standing aside is reasonable here. The premium that looks rich is largely the market pre-pricing the November 9 report, and the November 6 contracts are cheap enough that bid-ask spreads eat a meaningful share of any edge. If you can't monitor a position daily, or you're tempted to roll into a post-earnings expiration, the cleanest choice is to wait. You can reassess after the report, when IV typically resets and the walls rebuild.
6 · Quick FAQ
What is PFE's expected move into November 6? About ±$1.18 (±3.88%), giving a $29.34–$31.70 range based on option pricing as of the October 30 close.
Is PFE expected to go up or down over the next five days? Options positioning as of October 30 leans neutral with a slight bullish tilt: an intact uptrend near the 52-week high and heavy call buying, offset by steep put protection. That is a read of what traders have done, not a forecast. The actionable map is the $29.34–$31.70 range and the $30.00 support with $31.00 resistance.
Are PFE options expensive right now? Yes, by both measures:
- IV rank is 75/100, near the top of the past year's range.
- Options are running about 7 vol points above the movement PFE has actually delivered, richer than 77% of this stock's recent readings.
Much of that is earnings-inflated, which is why the trades above expire before the report.
When is PFE's next earnings report? Monday, November 9, 2026, before the open. That is after the November 6 expiration but before November 13, which is why later expirations carry noticeably more premium.
Where is PFE's biggest options support and resistance? For November 6, both the put wall and the call wall are at $30.00, just below spot. The next overhead call cluster is $31.00, and max pain is $29.00.
What invalidates this read? A close below $30.00.
Methodology & disclosures. Data: end-of-day options-chain snapshot for PFE, 2026-10-30, generated 2026-11-01T19:26:44.560Z. Prices shown are midpoints and will differ from live markets. Momentum/positioning scores and volatility-premium comparisons are descriptive measurements of past option flow and past price movement — not investment advice, signals, forecasts, or guarantees. Earnings dates and reported results are from the data provider's earnings feed as of 2026-11-01T19:26:44.560Z; report dates can change. All trade structures are hypothetical. Every structure shown has a defined maximum loss; you can lose the entire max-loss amount. Options involve substantial risk and are not suitable for all investors.