PFE Options Are Pricing a $0.92 Move — Our Read Sees a Pin Near the $30 Call Wall
The options market implies a $29.11–$30.95 range for Pfizer into the October 30 expiration. Heavy put buying looks like hedging inside an intact uptrend, and the $30 call wall caps the upside, so our read is neutral with a range-bound base case.
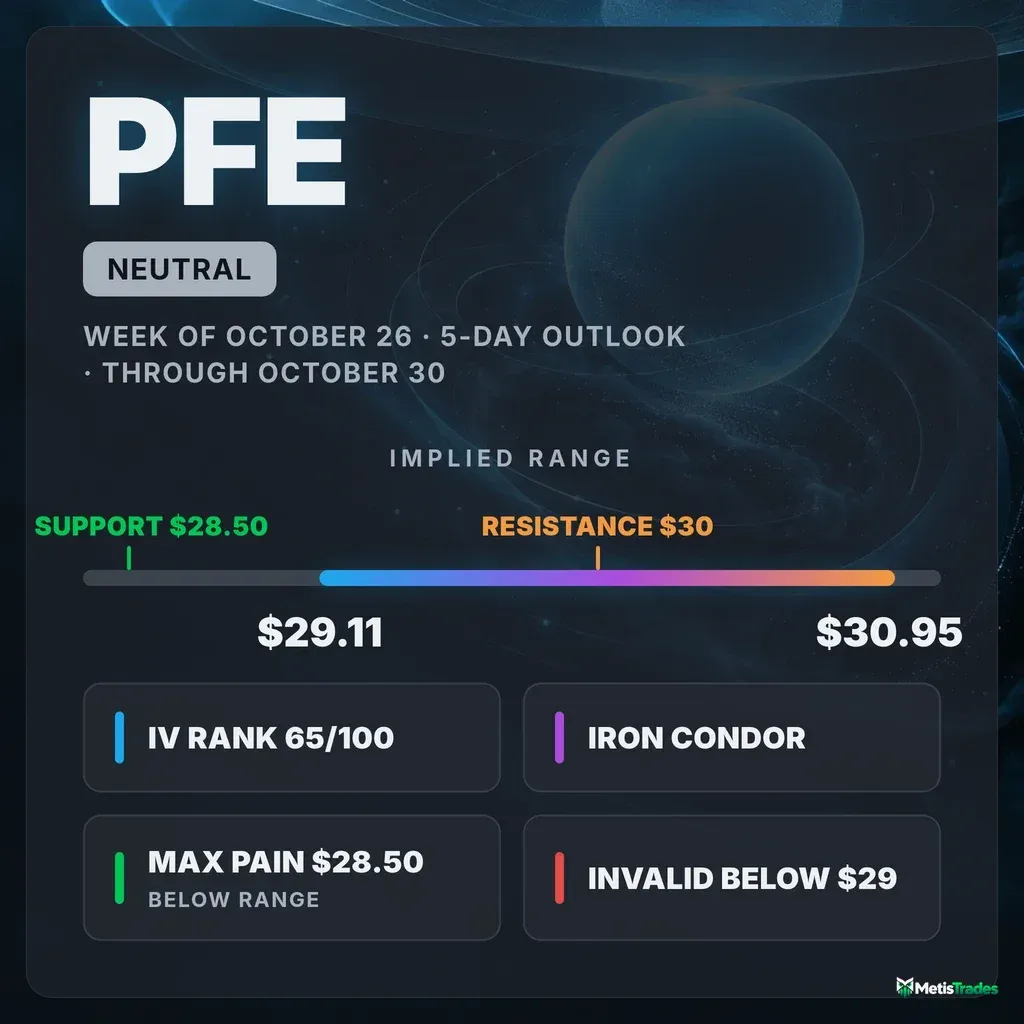
The options market implies a $29.11–$30.95 range for PFE into the October 30 expiration. Below: what's driving that range, the levels that matter, and three defined-risk ways to trade it.
Published Sunday, October 25, 2026 · Data as of Friday, October 23, 2026 close
Explore the live PFE options data in the Detailed Options Analyzer →
Quick answer
| Item | Answer |
|---|---|
| Market bias | Neutral |
| Options-implied range (into October 30) | $29.11 – $30.95 (±$0.92, ±3.07%) |
| Major support | $28.50 (October 30 put wall) |
| Major resistance | $30.00 (October 30 call wall) |
| Max pain (October 30) | $28.50 |
| Dealer gamma regime (estimate) | Positive — hedging tends to dampen moves; flip level ≈ $29 |
| Volatility condition | Falling — IV rank 64.57/100 · premium rich: options priced ~5.9 vol pts above delivered movement (earnings-inflated) |
| Next earnings | November 9, 2026 (before open) — after the October 30 expiration |
| Technical check | Mixed (3-day model bearish, target $29.85; 5-day model bullish, target $30.30) |
| Best-fitting strategy | October 30 iron condor ($29/$29.50 puts, $30.50/$31 calls), only if the range holds |
| Analysis invalidated if | PFE closes below $29.00 |
1 · What matters today
Our read on Pfizer over the next five sessions is neutral. The stock closed Friday at $30.03, sitting directly on the $30 strike. That strike carries the most open call contracts for the October 30 expiration, and big piles like that often act like a ceiling or a magnet. Traders have been buying puts aggressively, but the stock is near its 52-week high and above every major moving average. That pattern looks more like protection on gains than a bet on a drop.
The options market is pricing a move of about $0.92 either way, which gives a range of $29.11 to $30.95. The level that changes the picture is $29. Below it, market-maker hedging is estimated to speed declines rather than cushion them.
The November 9 earnings report lands after this window, so options expiring after it carry extra premium. Our two chart models split: the 3-day model leans lower and the 5-day model leans higher.
2 · What the options market is pricing
What changed this week
PFE gained 1.52% over the past five sessions and 4.74% over the past 20. The path was choppy: it reached $30.42 on October 22, then gave back part of that gain into Friday.
Options traders spent the week adding protection.
- Put/call open-interest ratio. This ratio compares put contracts held open to call contracts held open, and above 1 means puts dominate. It climbed from 0.77 to 0.83 over five sessions, above its 14-day average of 0.79. Puts are being added faster than usual for this name.
- Biggest single change. The October 30 $28.50 puts added 1,915 contracts of open interest, jumping from 518 to 2,433. That one build turned $28.50 into the expiration's put wall.
- Calls held their ground. The October 30 $30 calls added 722 contracts, bringing them to 7,680.
- Settled history. Into Friday's expiration, the now-expired $31 calls had added about 1,800 contracts.
- Implied volatility (IV). IV is the market's estimate of how much PFE will move, baked into option prices. It fell 5.7% over five sessions even as hedging rose.
The trend reads agree with each other. Over the past two-plus months the stock is up about 12%, and the shorter one-week and one-month reads are flat rather than pointing the other way.
Expected move
The expected move is the move the options market is pricing in, derived from what straddles cost. Into October 30 it is ±$0.92 (±3.07%) around the $30.03 snapshot price, a range of $29.11 to $30.95.
| Expiration | Implied move | Range around $30.03 |
|---|---|---|
| October 30 | ±3.07% | $29.11 – $30.95 |
| November 6 | ±6.31% | $28.14 – $31.92 |
| November 13 | ±7.03% | $27.92 – $32.14 |
| November 20 | ±7.56% | $27.76 – $32.30 |
The implied move roughly doubles between October 30 and November 6, a bigger jump than the extra week alone would explain. Most of the extra premium in this chain sits beyond the five-day window, as the earnings paragraph below explains.
Volatility
At-the-money implied volatility is 26.51%.
- IV rank: 64.57/100. IV rank shows where today's IV sits versus the past year. At 64.57, it is cheaper than only about 35% of the past year's readings.
- IV percentile: about 78. IV has been lower than today on roughly 78% of days.
- Direction. IV fell 2.6% on Friday and 5.7% over five sessions, but it is still up about 24% over the past 30 sessions. It sits above both its 30-day average (24.8%) and its 90-day average (23.3%).
- Term structure. This compares option prices across expiration dates. The front-month read is unavailable today because Friday was an expiry day. The ~60-day IV is 25.2%.
- Realized movement. PFE's movement over the past week is running noticeably faster than its pace over the past month, which is unusual versus this stock's own recent history. Ten-day realized volatility is 22.0%, against 17.4% over 30 days.
Is premium rich or cheap? The volatility risk premium is the gap between how much movement options are priced for and how much PFE has actually delivered. When it's positive, option sellers have been collecting more than realized movement cost them.
- The gap today. Options are priced about 5.9 vol points above PFE's 20-day realized volatility of 20.6%.
- Versus its own history. That gap sits at the 74th percentile, meaning it is richer than about 74% of this stock's own recent readings.
- The path. The gap has been shrinking steadily, from nearly 16 points in early October to about 11 a week ago and under 6 now.
- The earnings caveat. Some of that richness is the market pre-pricing the November 9 report, not free premium.
- What it means for this window. The October 30 contracts themselves carry an at-the-money IV of about 22.2%, barely above realized movement. Premium-selling in the five-day window has only a thin cushion. The rich premium lives in post-earnings expirations.
Earnings on the calendar
Pfizer reports on November 9, before the open. That is after both the October 30 and November 6 expirations but before November 13.
The chain doesn't show a clean earnings bump at November 13. Instead, November 6 options already price IV of about 32%, versus 29% at November 13. Part of that pricing reflects the report, and part reflects pricey puts on that date.
The last four reports all came in above expectations, by $0.03 to $0.24 per share. Every structure below expires before the report.
Skew and sentiment
Skew means puts and calls the same distance from the stock price don't cost the same. When puts are pricier, traders are paying up for crash protection. That is the clearest feature of PFE's chain right now:
- Puts are running about 4.95 vol points over calls (28.5% vs 23.6% IV).
- This name's 60-day norm is roughly −1.7 points, meaning calls are usually slightly richer.
- Skew is about 6.6 points steeper than normal, an unusually stretched reading compared against PFE's own recent history.
Volume tells a quieter story. Today's put/call volume ratio is 0.55, close to its 7-day average of 0.57, though above the 60-day median of 0.47. Total option volume ran at only 0.80× its 20-day average, so this was steady protection-buying rather than panic.
Sentiment in short-dated options has cooled:
- Options expiring within 7 days read flat (−1).
- Options expiring in 7–30 days lean mildly bearish (−15), against a 7-day average of +11.
- The overall regime reads "Calm": no part of the curve is showing stress.
Combined with a stock pressing its 52-week high, the steep skew reads as traders protecting a strong run rather than positioning for a breakdown.
The key levels map
| Level | Price | Why it matters |
|---|---|---|
| Large gamma strike | $32.00 | The next big cluster of open contracts above the market |
| Implied range high (October 30) | $30.95 | The top of the one-standard-deviation move the options price in |
| 52-week high | $30.44 | Rejected on October 22; a close above opens fresh highs |
| Spot (Friday close) | $30.03 | Pinned on the call wall |
| Call wall (October 30) and whole chain's heaviest call strike | $30.00 | 7,680 open calls for the expiration and 145,841 across the chain; also the largest gamma strike — the main ceiling and magnet |
| Swing support | $29.08 | Recent pivot low just under the implied range floor |
| Gamma flip (estimate) | ~$29.00 | One rough estimate puts the hedging regime change here; also a large gamma strike |
| 20-day moving average | $28.79 | Short-term trend line |
| Put wall and max pain (October 30) | $28.50 | Heaviest put open interest for the expiration and the strike where the most value expires worthless |
| Swing support | $28.40 | Prior consolidation shelf |
| 50-day moving average | $28.30 | Intermediate trend support |
| Swing support / gamma strikes | $27.64 / $27.19 / $27.00 | Deeper structural shelves |
| 100-day / 200-day moving averages | $26.72 / $26.68 | Long-term trend support, about 12.5% below |
| Whole chain's heaviest put strike | $25.00 | 151,054 puts across all expirations — far from this week's action |
| 52-week low | $23.62 | Bottom of the yearly range |
The October 30 call wall and the whole chain's heaviest call strike agree at $30. The put walls disagree: $28.50 for the five-day expiration versus $25 for the whole chain. For this window, $28.50 is the one that matters.
Positioning and unusual flow
Dealer gamma. Market makers hedge the options they've sold. One rough estimate puts both the whole chain and the October 30 expiration in a positive gamma regime, where that hedging tends to dampen moves. That regime supports a pinning case near $30. Spot sits about 3.4% above the estimated flip near $29, a fairly typical cushion for this name.
Notable flow, all in contracts that remain tradeable:
- October 30 $28 puts. 3,162 contracts traded against 1,546 open, about 2× turnover. At roughly 3.5¢ each, this is cheap disaster insurance, not a large bet.
- October 30 $30 puts. 1,864 contracts traded, about $64,000 of premium, against 713 open. Open interest rose by 284. This is fresh at-the-money protection.
- October 30 $31.50 calls. 1,498 contracts traded versus 416 open, about 3.6× turnover. Lottery-ticket upside interest sits just beyond the implied range.
Flow is running on both sides, and the heaviest money is protective. That fits a pin-and-hedge picture better than a directional one.
3 · Technical check
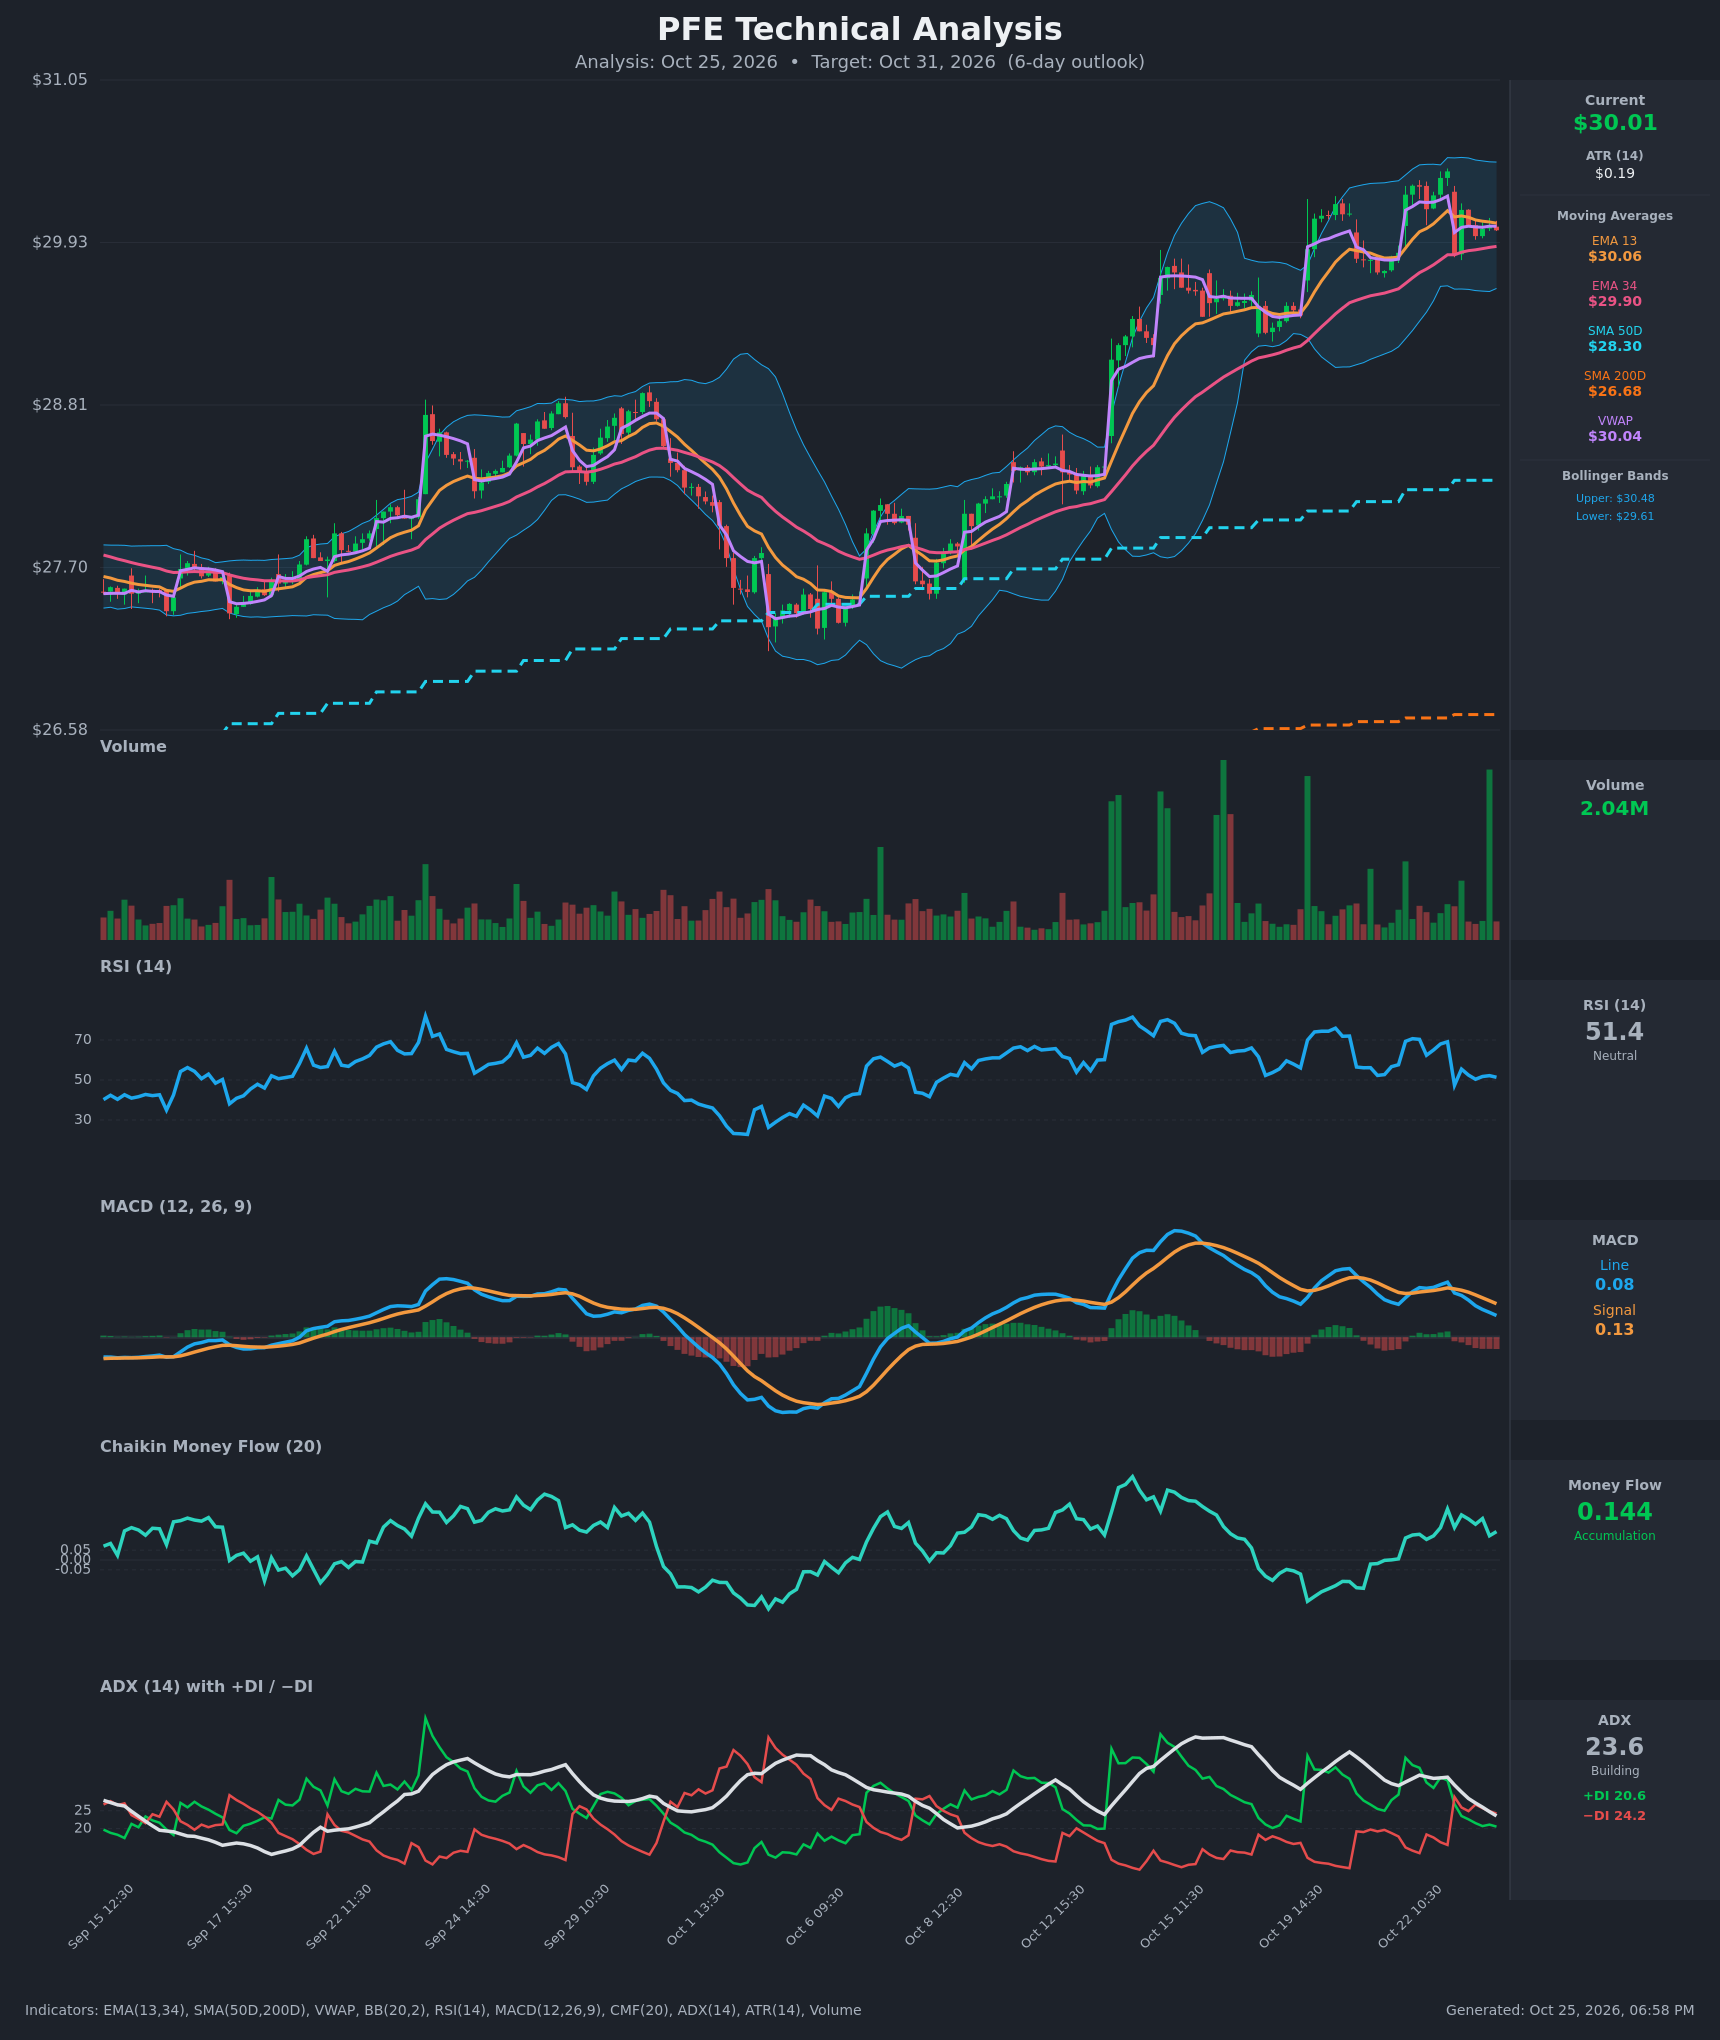
3-day model: bearish. The 3-day chart model targets $29.85 by October 28, with a predicted range of $29.40 to $30.55. Its target sits inside the options-implied range, but its direction diverges from our neutral read. It points to a fresh bearish MACD crossover and slipping momentum. Its dominant pullback scenario is invalidated by a reclaim of $30.25.
5-day model: bullish. The 5-day model targets $30.30 by October 30, with a range of $29.35 to $30.75. It favors a bull-flag breakout, supported by persistent accumulation in money flow (CMF at 0.144). Its breakout scenario is invalidated by a close below $29.80. This target also sits comfortably inside the implied range.
Net result: mixed. The two models split on direction, and both their ranges fit within the options market's $29.11–$30.95 range. Together they reinforce a contained, two-way window rather than overturning the neutral read. We used the 5-day target to keep the short call of the condor at $30.50, above the $30.30 target.
Model vs. Market: The options market implies $29.11–$30.95 into October 30; the 5-day technical model targets $30.30. That target sits just above the $30 call wall, so the question is whether the stock can break that ceiling. A close above the $30.44–$30.45 high would favor the model; a stall under $30 favors the pin.
Full technical write-ups: 3-day report → · 5-day report →
4 · Three ways the week can go
If PFE pushes above the call wall ($30.00): Heavy call open interest at $30 tends to slow rallies, and the $30.44 yearly high adds a second lid. A clean close above $30.45 would leave thinner positioning until the top of the implied range near $30.95. The $31.50 call buying suggests some traders are positioned for exactly that.
If PFE drifts between the walls: This is the base case. Positive dealer gamma tends to absorb moves, and expiring open interest often pulls price toward big strikes into October 30. That points to back-and-forth trading in the high $29s to $30. Max pain at $28.50 is the gravity point beneath. A slow drift lower toward it would hurt call holders most, but it sits outside the implied range, so a full trip there would be a stretch.
If PFE breaks below the put wall ($28.50): To get there, the stock first has to lose the ~$29 gamma flip estimate. Below that level, one rough estimate suggests market-maker hedging amplifies selling rather than cushioning it. A close under $29 would also break the $29.08 swing support and invalidate this neutral read. The heavy $28.50 and $28 put open interest would then come into play as the next shelf.
5 · Three defined-risk structures
Prices are end-of-day midpoints as of Friday, October 23, 2026. All structures are hypothetical. Verify live prices before trading — these will be stale by the open.
All three use the October 30 expiration, which lands before the November 9 earnings report.
If you lean bullish: Bull call debit spread
You pay a debit and profit if PFE rises through the long strike, with gains capped at the short strike.
- Trade: Buy the October 30 $30 call, sell the October 30 $31 call
- Debit: $0.305 ($30.50 per spread) · Max profit: $69.50 · Max loss: $30.50 · Break-even: $30.305
- Why it fits: The 5-day chart model targets $30.30 and the long-term trend is intact. Short-dated IV is near realized movement, so you aren't overpaying for the long call.
- Makes sense only if: PFE clears the $30 call wall and the $30.44 yearly high. Otherwise the wall caps it.
- Invalidated if: PFE closes below $29.85
- Earnings exposure: Expires 10 days before the November 9 report, so there is no earnings-gap risk.
- Managing it: Take profits near $0.60–$0.70 if $30.45 breaks. Exit regardless by the October 29 close rather than holding into expiration-day pinning.
- Liquidity note: The $30 calls traded 4¢ wide and the $31 calls 1¢ wide. Those are pennies, but a large share of each option's price, so work limit orders at mid.
- Analyze this position →
If you expect the range to hold: Iron condor (best fit)
You collect a credit by selling a put spread below the market and a call spread above it, and keep it if PFE stays between the short strikes.
- Trade: Sell the October 30 $29.50/$29 put spread and sell the October 30 $30.50/$31 call spread
- Credit: $0.18 ($18 per condor; $0.07 from the puts, $0.11 from the calls) · Max profit: $18 · Max loss: $32 · Break-evens: $29.32 and $30.68
- Why it fits: Positive dealer gamma and the $30 call wall argue for a pin, and both chart models' targets sit inside the short strikes. The short put sits above the ~$29 flip and $29.08 support; the short call sits above the $30.44 yearly high.
- Makes sense only if: You accept a thin cushion. Five-day premium is only modestly above realized movement, so this pays you for range-holding, not for rich volatility.
- Invalidated if: PFE closes below $29.32 or above $30.68
- Earnings exposure: Expires 10 days before the November 9 report, so there is no earnings-gap risk.
- Managing it: Close at ~50% of max credit (buy back near $0.09). If either short strike is breached on a close, close the whole position rather than hope. Exit by the October 29 close.
- Liquidity note: The $29.50 puts traded 4¢ wide, the $29 puts 6¢, the $30.50 calls 3¢ and the $31 calls 1¢. Four legs of pennies can still eat a third of an $0.18 credit, so insist on mid or skip it.
- Analyze this position →
If you lean bearish: Bear put debit spread
You pay a debit and profit if PFE falls through the long put strike, with gains capped at the short strike.
- Trade: Buy the October 30 $30 put, sell the October 30 $28.50 put
- Debit: $0.305 ($30.50 per spread) · Max profit: $119.50 · Max loss: $30.50 · Break-even: $29.695
- Why it fits: The short strike sits at the $28.50 put wall and max pain, where downside gravity concentrates. The 3-day chart model leans lower toward $29.85.
- Makes sense only if: PFE loses the $29 flip estimate, where hedging may start amplifying the move.
- Invalidated if: PFE closes above $30.44
- Earnings exposure: Expires 10 days before the November 9 report, so there is no earnings-gap risk.
- Managing it: Take profits if PFE reaches $29 or the spread doubles. Exit by the October 29 close. The longer-term trend is still up, so don't overstay a pullback.
- Liquidity note: The $30 puts traded 5¢ wide and the $28.50 puts 2¢ wide. Use limit orders near mid.
- Analyze this position →
If none of these: no trade
Standing aside is a defensible choice here. The headline premium looks rich, but most of it is earnings-inflated, and the October 30 contracts are priced only modestly above PFE's realized movement. Sellers get a thin cushion for gamma risk in the final week.
The directional cases are weak in both directions. Put demand is steep but reads as hedging, and the chart models cancel each other out. The bid-ask spreads on sub-$0.50 options take a meaningful slice of any edge.
If you'd rather trade the post-earnings premium, that is a separate decision with overnight gap risk, and it sits outside this article's window.
6 · Quick FAQ
What is PFE's expected move this week? About ±$0.92 (±3.07%) into the October 30 expiration, a range of $29.11 to $30.95. This is based on straddle pricing as of the October 23 close.
Is PFE expected to go up or down over the next week? Options positioning as of October 23 reads neutral. Put buying is heavy, but it looks like hedging inside an uptrend near the 52-week high. That is a read of what traders have done, not a forecast. The actionable map is the $29.11–$30.95 range, with $28.50 support and $30.00 resistance.
Are PFE options expensive right now? IV rank of 64.57/100 says option prices are higher than about 65% of the past year's readings. They're also running about 5.9 vol points above PFE's delivered movement, richer than 74% of this stock's own recent readings. Much of that richness reflects the November 9 report, and the five-day contracts are priced much closer to realized movement.
When is PFE's next earnings report? November 9, 2026, before the open. That is after the October 30 and November 6 expirations, which is why options expiring later carry noticeably more premium.
Where is PFE's biggest options support and resistance? For October 30, the put wall is $28.50 (also max pain) and the call wall is $30.00.
What invalidates this week's read? A close below $29.00, the estimated gamma flip, where hedging may start to amplify selling.
Methodology & disclosures. Data: end-of-day options-chain snapshot for PFE, 2026-10-23, generated 2026-10-25T18:58:15.661Z. Prices shown are midpoints and will differ from live markets. Momentum/positioning scores and volatility-premium comparisons are descriptive measurements of past option flow and past price movement — not investment advice, signals, forecasts, or guarantees. Earnings dates and reported results are from the data provider's earnings feed as of 2026-10-25T18:58:15.661Z; report dates can change. All trade structures are hypothetical. Every structure shown has a defined maximum loss; you can lose the entire max-loss amount. Options involve substantial risk and are not suitable for all investors.