RGTI Options Are Pricing a $1.44 Move Into September 25 — The Chart Model Sees a Much Tighter Path
The options market implies a $14.32–$17.20 range for RGTI into the September 25 expiration, while both technical reports target $16.05 inside a far narrower band. Here's what the positioning data actually shows, the levels that matter, and three defined-risk ways to trade the gap.
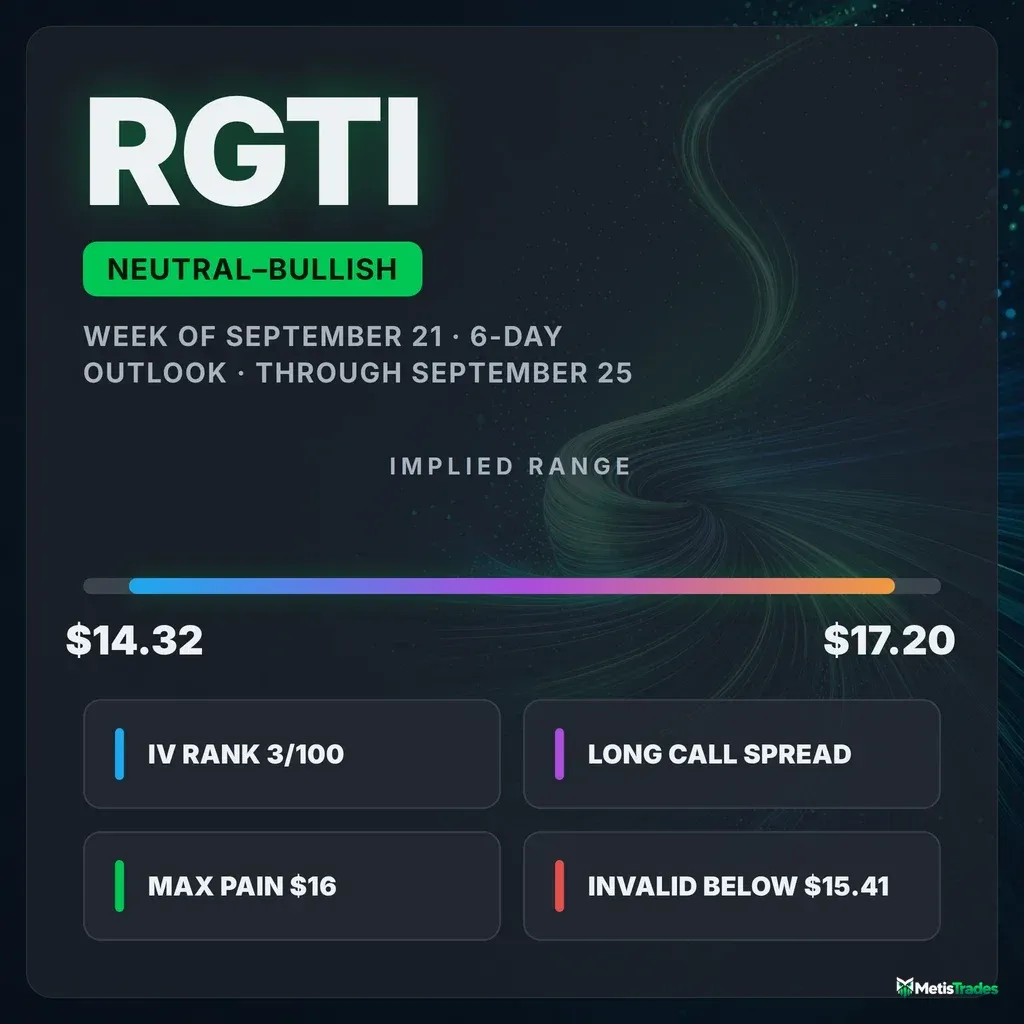
The options market implies a $14.32–$17.20 range into the September 25 expiration; here's what's driving it and three defined-risk ways to trade it.
Published Saturday, September 19, 2026 · Data as of Friday, September 18, 2026 close
Explore the live RGTI options data in the Detailed Options Analyzer →
Quick answer
| Item | Answer |
|---|---|
| Market bias | Slightly bullish |
| Options-implied range (into Sep 25) | $14.32 – $17.20 (±9.16%, about $1.44 up or down) |
| Major support | $14.00 (Sep 25 put wall) |
| Major resistance | $24.00 (Sep 25 call wall — far above spot; the whole chain's heaviest call strike is $20.00) |
| Max pain (Sep 25) | $16.00 |
| Dealer gamma regime (estimate) | Positive — hedging tends to dampen moves; flip level ≈ $24.00 (estimate) |
| Volatility condition | Falling — IV rank 3/100 · premium thin: options priced about 5.7 vol points below delivered movement |
| Technical check | Confirms (bullish, 3-day and 6-day horizons) |
| Best-fitting strategy | Sep 25 $16/$17 call debit spread |
| Analysis invalidated if | RGTI closes below $15.41 |
1 · What matters today
RGTI closed Friday, September 18 at $15.76 after a 3.21% gain over five sessions, and the options market is pricing about $1.44 of movement in either direction into the September 25 expiration — a $14.32 to $17.20 band. That figure comes from what straddles cost at the money, and it is wide because this stock has actually been moving that much.
Our read of the flow leans mildly higher: call open interest is building at the $17 and $18 strikes for next Friday, calls are priced richer than puts by more than this name's own norm, and max pain — the price where the most option value would expire worthless — sits at $16.00, just above spot. Both technical reports agree, targeting $16.05. The honest caveat is that everything above happens inside a stock still down 7.2% over roughly two months.
The level that changes the picture: a close below $15.41.
2 · What the options market is pricing
What changed this week
Money moved toward calls and away from fear. Put/call open interest sits at 0.83 — for every call contract held open there are 0.83 puts — down from a 14-day average of 0.91, meaning puts thinned out relative to calls over the past two weeks. Put/call volume ran 0.47 on Friday, a touch heavier on the put side than its 7-day average of 0.36, but still firmly call-dominated in absolute terms. Total option volume came in at 1.33 times its 20-day average, so this was an active session rather than a quiet one.
The largest still-tradeable open-interest build was in the September 25 $17.50 calls, which added 900 contracts to reach 1,702, followed by the $18 calls (+690) and the $17 calls (+633) at the same expiration — traders paying up for a move that would need $1.24 to $2.24 of upside in six days. Into Friday's expiration, by contrast, the $16 calls added 1,014 contracts of open interest on 2,562 lots of volume; those have now settled and are history, not a live magnet.
Implied volatility kept bleeding: the market's estimate of how much RGTI will move, baked into option prices, fell 5.93% over five sessions and is down 32.81% over thirty. The momentum composite that blends option-flow signals reads +25 today against a 7-day average of +15 and a 14-day average of +10 — the flow lean has been strengthening, not spiking once.
One piece of tension worth naming: the past week's 3.21% pop runs against a stock that is down 1.90% over 20 sessions and 7.24% over roughly 50. The short- and long-term trend reads point in different directions, which argues for shorter-dated structures and earlier profit-taking rather than swinging for a trend reversal.
Expected move
The options market is pricing a 9.16% move — roughly $1.44 up or down from $15.76 — through next Friday's expiration. That number is the standard one-standard-deviation approximation derived from at-the-money option prices at that date.
| Expiration | Implied move | Range around $15.76 |
|---|---|---|
| Sep 25 (7 DTE) | ±9.16% | $14.32 – $17.20 |
| Oct 2 (14 DTE) | ±13.84% | $13.58 – $17.94 |
| Oct 16 (28 DTE) | ±19.32% | $12.72 – $18.80 |
The rungs scale almost exactly the way time alone would predict — there is no step-up or kink anywhere on the ladder, which means the chain is not bracing for any single dated event inside the next month.
Volatility
At-the-money implied volatility sits at 67.8%, with an IV rank of 3/100 — today's reading is cheaper than about 97% of the past year's readings for this name. That is not a rounding artifact: the 30-day average sits at 75.4% and the 90-day average at 95.0%, so option prices have compressed hard. The front-month read is unavailable today because Friday was an expiration day and the nearest contract had zero days left, so there is no usable comparison of near-dated versus 60-day pricing this session.
Against this stock's own history, realized movement is unusually subdued: 20-day realized volatility of 73.5% is well below RGTI's recent norm, even though it would look extreme on almost any other ticker. Five-day realized movement is running slightly slower than the 20-day pace, so the stock is not accelerating.
Premium rich or cheap. The volatility risk premium — the gap between how much movement options are priced for and how much RGTI has actually delivered — is negative at about 5.7 vol points. In plain terms, at-the-money options are priced for less movement than the stock has been producing over the past month, so option sellers have recently been collecting less than realized movement cost them. That gap sits right at the 50th percentile of this stock's own recent readings, meaning it is a normal-for-RGTI state rather than an extreme. Combine it with an IV rank of 3/100 and the verdict is straightforward: this week favors owning premium over selling it. The path matters too — the gap was mildly positive on September 8 and has drifted negative over the last two sessions as implied volatility fell faster than the stock calmed down.
Skew and sentiment
Puts and calls the same distance from the stock price don't cost the same, and here the tilt runs the unusual way: 25-delta calls are priced at 71.8% implied volatility versus 66.5% for the equivalent puts, so calls carry roughly a 5.3 vol point premium over puts, against a 60-day norm of about 3.5 points for this name. Traders are paying up for upside, not crash protection — a reading meaningfully above this stock's own recent norm.
Sentiment in short-dated options reinforces that, with a wrinkle. The 0–7 day bucket scores a flat +3 — essentially no directional lean in the contracts expiring next Friday, and it is the only bucket where the data thinned out enough that just one input fired. The 7–30 day bucket reads +47 and the 30–60 day bucket +56, both strongly call-leaning, against 7-day averages of +33 and +28. The file's one-phrase summary for this shape is "Bullish Recovery": positioning is building further out the curve than in the immediate front week.
The key levels map
| Level | Price | Why it matters |
|---|---|---|
| Call wall (Sep 25) | $24.00 | Heaviest call open interest at this expiration (5,312 contracts) — far enough above spot that it caps nothing this week |
| Whole chain's heaviest call strike | $20.00 | 27,923 calls across all expirations; 2,241 of the Sep 25 $20 calls traded Friday — the first genuine overhead pile |
| 200-day average | $18.86 | Price sits 16.4% below it — the long-term trend is still down |
| 100-day average | $18.05 | Price sits 12.7% below |
| Top of the 6-day implied range | $17.20 | The ceiling option prices imply for next Friday |
| Swing resistance | $17.05 | Prior pivot cluster from the daily price feed |
| Swing resistance | $16.12 | Nearest overhead pivot |
| Max pain (Sep 25) | $16.00 | Where the most option value would expire worthless; also the chain's single largest gamma pile |
| 50-day average | $15.95 | The resistance both technical reports name |
| Friday's close | $15.76 | Chain snapshot price — all strike math anchors here |
| 20-day average | $15.67 | Price sits 0.55% above it |
| Swing support | $15.56 | Nearest pivot below spot |
| Technical support | $15.41 | Moving-average/VWAP confluence; the invalidation line in both TA reports |
| Whole chain's heaviest put strike | $15.00 | 31,314 puts across all expirations and the second-largest gamma pile — the real downside shelf |
| Swing support | $14.60 | Pivot cluster |
| Bottom of the 6-day implied range | $14.32 | The floor option prices imply for next Friday |
| Put wall (Sep 25) | $14.00 | Heaviest put open interest at this expiration (1,538 contracts) |
| 52-week low | $12.53 | Price sits 25.8% above it, and 72.9% below the 52-week high |
Worth flagging plainly: the September 25 expiration's own walls ($24.00 call, $14.00 put) sit much wider than the whole chain's aggregate walls ($20.00 call, $15.00 put). That is because next Friday's open interest is thin and scattered, while the $15 and $20 strikes carry months of accumulated positioning. For this week's practical map, the $15.00 and $16.00 strikes do more work than either of the week's own walls.
Positioning and unusual flow
One rough estimate of dealer positioning puts the September 25 expiration in a positive-gamma regime, meaning market-maker hedging in those contracts would tend to dampen moves rather than amplify them. The same estimate places the gamma flip level at $24.00 — far above spot, so this measure offers no nearby pivot to trade around this week. Treat both as estimates built on an assumed dealer sign convention, not observed inventory. Note also that the October 16 expiration's own estimate flips negative, so the dampening read applies to next Friday specifically, not to the chain as a whole.
Three pieces of flow stood out among still-tradeable contracts. The October 23 $20 calls traded 4,092 contracts against just 89 of open interest — about $127,000 of premium chasing a strike 27% above spot. The November 20 $14 puts traded 2,634 contracts for roughly $277,000 in premium, the single largest protective print of the day. And the October 16 $9 puts traded 2,002 contracts against 23 of open interest — a deep-out-of-the-money tail hedge, cheap in dollars but a reminder that somebody is paying for disaster insurance even while the front of the curve leans call-heavy.
3 · Technical check
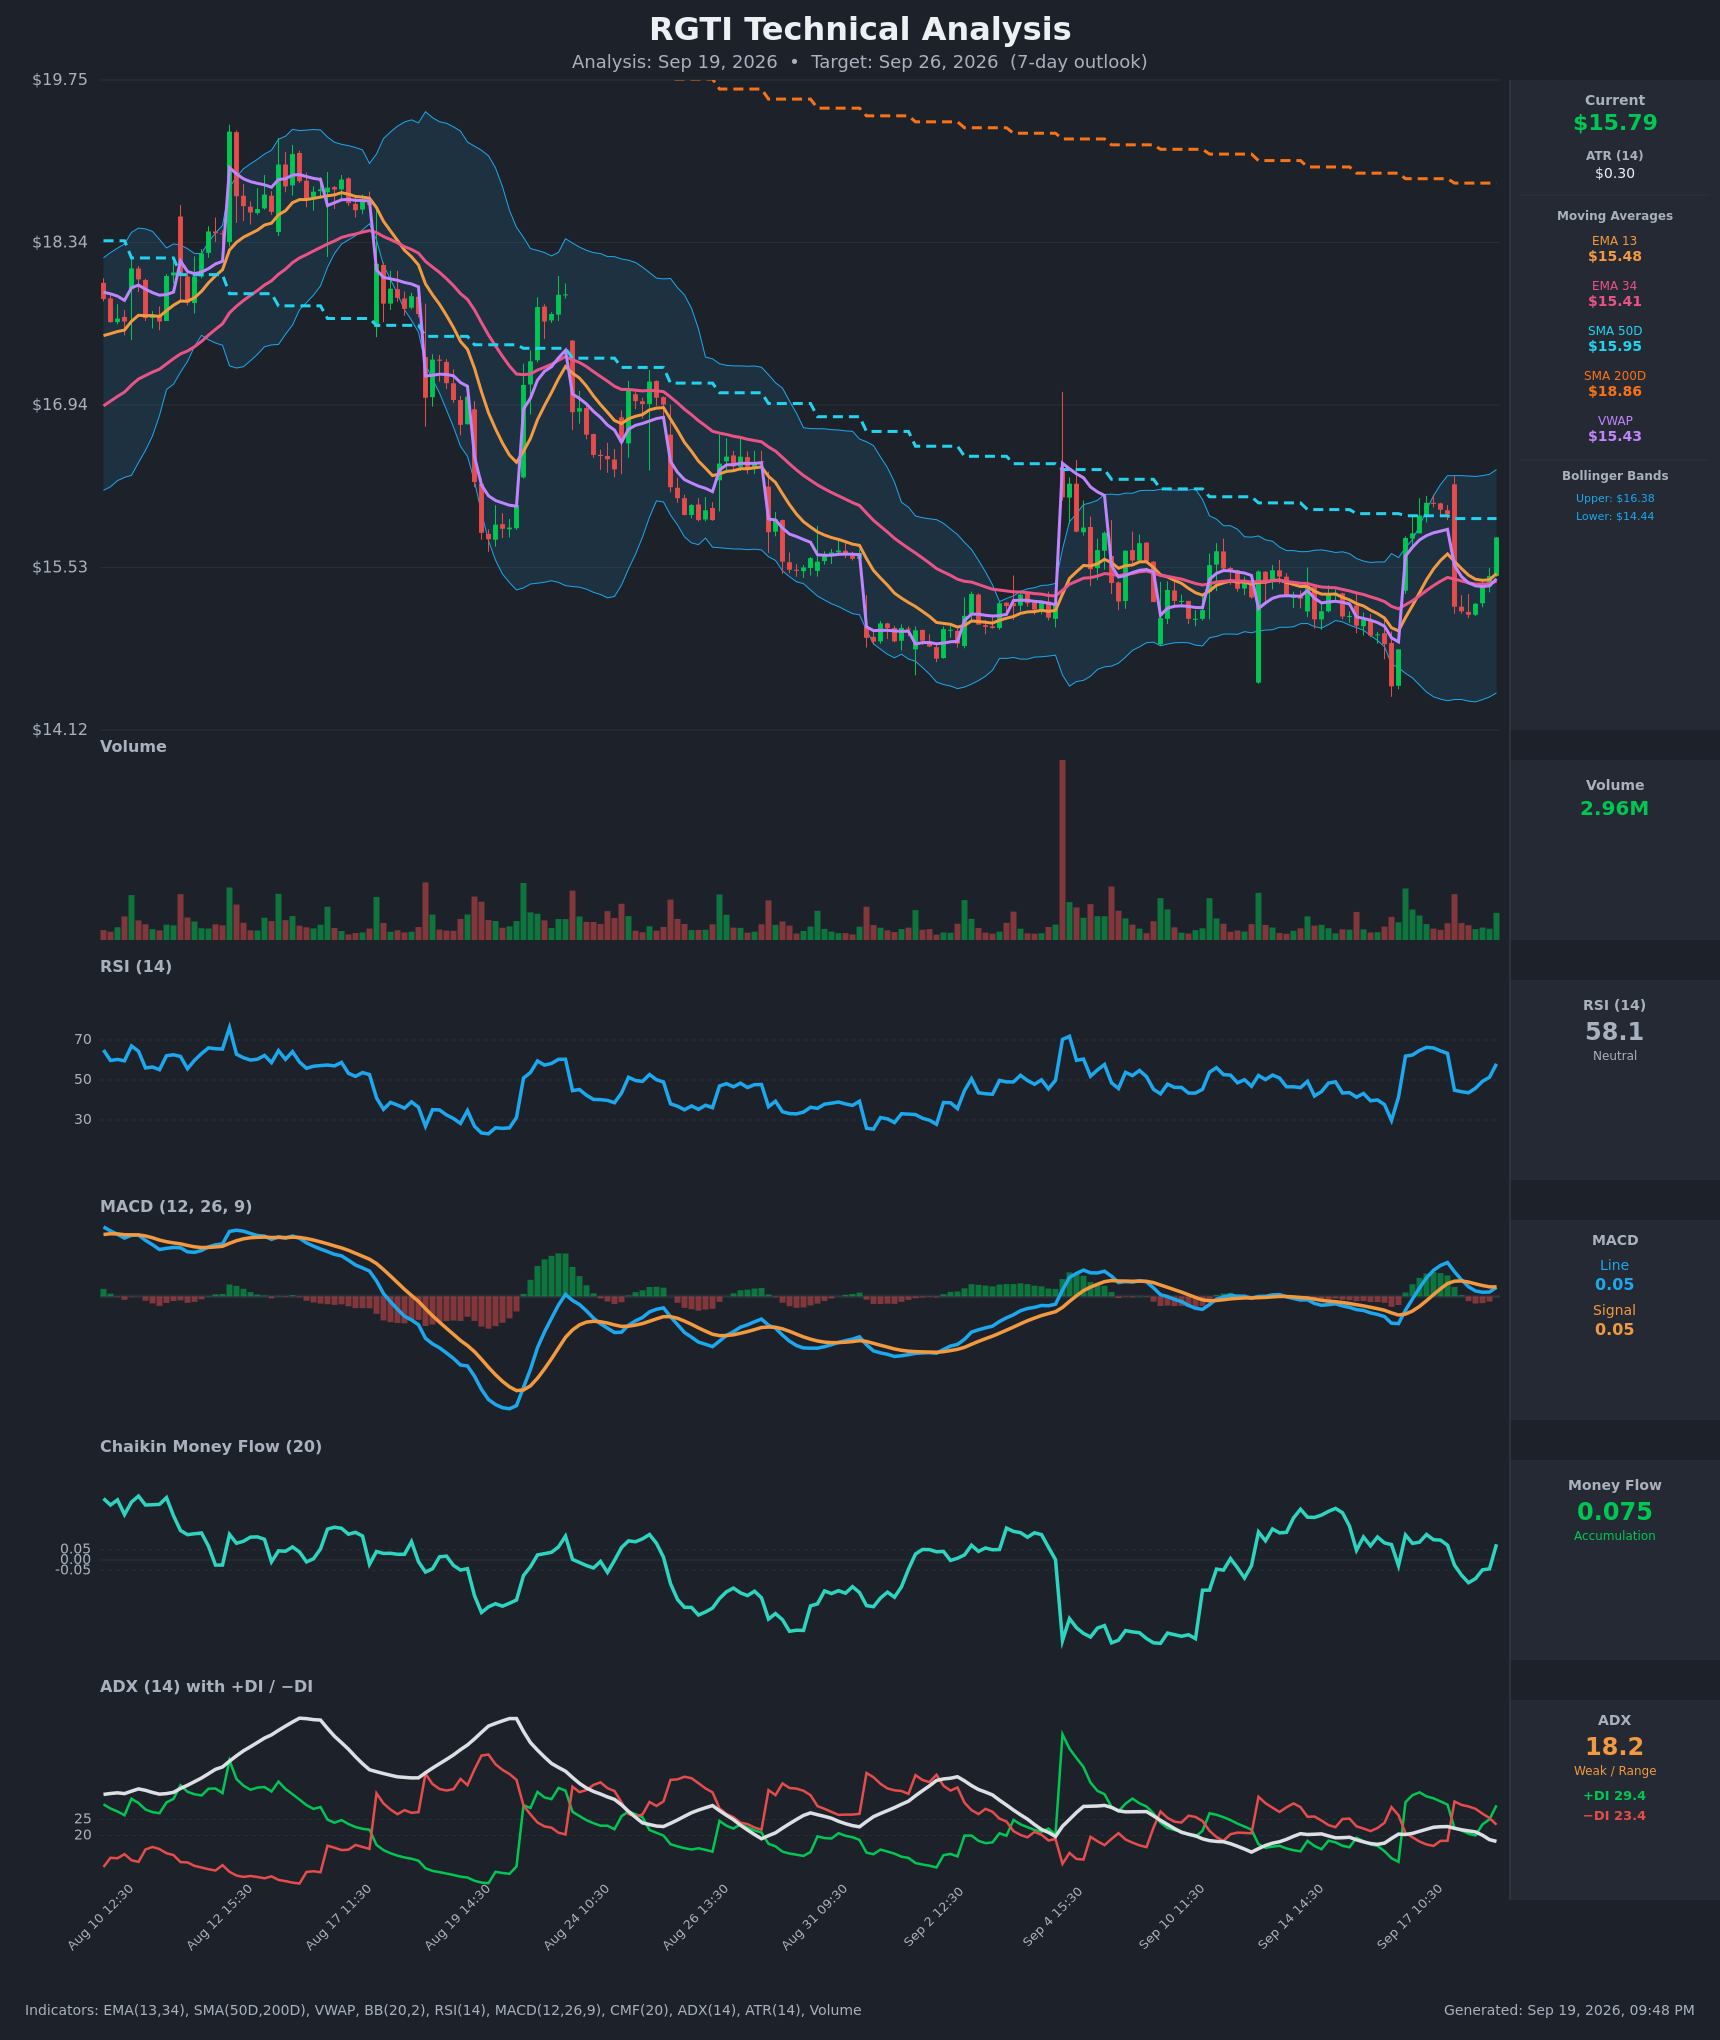
Both technical reports read bullish and both target $16.05. The 3-day report (through September 22) projects a $15.20–$16.35 band; the 6-day report (through September 25, matching our expiration) projects $15.10–$16.40. The most decisive indicator reads are a money-flow measure that swung from −0.11 to +0.075 in three sessions — buyers stepping back in on the bounce — and a directional-movement crossover that just turned positive, though with trend strength still weak at an ADX of 18.2. Both reports name the same cap: the 50-day average at $15.95.
Classification: Confirms. The direction matches our slightly bullish options read, and the $16.05 target sits comfortably inside the options-implied $14.32–$17.20 band. What diverges is magnitude, not direction — the chart model expects a far narrower path than option prices are paying for.
Model vs. Market: The options market implies $14.32–$17.20 into September 25; the 6-day technical model targets $16.05 inside a $15.10–$16.40 band. Option prices are paying for roughly twice the range the chart model expects — which is why the structures below use tight, defined-width spreads rather than anything that needs the full implied move to pay.
The TA sharpened strike selection in one way: the $17 short strike on the bullish spread sits just above the chart model's $16.40 upper bound, so the trade collects its full value in the scenario both reads consider most likely rather than needing an outlier.
Full technical write-ups: 3-day report → · 6-day report →
4 · Three ways the next six days can go
If RGTI pushes above $16.00: max pain for next Friday sits right there, and the $16.00 strike carries the single largest gamma pile in the chain. Positioning of that shape tends to slow price down rather than launch it, so the more likely behavior above $16.00 is grinding through $16.12 toward the 50-day average at $15.95 being reclaimed as support — with the next real overhead pile of call open interest not arriving until $20.00.
If RGTI drifts between $15.00 and $16.00: this is the pin case, and it is the one the estimated dealer-gamma regime for this expiration quietly favors. With max pain at $16.00 sitting 24 cents above Friday's close and the heaviest put positioning parked at $15.00, expiring open interest and hedging flows tend to pull price into that narrow band rather than out of it. It is also the scenario in which the options market's $1.44 implied move ends up looking expensive.
If RGTI breaks below $15.41: that level is the technical shelf both chart reports name, and just beneath it sits the chain's heaviest put strike at $15.00 with 31,314 contracts. A close through $15.41 turns the past week's bounce back into a lower high inside a two-month downtrend, and the $14.60 and $14.32 levels come into play quickly. One rough estimate places spot unusually far below its gamma flip level for this name, so the cushioning effect described above should not be leaned on if price breaks lower.
5 · Three defined-risk structures
Prices are end-of-day midpoints as of September 18, 2026. All structures are hypothetical. Verify live prices before trading — these will be stale by the open.
Because option premium is running slightly below delivered movement, the debit structures lead this week and the credit structure carries a health warning.
If you lean bullish: Sep 25 $16/$17 call debit spread
- Trade: Buy the September 25 $16 call, sell the September 25 $17 call
- Debit: $0.27 · Max profit: $73 per spread · Max loss: $27 per spread · Break-even: $16.27
- Why it fits: You pay $0.27 to collect up to $1.00 if RGTI finishes above $17.00. Max pain sits at $16.00 and both chart models target $16.05, so the spread starts almost exactly where the base case ends — and with an IV rank of 3/100 and premium priced below delivered movement, buying a spread is the structurally cheaper side of this market. A debit spread means you pay up front, you can never lose more than that, and you're betting the stock finishes higher.
- Makes sense only if: you believe the bounce off $15.12 extends through the 50-day average at $15.95 rather than stalling under it.
- Invalidated if: RGTI closes below $15.41.
- Managing it: take profit at roughly 60–70% of the spread's max value rather than holding for the last nickel; with the short-term bounce fighting a two-month downtrend, close by September 23 if RGTI is still under $15.95.
- Liquidity note: the $16 calls quoted 3 cents wide on a $0.465 mid and the $17 calls 1 cent wide on $0.195 — both among the tightest markets in the expiration, and fills should be easy.
- Analyze this position →
If you lean bearish: Sep 25 $15.50/$14.50 put debit spread
- Trade: Buy the September 25 $15.50 put, sell the September 25 $14.50 put
- Debit: $0.315 · Max profit: $68.50 per spread · Max loss: $31.50 per spread · Break-even: $15.185
- Why it fits: this is the trade for readers who weight the 50-day picture over the five-day one — RGTI is down 7.24% over roughly two months and sits 16.4% below its 200-day average. The long strike sits just above the $15.41 technical shelf, so the position starts paying exactly where our thesis breaks, and the short $14.50 strike sits above the week's put wall at $14.00.
- Makes sense only if: the bounce fails at the 50-day average and the broader downtrend reasserts itself.
- Invalidated if: RGTI closes above $15.95.
- Managing it: this fights both the flow read and both chart models, so size it small and treat it as a hedge; exit on any close back above $15.95.
- Liquidity note: the $15.50 puts quoted 8 cents wide on a $0.44 mid and the $14.50 puts 5 cents wide on $0.125 — workable, but use limit orders and expect to leak a couple of cents.
- Analyze this position →
If you expect the range to hold: Sep 25 $13.50/$14.50/$17.00/$18.00 iron condor
- Trade: Sell the September 25 $14.50 put and buy the $13.50 put; sell the September 25 $17 call and buy the $18 call
- Credit: $0.225 · Max profit: $22.50 per condor · Max loss: $77.50 per condor · Break-evens: $14.275 and $17.225
- Why it fits: the short strikes sit just inside the week's $14.32–$17.20 implied range, and the pin case around $16.00 max pain is the single most probable path. A credit spread means you collect premium up front and keep it if price stays between the short strikes.
- Health warning: you're selling premium that hasn't been rich lately — implied volatility is running about 5.7 vol points below what RGTI has actually delivered over the past month, and IV rank is 3/100. Risking $77.50 to make $22.50 on a stock with 73.5% realized volatility is a demanding trade.
- Makes sense only if: you specifically expect realized movement to keep decelerating into expiration.
- Invalidated if: RGTI closes outside $15.41 or $16.12 with momentum — either break threatens a short strike faster than six days of decay can pay for it.
- Managing it: close at roughly 50% of max credit; exit regardless by September 23 rather than carrying gamma risk into the final sessions.
- Liquidity note: the $14.50 puts quoted 5 cents wide on a $0.125 mid and the $18 calls 8 cents wide on $0.07 — that is wide relative to the credit collected, and slippage alone can eat a fifth of the trade. Work the order as a package.
- Analyze this position →
If none of these: no trade
There is a clean case for sitting this one out. Premium is thin rather than rich, so the income trade pays badly for the risk it takes — and it is the structure with the widest quoted markets of the three. Meanwhile the debit spreads need direction to arrive within six calendar days, and a stock that has delivered 73.5% realized volatility can make and unmake that direction twice in a week. The flow lean is real but modest, the front-week sentiment bucket is flat at +3, and the 50-day average at $15.95 caps the most likely upside path within a dollar of Friday's close. Waiting for either a decisive close above $15.95 or a break below $15.41 — and trading the resolution — costs nothing but patience.
6 · Quick FAQ
What is RGTI's expected move this week? About ±$1.44 (±9.16%) into the September 25 expiration, producing a $14.32–$17.20 range, per the options market's straddle pricing as of the September 18 close.
Is RGTI expected to go up or down over the next six days? Options positioning as of September 18 leans slightly bullish — calls are priced richer than puts by more than this name's own norm, call open interest is building at $17 and $18 for next Friday, and max pain sits just above spot at $16.00 — but that is a read of what traders have done, not a forecast. The actionable map is the $14.32–$17.20 range and the $15.00/$16.00 levels in between.
Are RGTI options expensive right now? No, on both lenses. IV rank of 3/100 says option prices are lower than roughly 97% of the past year's readings, and on top of that they're running about 5.7 vol points below the movement RGTI has actually delivered — a gap sitting right at the middle of this stock's own recent readings. The verdict favors buying defined-risk premium over selling it.
Where is RGTI's biggest options support and resistance? For the September 25 expiration, the put wall is $14.00 and the call wall is $24.00 — but next Friday's open interest is thin, so the whole chain's heaviest strikes matter more: $15.00 on the put side (31,314 contracts) and $20.00 on the call side (27,923).
What invalidates this week's read? A close below $15.41.
Methodology & disclosures. Data: end-of-day options-chain snapshot for RGTI, 2026-09-18, generated 2026-09-19T21:48:11.319Z. Prices shown are midpoints and will differ from live markets. Momentum/positioning scores and volatility-premium comparisons are descriptive measurements of past option flow and past price movement — not investment advice, signals, forecasts, or guarantees. All trade structures are hypothetical. Every structure shown has a defined maximum loss; you can lose the entire max-loss amount. Options involve substantial risk and are not suitable for all investors.