TQQQ Options Are Pricing a $4.01 Move Into September 25 — The Chart Model Sees $74.30
The options market implies a $68.63–$76.65 range for TQQQ into the September 25 expiration, with the heaviest call open interest parked at $75 and max pain at $71. Here's what the positioning says, where the chart model disagrees, and three defined-risk ways to trade the corridor.
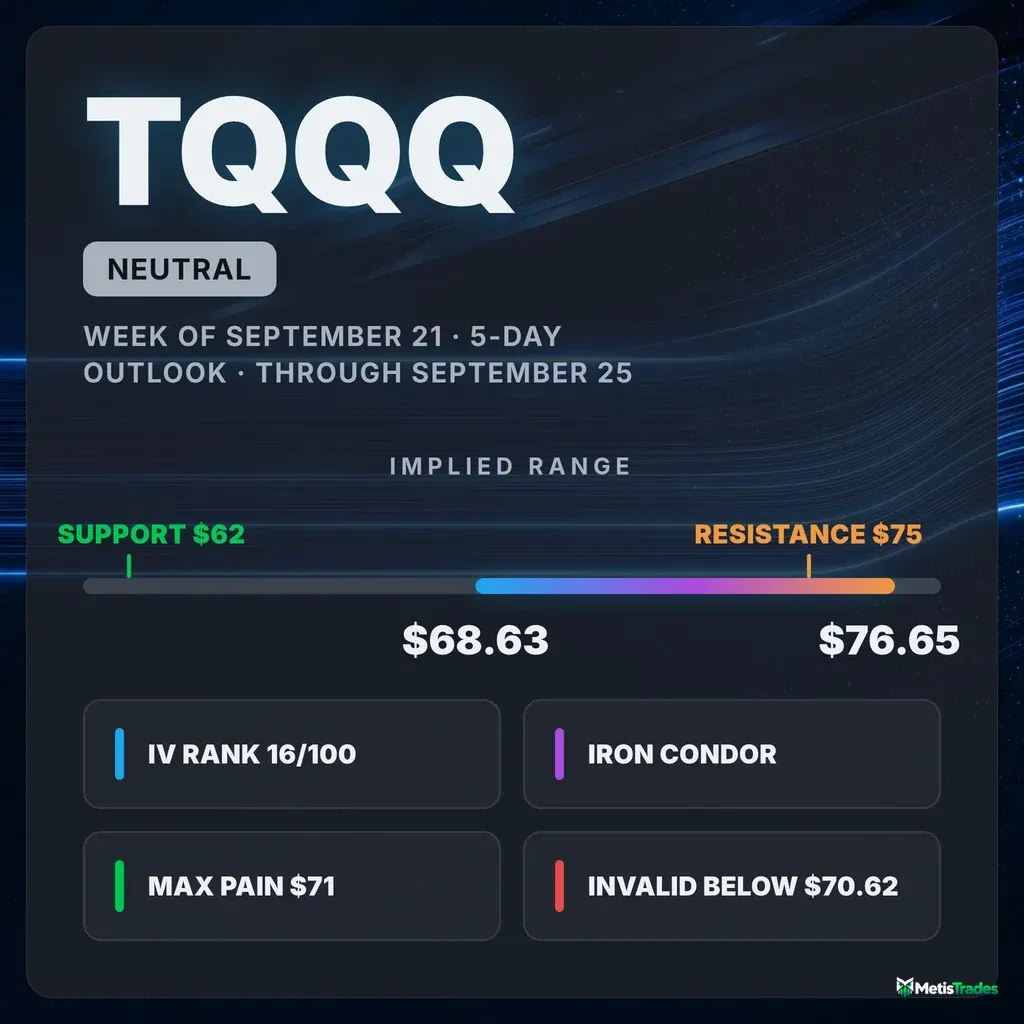
The options market implies a $68.63–$76.65 range into the September 25 expiration; here's what's driving it and three defined-risk ways to trade it.
Published Sunday, September 20, 2026 · Data as of Friday, September 18 close
Explore the live TQQQ options data in the Detailed Options Analyzer →
Quick answer
| Item | Answer |
|---|---|
| Market bias | Neutral |
| Spot (Sept 18 close) | $72.64 |
| Options-implied range (into Sept 25) | $68.63 – $76.65 (±5.52%, or about ±$4.01) |
| Major support | $62.00 — put wall for the Sept 25 expiration (nearer structural shelf: $70.62) |
| Major resistance | $75.00 — call wall for the Sept 25 expiration |
| Max pain (Sept 25) | $71.00 |
| Dealer gamma regime (estimate) | Positive — hedging tends to dampen moves; flip level ≈ $55 |
| Volatility condition | Falling — IV rank 15.7/100 · premium modestly rich: options priced about 9.3 vol points above delivered movement |
| Technical check | Mixed (bullish, 3-day and 5-day chart models) |
| Best-fitting strategy | Iron condor (Sept 25 $67/$69/$75/$77), if the corridor holds |
| Analysis invalidated if | TQQQ closes below $70.62 |
1 · What matters today
TQQQ closed Friday, September 18 at $72.64 after a 2.3% five-session bounce, and the options market is pricing roughly a $4.01 move in either direction through the September 25 expiration — a $68.63 to $76.65 corridor. That's the move implied by what straddles cost at that expiration, not a forecast. Our read of the flow lands squarely neutral: leading positioning signals have turned mildly constructive, short-dated sentiment is barely off zero, but the stock sits pinned just under the heaviest call open interest on the board at $75. Max pain — the price where the most option value would expire worthless — sits at $71, right on top of the 20- and 50-day moving averages. Two chart models lean bullish toward $73.80–$74.30. The level that changes everything is $70.62: a close below it and the corridor thesis is dead.
2 · What the options market is pricing
What changed this week
The past five sessions were violent in both directions and ended up net positive: TQQQ gapped down 4.86% on September 14, gapped back up 4.71% on September 17, and finished the stretch +2.34%. Volatility drained out of the chain the whole way. At-the-money implied volatility — the market's estimate of how much TQQQ will move, baked into option prices — finished at 48.6%, down 3.6% on the day, 5.3% over five sessions and 20.1% over the past month. IV rank fell to 15.7 against a 7-day average of 26.9 and a 14-day average of 24.4, so today's reading is well below even its own recent-week baseline.
Positioning moved with it. Put/call open interest — the ratio of put contracts held open to call contracts held open — sits at 0.69, meaning there are roughly 0.69 puts open for every call; the 14-day average is 0.94. Friday alone added 34,318 calls of open interest while shedding 61,869 puts. Put/call volume came in at 0.81 against a 7-day average of 0.90 — modestly call-tilted versus its own norm. Among still-live contracts, the biggest open-interest builds were the October 2 $60 puts (+4,900, to 21,072 open), the September 23 $73 calls (+3,850) and the September 25 $76 calls (+2,525). Into Friday's settled expiration, the $71 puts added 11,606 contracts of open interest — that one is history now, not a live magnet.
One thing to hold in mind: the short- and long-term trend reads are flat across every horizon the model can measure, and the price paths behind them disagree. TQQQ is +2.3% over the past week and +3.1% over the past month, but still −4.8% over the past ten weeks. The recent bounce is a bounce inside a wider chop, not a resumption of anything.
Expected move
Into the September 25 expiration, the options market is pricing about ±$4.01, or ±5.52% of the $72.64 spot — a $68.63 to $76.65 band. Here is how that scales out across the next several tradeable expirations (the September 21, 23, 28 and 30 rungs are skipped: quote quality on those was too poor to price an at-the-money reading).
| Expiration | Implied move | Range around $72.64 |
|---|---|---|
| September 25 (7 DTE) | ±5.52% | $68.63 – $76.65 |
| October 2 (14 DTE) | ±8.76% | $66.28 – $79.00 |
| October 9 (21 DTE) | ±10.49% | $65.02 – $80.26 |
| October 16 (28 DTE) | ±13.22% | $63.04 – $82.24 |
The ladder climbs smoothly with time — no single rung steps up out of proportion to the others, which is what you'd expect from an index-tracking product with no scheduled company event in the window.
Volatility
At-the-money IV is 48.6% and IV rank is 15.7/100 — where today's IV sits versus the past year, so 15.7 means cheaper than about 84% of the past year's readings. The percentile read is even more lopsided: only about 3% of the past year's sessions closed with lower at-the-money IV. Today sits 10.9% below the 30-day average of 54.5% and far below the 90-day average of 65.1%. The front-month read is unavailable today (expiry day), so there's no clean comparison of option prices across different expiration dates — the 60-day at-the-money reading of 53.9% is the usable anchor, and it says longer-dated options still carry more vol than the front. For context, VIX itself is sitting at a 7.6/100 52-week rank and has correlated about 0.76 with TQQQ's at-the-money IV over the past 60 observations, so this is broad index calm, not something idiosyncratic.
Two readings versus this stock's own recent history — meaning unusual for TQQQ, not versus the broader market — are worth naming. Twenty-day realized volatility is 39.3%, which is unusually subdued for this name. But the 5-day-versus-20-day realized-vol ratio is 1.22 and running well above its own norm: actual movement has been accelerating over the past week even as the monthly average stays quiet. Those gap days did real work.
Premium rich or cheap. The volatility risk premium — the gap between how much movement options are priced for and how much TQQQ has actually delivered — is about 9.3 vol points positive, meaning option sellers have been collecting more than realized movement cost them. That sits at the 64th percentile versus this stock's own recent readings, so richer than about two-thirds of them. The path matters: that gap was 20.4 vol points on September 16, 10.7 on September 17 and 9.3 on Friday, roughly halved in two sessions as implied volatility collapsed faster than realized movement faded. Put the two lenses together — IV rank 15.7 and a 64th-percentile premium over delivered movement — and you get a genuinely middling verdict. Options are cheap against their own year, but they still price about nine vol points more movement than the stock has been producing. That's a modest edge for premium sellers working defined-risk structures, and no edge at all for anyone hoping to get paid richly for taking gap risk.
Skew and sentiment
Today's direct read on skew — where puts and calls the same distance from the stock price don't cost the same, and pricier puts mean traders are paying up for crash protection — isn't available: the 25-delta call side didn't produce a readable quote, so the usual put-minus-call comparison is blank for Friday. What we can say is that the 25-delta put was marked at 59.3% implied vol, and across the past two weeks the put-over-call gap has averaged about 16.6 vol points against a 60-day median of 16.0. Downside protection is being bid at roughly its normal price for this name — no panic, no complacency.
Flow tells a slightly friendlier story. Put/call volume at 0.81 is below its 7-day average of 0.90. Short-dated sentiment in options expiring within a week scores a mild +9, and the 7–30 day bucket +7 — both barely off neutral. The longer buckets are where the conviction sits: +51 in the 30–60 day window and +42 beyond 60 days, which is why our read of the term structure labels the regime a "bullish recovery" with positioning building further out rather than in the front. Friday's net new open interest leaned call-side far more heavily than is typical for this stock — a genuinely unusual reading versus its own recent history — while peer-relative sweep activity was a near dead heat at 10 call contracts to 11 put contracts clearing the unusual bar.
The key levels map
| Level | Price | Why it matters |
|---|---|---|
| Swing resistance | $76.83 | Next structural shelf above the implied range |
| Upper implied rail (Sept 25) | $76.65 | Top of the options-implied corridor |
| Call wall (Sept 25) | $75.00 | Heaviest call open interest for the week, 33,921 contracts — also the whole chain's heaviest call strike and its largest gamma cluster |
| Swing resistance | $73.71 | Nearest price-structure ceiling |
| 100-day moving average | $73.27 | Price sits 0.86% below it — the one major average still overhead |
| Second-largest gamma strike | $73.00 | Heavy combined open interest just above spot |
| Spot (Sept 18 close) | $72.64 | Reference price for everything above and below |
| Max pain (Sept 25) | $71.00 | Where the most option value would expire worthless; expirations sometimes gravitate toward it |
| Swing support | $70.84 | Top of the support shelf |
| 20-day moving average | $70.71 | Price 2.73% above |
| 50-day moving average | $70.62 | Price 2.87% above — this article's invalidation level |
| Gamma cluster / heavy OI | $70.00 | 60,728 contracts of combined open interest across the chain |
| Lower implied rail (Sept 25) | $68.63 | Bottom of the options-implied corridor |
| Swing supports | $68.09 / $66.79 | Heuristic swing-pivot clusters beneath the shelf |
| Put wall (Sept 25) | $62.00 | Heaviest put open interest for the week, 8,831 contracts |
| Whole-chain put wall | $60.00 | The all-expirations heaviest put strike (37,231 contracts) — note it sits $2 below the week's own put wall |
| Gamma flip estimate | ≈ $55 | One rough estimate of where market-maker hedging would flip from cushioning to amplifying; spot is far above it |
Positioning and unusual flow
Market makers hedge the options they've sold, and in this regime that hedging tends to dampen moves rather than amplify them — one rough estimate puts both the whole chain and the September 25 expiration specifically in positive-gamma territory, with the flip level down around $55. Spot sits about 24% above that estimate, an unusually wide cushion even for this name. Treat all of that as an estimate built on an assumed dealer sign convention, not observed inventory.
Three live flow items stood out on Friday. The October 2 $78 calls traded 7,184 contracts against 1,105 open — roughly $406,000 of premium and a 100th-percentile print versus comparable contracts; that's a cheap two-week upside bet, not an institutional core position. The October 16 $62 puts traded 4,702 contracts for about $527,000 of premium, the largest single put-side premium print on the board and a straightforward month-out downside hedge. And the September 21 $76 calls turned over 4,656 contracts against just 79 open — a 59x turnover on a contract with three days of life and a 0.03 delta, which is lottery-ticket behaviour rather than positioning. Inside the target week itself, the September 25 $74 calls traded 8,564 contracts and added 1,934 of open interest, and the $75 call wall grew another 1,079 to 33,921.
3 · Technical check
Both chart models lean bullish, and both land inside the options-implied corridor. The 3-day read targets $73.80 by September 23 with a projected range of $70.85 to $74.75. The 5-day read, which lands exactly on our target expiration, targets $74.30 with a projected range of $70.40 to $75.90. The most decisive supporting reads: ADX at 21.6 and rising with +DI (37.2) decisively above −DI (18.6), so trend strength is building rather than confirmed, and Chaikin Money Flow at 0.056 just inside accumulation territory. Both reports flag the same invalidation for their dominant scenario — a close back below the 13-period EMA at $71.30.
Classification: mixed. Direction diverges from the flat options read, but magnitude confirms it — $74.30 sits comfortably inside $68.63–$76.65, and the chart's own upper projection of $75.90 stops just above the call wall. That combination is the single most useful thing in this article: the chart says up, the options chain says the way up runs straight into 33,921 contracts of call open interest at $75. It shaded one decision below — the short call strike of the range structure sits at the wall rather than inside it, and the bullish structure is built on the put side rather than by buying calls into that ceiling.
Model vs. Market: The options market implies $68.63–$76.65 into September 25; the 5-day technical model targets $74.30. Both can be right — a $74.30 close is an unremarkable outcome inside that corridor. What would resolve the tension is a decisive close through $75: that would mean the chart's momentum read beat the chain's heaviest overhead positioning.
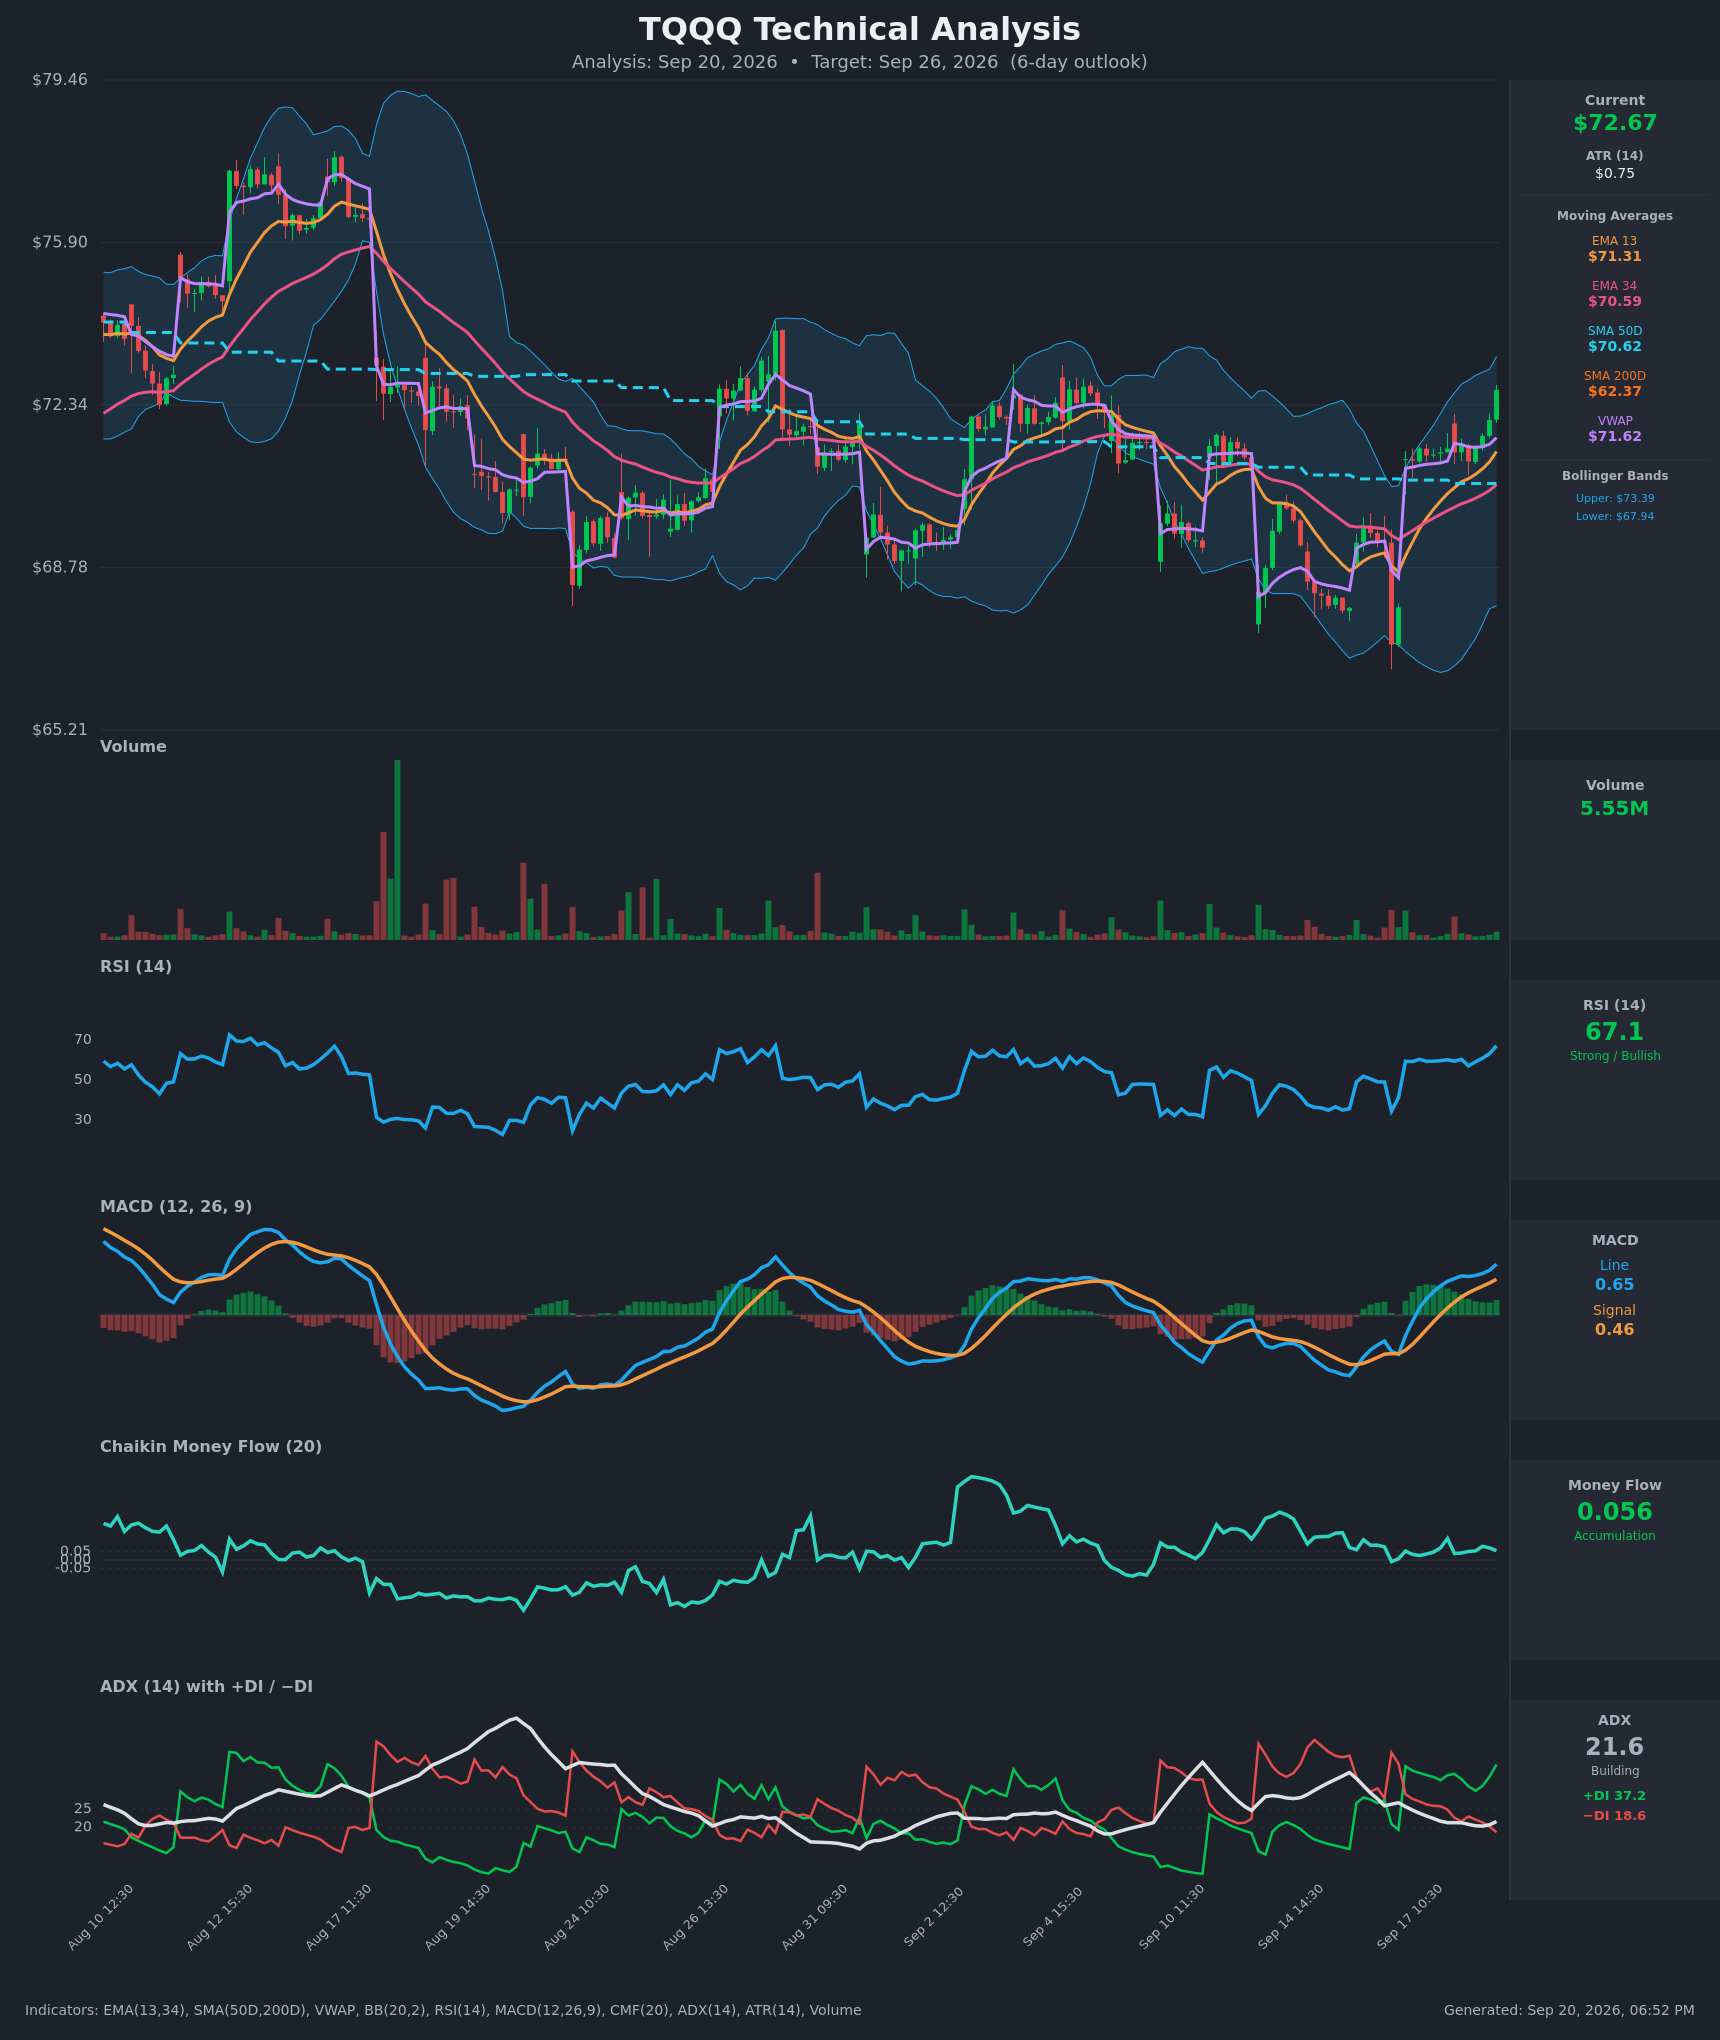
Full technical write-ups: 3-day report → · 5-day report →
4 · Three ways the next five days can go
If TQQQ pushes above the call wall ($75): that strike carries the heaviest call open interest of the week and the chain's single largest gamma cluster, and rallies into that kind of concentration tend to slow as hedging flows lean against them. A clean break leaves noticeably thinner positioning overhead — the next real markers are the $76.65 upper implied rail and the $76.83 swing shelf.
If TQQQ drifts between the walls: this is what positive-gamma hedging and a $71 max pain tend to produce. The $70.62–$71.00 band stacks the 50-day and 20-day moving averages, the nearest swing support and max pain all within 40 cents of each other, and $75 caps the other side. A $71–$75 grind into Friday, September 25 is the path of least resistance the positioning describes.
If TQQQ breaks below the shelf ($70.62): the put wall at $62 is a long way down, so it isn't a near-term barrier — the more relevant observation is that the next support markers thin out quickly at $69.57 and $68.09, with the lower implied rail at $68.63 in between. Spot sits unusually far above the $55 gamma flip estimate for this name, so the regime where market-maker hedging amplifies selling rather than cushioning it is not close; a break of the shelf would be a price-structure failure, not a hedging cascade.
5 · Three defined-risk structures
Prices are end-of-day midpoints as of 2026-09-18. All structures are hypothetical. Verify live prices before trading — these will be stale by the open.
If you expect the range to hold: September 25 iron condor
- Trade: Sell the Sept 25 $69/$67 put spread and the Sept 25 $75/$77 call spread (four legs, one order). You collect a credit up front and keep all of it if TQQQ finishes between $69 and $75.
- Credit: $0.665 · Max profit: $66.50 · Max loss: $133.50 · Break-evens: $68.34 and $75.67
- Why it fits: the short strikes sit against real structure — $69 just under the moving-average shelf and max pain, $75 exactly on the week's call wall. The positive-gamma estimate argues for dampened moves, and the volatility risk premium at the 64th percentile means you're selling movement that has been priced a bit above what's actually delivered.
- Makes sense only if: you accept that the implied range ($68.63–$76.65) is wider than your short strikes, so this is a bet the market overprices its own corridor.
- Invalidated if: TQQQ closes below $70.62 or above $75.00.
- Managing it: close at roughly 50% of max credit; exit regardless at the September 24 close rather than carrying expiration-day gamma. The bullish chart model's upper projection of $75.90 is above your call-side break-even, so treat the call spread as the live risk and close the whole package if $75 goes rather than defending it.
- Liquidity note: the $69 puts quoted 5¢ wide on a $0.625 mark and the $75 calls 5¢ wide on a $0.545 mark. The $77 calls are 3¢ wide on a $0.155 mark — small in dollars but about 19% of mark, so work the condor as a single package order and expect some slippage on that wing.
- Analyze this position →
If you lean bullish: September 25 $71/$69 put credit spread
- Trade: Sell the Sept 25 $71 put, buy the Sept 25 $69 put. You collect a credit and keep it if TQQQ holds above $71.
- Credit: $0.435 · Max profit: $43.50 · Max loss: $156.50 · Break-even: $70.57
- Why it fits: the $71 short strike is max pain for the expiration, and the $70.84 swing support, $70.71 20-day average and $70.62 50-day average stack immediately beneath it. Both chart models place their support confluence at $71.30, just above the short strike. It also expresses upside without buying calls into the $75 wall.
- Makes sense only if: you believe the September 17 gap higher holds and the shelf under $71 does its job.
- Invalidated if: TQQQ closes below $70.62.
- Managing it: close at roughly 50% of max credit. Because the near-term trend read is fighting a market still down 4.8% over ten weeks, take profit early rather than holding for the last few cents; if TQQQ closes through $71, close the spread rather than hoping for a Friday recovery.
- Liquidity note: the $71 puts traded 4¢ wide on a $1.06 mark — under 4%, the tightest pair on this expiration's board — and the $69 puts 5¢ wide. Fills should be straightforward.
- Analyze this position →
If you lean bearish: September 25 $72/$69 put debit spread
- Trade: Buy the Sept 25 $72 put, sell the Sept 25 $69 put. You pay a debit up front and profit as TQQQ falls toward $69.
- Debit: $0.79 · Max profit: $221 · Max loss: $79 · Break-even: $71.21
- Why it fits: it targets the gravitational case directly — max pain at $71 with spot $1.64 above it, and options that are cheap against their own year (IV rank 15.7) so you aren't overpaying for the long leg. The put wall at $62 is far enough away that nothing structural stops a slide back to the moving-average shelf.
- Makes sense only if: you think Friday's bounce was the tail end of a gap sequence rather than the start of a trend — and you're willing to fight two bullish chart reads to say it.
- Invalidated if: TQQQ closes above $73.71, the nearest swing resistance.
- Managing it: this pays fastest on a quick move; take profit at roughly 60–70% of max value rather than waiting for a pin exactly at $69, and cut it by the September 24 close if TQQQ is still above $72.
- Liquidity note: the $72 puts were 9¢ wide on a $1.415 mark (about 6%) and the $69 puts 5¢ wide. Acceptable, but use a limit and don't chase.
- Analyze this position →
If none of these: no trade
There is a real case for standing aside. IV rank at 15.7 is the bottom sixth of the past year, and a 9.3-vol-point premium over delivered movement at the 64th percentile is respectable but not generous — you are selling modestly rich premium on a 3x leveraged product that has gapped more than 3% in four of the past nine sessions. Those gaps are precisely the thing a seven-day condor cannot defend against, and they're why the premium isn't richer: the market knows. If you don't have a view on whether $75 caps or breaks, the honest answer is that this is a coin-flip week with a small edge and a large tail, and skipping it costs you $66.50 of theoretical credit while saving you from a $133.50 loss you can't hedge out of overnight.
6 · Quick FAQ
What is TQQQ's expected move this week? About ±$4.01, or ±5.52%, into the September 25 expiration — a $68.63 to $76.65 range, derived from what straddles cost at that expiration as of the September 18 close.
Is TQQQ expected to go up or down over the next five days? Options positioning as of September 18 reads neutral — leading positioning signals have turned mildly constructive and new open interest leaned call-side, but short-dated sentiment is barely off zero and spot is pinned under the heaviest call strike. That's a read of what traders have done, not a forecast. The actionable map is the $68.63–$76.65 range with $62.00 (put wall) and $75.00 (call wall) as the structural bookends.
Are TQQQ options expensive right now? Two lenses. IV rank 15.7/100 says option prices are lower than about 84% of the past year's readings. On top of that, they're running about 9.3 vol points above the movement TQQQ has actually delivered — richer than roughly 64% of this stock's own recent readings. Net: cheap versus the year, modestly rich versus recent reality. A small edge for defined-risk premium sellers, nothing more.
Where is TQQQ's biggest options support and resistance? For the September 25 expiration: put wall at $62.00 (8,831 contracts) and call wall at $75.00 (33,921 contracts). Note the whole chain's heaviest put strike sits lower, at $60.00 — the week's own row and the all-expirations aggregate disagree by $2 on the put side, though both put the call wall at $75.
What invalidates this week's read? A close below $70.62 — the 50-day moving average, where the swing-support shelf and the 20-day average also sit.
Methodology & disclosures. Data: end-of-day options-chain snapshot for TQQQ, 2026-09-18, generated 2026-09-20T18:52:16.985Z. Prices shown are midpoints and will differ from live markets. Momentum/positioning scores and volatility-premium comparisons are descriptive measurements of past option flow and past price movement — not investment advice, signals, forecasts, or guarantees. All trade structures are hypothetical. Every structure shown has a defined maximum loss; you can lose the entire max-loss amount. Options involve substantial risk and are not suitable for all investors.