Did Your Rolls Pay Off? Measuring Roll Results Across the Whole Chain
A roll does not end a trade, it continues one. Learn to judge rolls by the lifetime result and premium flow of the whole chain instead of the last leg, by hand and then in MetisTrades.
What it is and why it matters
A roll is closing an option and opening a replacement on the same underlying, usually at a different strike, a different expiration, or both. You buy back the 45 put you sold, and in the same breath you sell the 43 put expiring a month later.
Most traders roll for a reason: the short strike is threatened, expiration is close, or you want to collect more premium on the same idea. The problem is what happens to the record afterwards. Your broker reports the close and the open as separate events. Your spreadsheet, if you keep one, probably has them as two rows. The trade you have actually been running for three months looks like three unrelated trades.
A roll chain is the ordered sequence those positions form: a first position, then one or more rolls, then a final exit. In a chain with three positions there are two rolls — the roll count is the number of transitions, not the number of positions.
Two numbers matter when you judge a chain.
Premium flow is the option cash: credits received minus debits paid across every leg in the sequence. Lifetime result is the whole chain's profit or loss from the first entry to the final exit, including the money you paid to buy back each leg along the way.
Why this matters is easiest to see with a loser. In the worked example below, a DEF short put was rolled three times and finally closed for a $420 debit. Judged as a single closed trade, that last leg shows a $180 loss. Judged as a chain, the whole sequence cost $230.20. The three chains together look like a $165 gain if you only read the final legs, and a $48.30 gain once you count everything. Rolling moved money between legs; it did not make the earlier buybacks disappear.
That gap is the point. Rolling is a legitimate adjustment, but it is also the easiest way to make a bad trade look like a series of small ones. Measuring the chain is how you find out whether rolling is helping you or just postponing the result.
How to track it by hand
One row per finished chain. You are not recording every leg here — that detail lives in your trade log — you are recording what the chain as a whole collected, paid and returned.
The columns
- Chain — a label you choose, such as "XYZ short puts".
- Rolls — the number of transitions after the original opening position.
- Opening credit — the net cash from the very first trade in the chain.
- Roll net — the sum of every roll's net credit (positive) or debit (negative). A roll's net is what you received for the new leg minus what you paid to close the old one.
- Exit cash — the final close. Negative if you paid to close, 0 if the last leg expired worthless.
- Fees — commissions and exchange fees across the whole chain, entered as a positive number and subtracted.
- Last leg P/L — the result of the final position only, the way a single closed trade shows it. This column exists so you can see what you would have concluded without the chain.
- Lifetime result — computed: opening credit + roll net + exit cash − fees.
- Days in chain — first entry date to final exit date.
- Lifetime per day — computed: lifetime result ÷ days in chain.
| Chain | Rolls | Opening credit | Roll net | Exit cash | Fees | Last leg P/L | Lifetime result | Days in chain | Lifetime per day |
|---|---|---|---|---|---|---|---|---|---|
| XYZ short puts | 2 | 180 | 80 | -35 | 3.9 | 205 | 221.1 | 67 | 3.3 |
| ABC covered calls | 1 | 120 | -60 | 0 | 2.6 | 140 | 57.4 | 49 | 1.171429 |
| DEF short put | 3 | 150 | 45 | -420 | 5.2 | -180 | -230.2 | 95 | -2.423158 |
Work through each row.
XYZ short puts. The first put brought in 180. Two rolls each took in more than they cost to close, adding 80 between them. You paid 35 to close the last leg, and fees across the chain came to 3.90. So 180 + 80 − 35 − 3.90 = 221.10 over 67 days, or 221.10 ÷ 67 = 3.30 a day. The last leg alone showed 205, so here the chain and the final trade tell a similar story — the earlier legs were small net credits.
ABC covered calls. The opening call collected 120. One defensive roll cost more to close than the new call brought in, so roll net is −60. The last leg expired, so exit cash is 0. 120 − 60 + 0 − 2.60 = 57.40 over 49 days, or 1.1714 a day. Read only the final leg and you would record 140. The chain made 57.40. The roll consumed well over half the result, and nothing in the last leg's record says so.
DEF short put. The first put collected 150, and three rolls netted another 45 — on paper the chain kept collecting credit. Then the stock kept moving and the final close cost 420. 150 + 45 − 420 − 5.20 = −230.20 over 95 days, or −2.4232 a day. The last leg shows a 180 loss. The chain lost 230.20, and it took 95 days of capital to do it.
Now the totals. Lifetime result across all three chains is 221.1 + 57.4 − 230.2 = 48.30. The last-leg view totals 205 + 140 − 180 = 165. Total roll net is 80 − 60 + 45 = 65, which is a useful sanity check on its own: your rolls collected 65 in net credit across three chains, while the chains together returned 48.30 after exits and fees. Rolling brought money in; it did not by itself produce the result.
The lifetime per day column is what makes chains comparable. ABC's 1.1714 a day and XYZ's 3.30 a day are both winners, but XYZ did nearly three times the work per day of exposure. A chain that keeps getting rolled accumulates days quickly, and days are capital you could not use elsewhere.
The spreadsheet below already contains these three rows and the formulas, so you can overwrite the figures with your own.
Download the template: Roll results spreadsheet (.xlsx). It opens in Excel, and in Google Sheets via File → Import. The worked example from this guide is already filled in, and the formulas carry down into the blank rows.
Add a row when a chain finishes. For a chain still open, leave exit cash blank and keep the opening credit and roll net updated so you can see the premium flow so far — just do not read the lifetime result as final until the last leg is closed.
Where manual tracking breaks down
The arithmetic is simple. Keeping the inputs correct is not.
Deciding what counts as a roll. A close and an open on the same day, same underlying, same option type, similar quantity, with a changed strike or expiration — that is a roll. But you have to recognise it in a statement that lists the two trades several rows apart, often among unrelated fills. Miss one and a chain silently becomes two trades, each of which looks fine.
Split fills. Brokers report one logical order as several fills. A close that filled in two pieces against one replacement open looks, on a statement, like three trades. Totalling them by hand is where the 45 in DEF's roll net quietly becomes 450 or 4.50.
Multi-leg rolls. Rolling a spread means four legs in one order. The roll's net credit is the sum of every closing and opening leg in that order. Transcribe three of the four and your roll net is wrong for the rest of the chain's life.
Scale-ups and branches. You roll one contract down and out but open two. Which cash belongs to the original chain and which is a new position? Hand records usually resolve this by whichever guess you made that evening, and never the same way twice.
Assignment ending a chain. A short put chain that ends in assignment has no closing debit. The option sequence stops and a stock position starts. If you record nothing, the chain looks unfinished forever.
Multiple accounts. The same symbol rolled in two accounts produces two chains that look identical in a symbol-sorted sheet. Combine them by accident and both rows are wrong.
Corrections. A fee adjustment or a restated fill posted a week later changes a chain you already closed out and stopped looking at.
None of these are hard problems individually. They are just relentless, and the cost of getting one wrong is a conclusion about whether rolling works for you that rests on bad data.
How MetisTrades does it
MetisTrades builds roll chains from your imported transactions and then reports them in one place. Roll-chain tracking sits on the Pro portfolio surfaces, so you need an active subscription or lifetime access to reach Open Positions, Closed Positions, the Analysis tab and the account settings where chains are managed.
Detection first
In Account Settings, the Roll Detection card in the Trading Accounts section contains Detect rolls automatically. It is on by default and applies across every one of your trading accounts. With it on, MetisTrades matches a closing trade with a compatible opening trade on the same date and underlying — buy-to-close with sell-to-open, sell-to-close with buy-to-open, call with call, put with put, closely matching quantities, and a changed strike or expiration. Shared brokerage order identifiers or fills within 60 seconds of each other are treated as strong combo-order evidence; otherwise the app falls back to the nearest-strike candidate. With the setting off, only chains you build yourself with the Roll Chain Builder are shown.
Analysis → Roll Analysis
The chain-level view lives at Top nav → Analysis → Roll Analysis. The summary cards across the top are the portfolio version of your spreadsheet's total row: Total Roll Chains (filtered chains, total rolls, average rolls per chain), Success Rate (profitable closed chains as a percentage of all closed chains), Total Net P/L (combined chain result and average per chain) and Avg Days Held (first entry to final exit, or to today for an open chain, plus open and closed counts).
Below them, the Premium Flow card compares Total Credits, Total Debits and Net Result across the filtered chains — the same question your opening credit, roll net and exit cash columns answer, totalled. The Roll Chains table lists each chain with Symbol, Strategy, Entry Date, Expiration, Days, Credits, Debits, Realized, Net P/L and Status, all sortable, with open chains first by default and the nearest expiration first within a status group. Each symbol shows its roll count; a manual chain carries an M marker and a manually reclassified strategy carries a Reclassified badge.
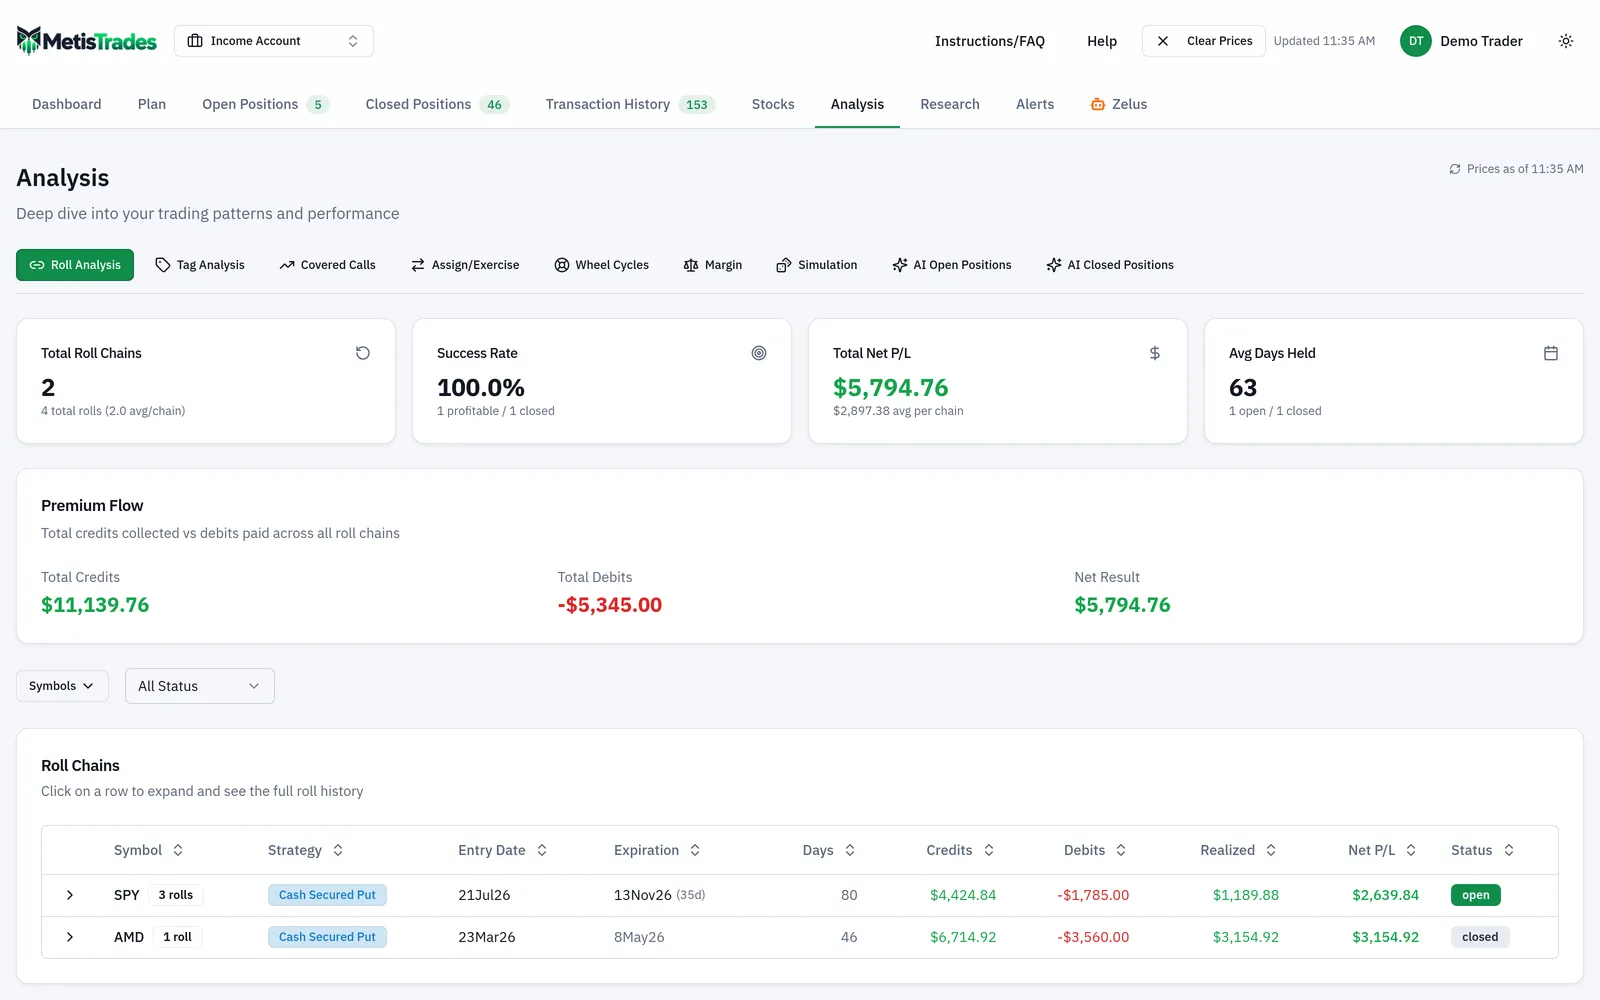
Use the symbol picker to limit the view to one or more underlyings and the status menu to pick All Status, Open or Closed; Clear Filters restores everything. The cards, Premium Flow and table all respond to the filters, so a closed-only view gives you the finished-chain figures that correspond to the rows in your spreadsheet. If nothing matches, the table says No roll chains match your filters. If no chains have been detected at all, the page shows No Roll Data Available.
Select the chevron on a chain to reveal its Roll History. Each segment is labelled OPEN or ROLL and shows Date, Expiration, Strike, Entry, its realized result and status. Closed segments also show Opened, Closed and Position Net — that last figure is the per-leg detail behind your roll net column. An open segment may show latest available price data, including Unrealized P/L, Position Greeks and option-leg details when those values are available. Selecting the chain row itself opens the position detail panel for the current or most recent segment.
In an all-accounts view, chains are grouped by account and then symbol, with account sections showing chain, roll, open, closed and subtotal figures that you can expand or collapse. That is the answer to the two-accounts-one-symbol problem.
The legs the chain absorbed
Closed Positions still holds every earlier link — the leg you bought back in February is a closed position with its own details. Looking at it alone is exactly the last-leg view your spreadsheet's "Last leg P/L" column was built to expose.
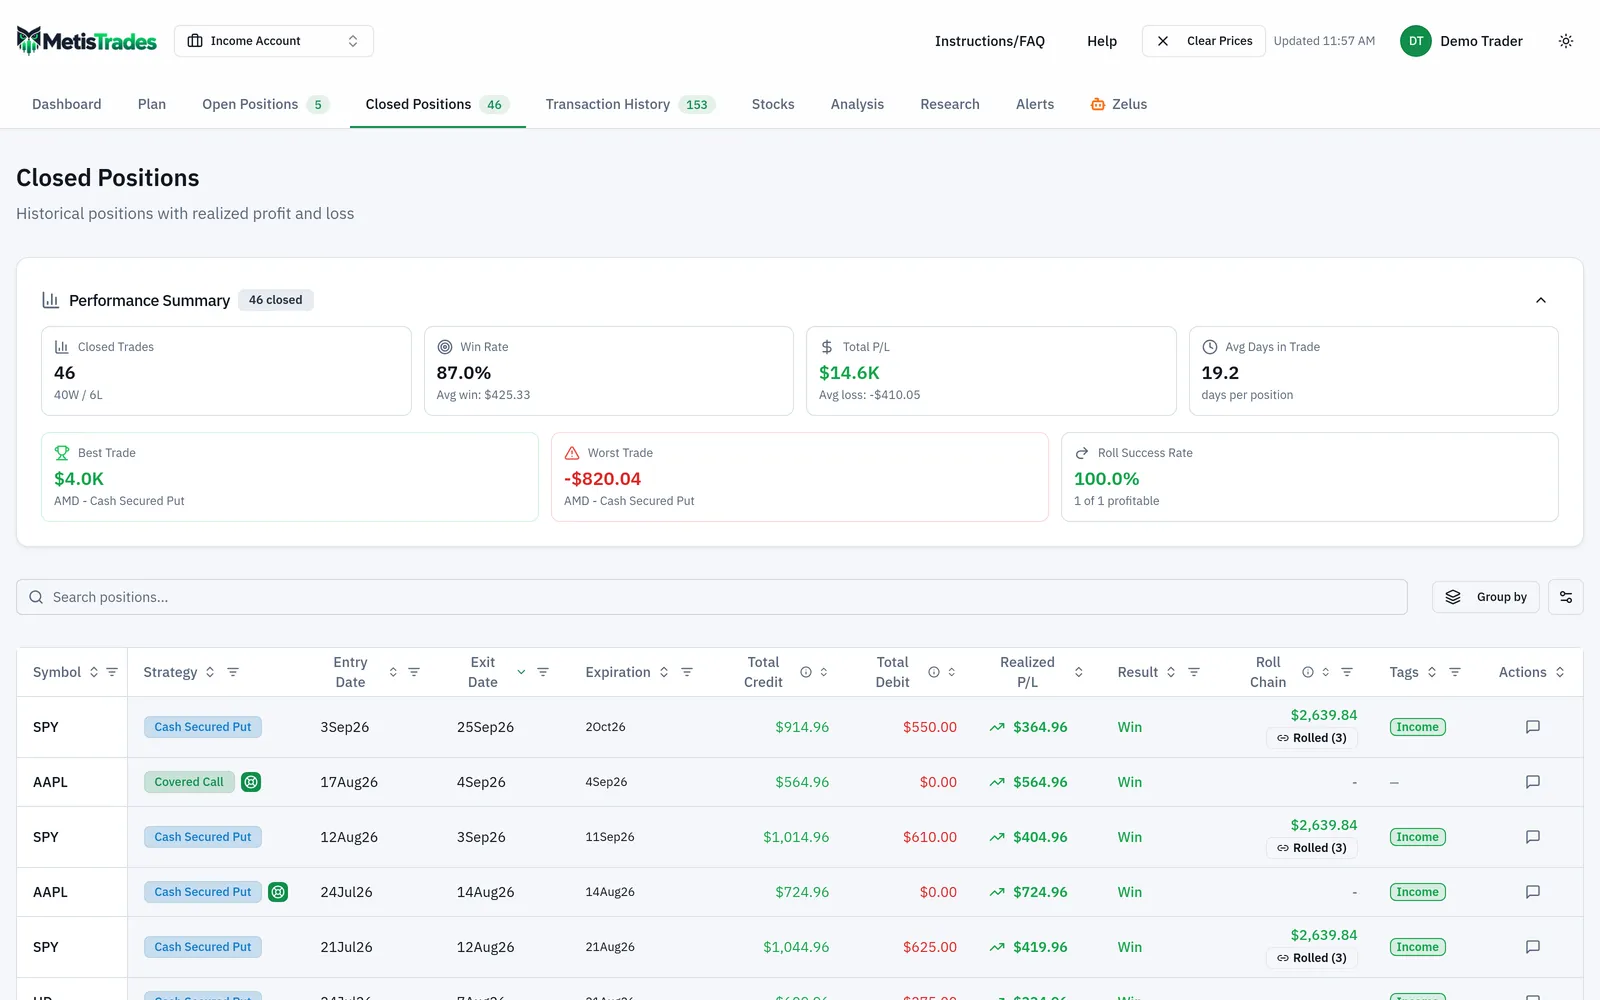
Position Details for any link includes Roll Chain History, whose collapsed heading shows the number of rolls, the number of positions and Chain Total P/L, and the Roll Chain Builder for corrections. In the builder, Suggested lists same-underlying positions with compatible strategy types and All Positions opens it up to any option position on that underlying. Select at least two positions and choose Save Chain; leave fewer than two selected and choose Disconnect Chain to separate links, which then stay independent until you use Reset to Auto. Manual membership is marked with the M badge. Manual grouping changes how MetisTrades presents and totals the chain; it does not alter your broker's transactions.
How to read the results
Credits and Debits are amounts received and paid across the chain. Read them together: a chain can show large credits and still lose, which is exactly what DEF's 150 opening credit and 45 of roll credit did against a 420 exit.
Realized isolates P/L from closed segments. For a closed chain, that is the chain's final net P/L. Net P/L is the chain-wide result; for an open chain with a latest available price it combines realized P/L from closed segments with an estimated P/L on the open segment, and the Premium Flow card marks a Net Result that includes an open-position estimate with a lightning icon.
Everything on the page — chain detection, dates, credits, debits and P/L — is an estimate derived from your imported transactions. Your spreadsheet's lifetime result is your own arithmetic with your own fee figures in it, so use the app's figures to check the shape and direction of a chain rather than expecting them to agree to the cent with a hand-kept row.
Success Rate counts profitable closed chains divided by all closed chains. Open chains do not enter the percentage, so a run of rolled-and-still-open losers will not show up there. Read it alongside Total Net P/L, the same way you would read any win rate: a high rate can coexist with a few large losses.
Avg Days Held averages days from each chain's first entry to its last exit, or to today while a chain is still open. That is the portfolio version of your days-in-chain column, and it is the number that tells you whether rolling is extending your holding periods. In the worked example, DEF's 95 days are more than XYZ's 67 and ABC's 49 — the chain that lost money was also the one that occupied capital longest.
What these figures do not mean: open-chain P/L depends on delayed quotes, and if no latest available price exists the page falls back to the transaction-derived chain result, so an open segment's estimate is not an executable closing price. Automatic roll matching is an inference from imported fills, not a statement of broker intent, and the chain model is linear, so a branching or scale-up trade cannot place every branch in the main chain. Missing opening, closing or replacement transactions can split or omit a chain. Chains you broke manually that have no rolls are excluded from the table. And none of these values are tax advice or a substitute for your broker's 1099-B.
Common mistakes
- Judging a roll by the new leg's credit. Collecting 45 across three rolls says nothing about the chain. Fix: record opening credit, roll net and exit cash on one row and read the lifetime result.
- Treating a bought-back leg as a finished losing trade and the replacement as a fresh idea. It resets your mental scorecard every few weeks. Fix: expand Roll History and read the chain from OPEN to the final segment before you conclude anything.
- Ignoring days. ABC's 57.40 over 49 days and XYZ's 221.10 over 67 days are not comparable as raw dollars. Fix: divide lifetime result by days in chain and compare 1.1714 against 3.30.
- Reading Success Rate as the whole picture. It only counts closed chains, so chains you keep rolling never enter it. Fix: check Total Net P/L and the open-chain count in Avg Days Held at the same time.
- Leaving a mis-detected chain alone. A fallback nearest-strike match can link a roll you did not intend, or a split fill can leave one leg stranded. Fix: open Position Details and use the Roll Chain Builder to save or disconnect the links, then Reset to Auto if you change your mind.
- Combining accounts when you meant to compare them. Fix: in the all-accounts view, chains are grouped by account — read the account subtotals rather than the blended table.
- Forgetting fees in the hand-kept row. The 3.90, 2.60 and 5.20 in the example are small individually and are also what separates 221.1 from 225. Fix: enter fees per chain, not per trade, and subtract them in the lifetime result formula.
Related guides and help pages
Related guides
- Understanding Roll Chains: Tracking a Rolled Option as One Trade
- Plan, Track, Optimize: a complete tour of MetisTrades
- Short put deep in the money with a week left: assign, roll, or close?
- One Rolled Position, Two Ledgers: Chain P/L vs Tax-Year P/L
- A 90% win rate and $100 to show for it: how rolls hide inside your stats
- Choosing automatic or manual roll detection