Measuring wheel cycle returns: premium, stock result and days held
A wheel cycle only makes sense when you measure the put premium, the call premium and the stock result together. Here is how to total a completed cycle by hand, and how the Wheel Cycles page in MetisTrades builds the same record from your transactions.
What it is and why it matters
The wheel is a sequence, not a single trade. You sell a cash-secured put — a short put backed by enough cash to buy the shares — and collect premium. If the put is assigned, meaning the buyer exercised and you are obliged to buy, you end up owning the shares at the strike. You then sell covered calls against those shares, collecting more premium, until a call is assigned and the shares are called away at the call strike, or until you simply sell the shares yourself.
Each of those steps produces its own profit or loss, and they point in different directions. The premium is almost always positive. The stock leg can be badly negative, because you were assigned at a strike above the price where the shares eventually left you. A trader who only counts premium will conclude every wheel works. A trader who only counts the stock result will conclude the whole thing was a mistake. Neither number means much alone.
A wheel cycle is the unit that makes the arithmetic honest: one assigned put, the shares it delivered, every covered call written against those shares, and the final disposition of the shares. Add the cash from all of it and you have the cycle result. That is the number that tells you whether the loop was worth running.
Two more pieces turn a dollar figure into something you can compare across symbols:
- Capital at risk — the assignment strike multiplied by the number of assigned shares. This is the money the cycle actually tied up. A $540 profit on $5,000 and a $540 profit on $50,000 are not the same trade.
- Days held — calendar days from assignment to the final disposition. A 10% return in 74 days and a 10% return in 400 days are not the same trade either.
Put those together and you get return on capital (cycle result ÷ capital at risk) and a simple annualised pace. Wheels are often sold as a routine, and routines deserve measurement: which symbols actually pay you for the capital and the waiting, and which ones mostly hand you a slow loss dressed up as premium income. Options carry real risk, including being assigned shares that keep falling, so measuring the completed loop rather than the premium alone matters.
How to track it by hand
One row per completed cycle. Record the facts you cannot compute — symbol, start and end dates, share count, assignment strike, exit price and total premium — and let formulas do the rest.
What goes in each column
- Symbol — the underlying.
- Started — the date the put was assigned and you took the shares. (If you rolled the put several times before assignment, keep the premium from every roll in the premium column; see the next section.)
- Ended — the date the last of those shares left you, whether called away or sold.
- Shares — the number of shares the put delivered.
- Assigned at — the put strike you bought the shares at.
- Sold at — the price the shares left at: the call strike if called away, your sale price if you sold them.
- Total premium — all option cash in the cycle, after fees and commissions. That means put premium, every covered-call credit, minus anything you paid to buy a call back.
The computed columns
Four formulas do all the work. Using spreadsheet columns A to L, with row {r}:
- Stock result =
=IF(A{r}="","",(N(F{r})-N(E{r}))*N(D{r}))— exit price minus assignment strike, times shares. - Cycle result =
=IF(A{r}="","",H{r}+N(G{r}))— stock result plus total premium. - Days =
=IF(A{r}="","",C{r}-B{r})— calendar days from start to end. - Return on capital =
=IF(A{r}="","",IF(N(E{r})*N(D{r})=0,"",I{r}/(N(E{r})*N(D{r}))))— cycle result divided by strike × shares. - Annualized (simple) =
=IF(A{r}="","",IF(N(J{r})=0,"",K{r}*365/J{r}))— the return on capital scaled to a 365-day pace.
The worked example
| Symbol | Started | Ended | Shares | Assigned at | Sold at | Total premium | Stock result | Cycle result | Days | Return on capital | Annualized (simple) |
|---|---|---|---|---|---|---|---|---|---|---|---|
| XYZ | 2026-01-05 | 2026-03-20 | 100 | 50 | 52 | 340.5 | 200 | 540.5 | 74 | 0.1081 | 0.533196 |
| ABC | 2026-01-12 | 2026-05-15 | 200 | 30 | 28 | 610 | -400 | 210 | 123 | 0.035 | 0.103862 |
| Totals | 950.5 | -200 | 750.5 |
Take XYZ row by row. You were assigned 100 shares at 50 on 5 January and the shares left at 52 on 20 March. The stock result is (52 − 50) × 100 = 200. Across the whole loop — the put credit, the covered-call credits, minus any buy-to-close costs and fees — you kept 340.50 in premium. The cycle result is 200 + 340.50 = 540.50.
Capital at risk was 50 × 100 = 5,000, the cash the put committed. Return on capital is 540.50 ÷ 5,000 = 0.1081, or 10.81%. The cycle ran from 5 January to 20 March, which is 74 days. Scaling that to a year: 0.1081 × 365 ÷ 74 = 0.533196, a 53.32% annualised pace.
ABC is the more instructive row, because it is the case the premium-only trader gets wrong. You were assigned 200 shares at 30 and the shares left at 28, so the stock result is (28 − 30) × 200 = −400. The premium was larger here, 610, because the cycle ran longer and you wrote more calls. The cycle result is −400 + 610 = 210. Capital at risk was 30 × 200 = 6,000, so return on capital is 210 ÷ 6,000 = 0.035, or 3.5%. Over 123 days (12 January to 15 May) that annualises to 0.035 × 365 ÷ 123 = 0.103862, or 10.39%.
Both cycles made money, but not equally. XYZ earned roughly two and a half times the return on capital in 40% less time. ABC's 610 of premium looks like the better income month until you notice it paid for a 400 loss on the shares and left 210.
The totals row makes the point at portfolio level: 950.50 of premium collected, −200 of stock result, 750.50 net across both cycles. If you had only tracked premium you would believe you made 950.50. The shares cost you 200 of that.
The spreadsheet below already contains both rows and every formula above, so you can replace the example cycles with your own.
Download the template: Wheel cycle returns spreadsheet (.xlsx). It opens in Excel, and in Google Sheets via File → Import. The worked example from this guide is already filled in, and the formulas carry down into the blank rows.
Two notes on discipline. First, premium must be after fees, or your return on capital quietly overstates itself by a few tenths of a percent every cycle. Second, do not start a row until the cycle is complete. Half-finished loops — shares still held, calls still open — belong in a separate list, because their stock result is a moving number, not a result.
Where manual tracking breaks down
The spreadsheet is fine for two cycles. It degrades for specific, identifiable reasons.
Rolled puts. You sell a put, roll it out a month, roll it again, and only the third contract is assigned. The cycle's premium is the premium from all three, net of each buy-to-close. People routinely record only the assigned contract and lose the earlier credits — or double-count them by entering the roll as both a close and a fresh open.
Rolled covered calls. Same problem on the call side, multiplied. A six-month wheel can contain eight or nine call legs, each with a credit and most with a closing debit. One missed buy-to-close of $180 turns a measured loss into a measured profit.
Partial assignments and partial sales. You are assigned 200 shares, 100 are called away in March and you sell the other 100 in June. There is no single "Ended" date and no single "Sold at" price, so the single-row model stops working. You either split the row and misallocate the premium, or you average the exits and lose the detail.
Calls written against shares you already owned. If you held 300 shares of ABC before the wheel started and the put delivered 200 more, which covered calls belong to the cycle? Guess wrong and you credit the wheel with premium that came from unrelated stock.
Manual sales versus call-aways. A cycle that ends because you sold the shares yourself is not the same outcome as one that ended by call assignment, and you will want to compare the two. Hand-kept sheets rarely record which happened.
Multiple accounts. An assigned put in an IRA and a covered call in a taxable account are not one wheel, however similar they look. Combined sheets merge them without noticing.
Missed rows and corrections. The failure mode is not one big error. It is a cycle you forgot to close out in May, a fee column you stopped filling in, and a broker correction you never went back to apply. Six months later the totals are wrong and you have no way to tell by how much.
How MetisTrades does it
MetisTrades builds the same record from your imported transactions, detecting the sequence rather than asking you to type it. Everything it produces is an estimate derived from that imported activity.
Getting to the page
Go to Top nav → Analysis → Wheel Cycles, at the route /analysis/wheels. Wheel-cycle tracking is available on Pro portfolio surfaces: you need an active subscription or lifetime access to reach the dedicated Wheel Cycles Analysis sub-tab. Anonymous visitors can use the Analysis area after uploading transaction data for the current browser session. Signed-in users without an active subscription cannot reach the Analysis tab. The sub-tab is hidden from public share links.
How a cycle is assembled
Detection starts from an assigned put leg that delivered shares — a Cash Secured Put, another short put, or the short-put leg inside a larger structure. If that put belongs to a roll chain, the cycle starts from the earliest position in the chain and its put premium includes put-leg premium from every position in that chain, which is the rolled-put problem from the previous section handled for you.
Covered calls are linked two ways. The exact link comes from the stock sale created by assignment: when the assigned put's recorded share disposition and a covered call's linked stock-sale transaction point to the same sale, the call is tied strictly to that wheel. Calls that never sold shares — expired, bought back, still open — are matched through share accounting: MetisTrades checks the shares a call needs, subtracts shares already reserved by other non-wheel covered calls, and links the call only when unrelated shares are insufficient and the wheel has capacity. If pre-existing shares could have covered it, the call is left unattached. That conservatism is deliberate, and it is why some calls need attaching by hand.
Detection runs separately for each trading account. An assigned put in one account cannot seed a wheel using a covered call or stock disposition from another. A cycle stays Active while any assigned shares remain and becomes Completed only after all assigned shares have been disposed and at least one disposition exists; the completion date is the latest recorded disposition date.
The cycle list
Each row carries the fields your spreadsheet held: Active or Completed status, symbol, put strike, assigned share count, assignment date, number of covered calls, days held, net P/L and return percentage. Cycles are grouped by symbol when more than one symbol is present, and in All Accounts the display is partitioned by account first, then by symbol. Look at how a single row collapses an entire sequence — put, shares, calls, exit — into one comparable result.
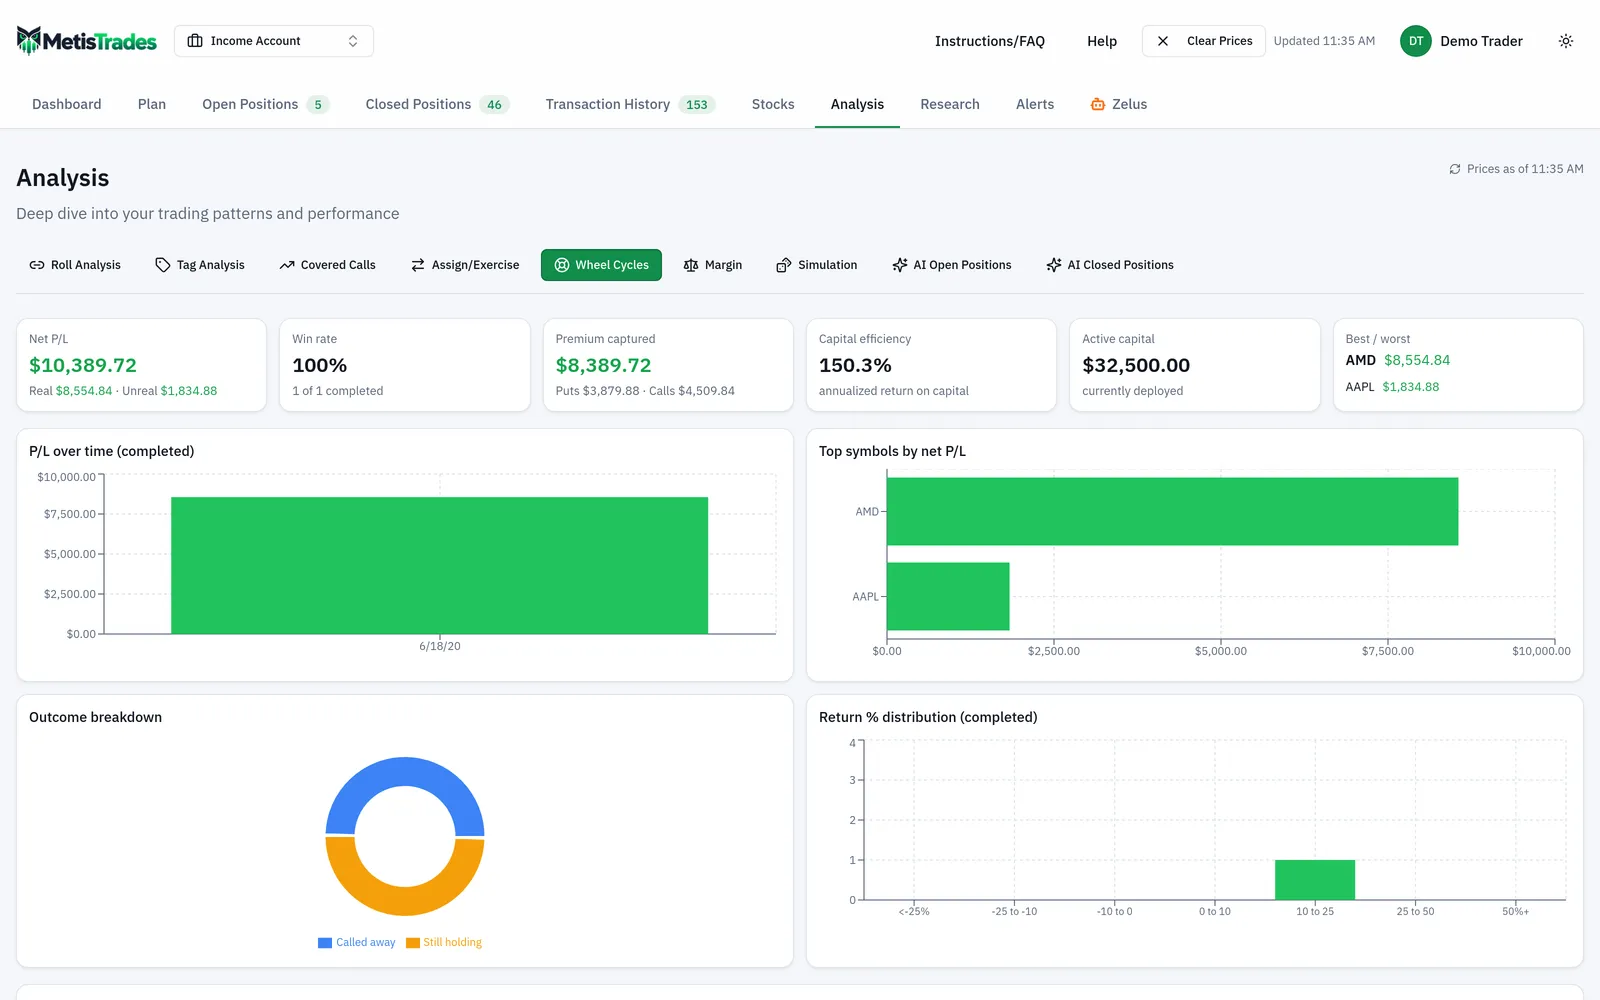
Above the list, summary tiles cover Net P/L (split into realized and unrealized), Win rate (profitable completed cycles out of all completed cycles), Premium captured (separating put premium and call premium), Capital efficiency, Active capital, and Best / worst, where selecting a symbol applies it as a filter. Charts show P/L over time for completed cycles by month, top symbols by net P/L, an outcome breakdown of Called away, Sold back and Still holding, and a return percentage distribution. Charts respond to the current filters.
Filtering and sorting for comparison
The initial filter state includes every cycle. Set it to Completed first — that is the equivalent of only writing finished rows into your sheet. From there you can filter by Symbols, a From and To date range, Outcome (Called away, Sold back, Still holding), cycle length buckets of <30d, 30–90d or 90+d, and P/L: All, Profitable or Losing. Reset filters restores the initial view. A flat list can be sorted by Return %, Days held, Symbol or Completion date; grouped lists add Group order choices of Alphabetical, Most cycles, Best net P/L and Worst net P/L, plus a Within-group sort.
The drill-down
Selecting a row opens Wheel Cycle — [symbol]. The Cycle Summary shows Net P/L, Return on capital, Put premium, Call premium, Stock P/L (assignment), Stock disposition P/L, Days held and Shares remaining — the same decomposition as the worked example, but with the premium split into its put and call halves. The Timeline walks the sequence: Cash-secured put opened, Put assigned · shares acquired, covered-call activity including roll-chain groupings, and finally Shares sold via call assignment or Shares sold (manual). If no call has been linked yet it says No covered call activity yet.
Correcting membership
When the detector leaves a call out, open an editable cycle and use Attach in the Timeline. Choose Covered call to pin an unattached same-symbol call, or Cash-secured put to add another assigned put when multiple assignments contributed shares to the same wheel. Only calls not already linked to a cycle appear in the picker. Manually added items are marked Manually linked, and a promoted put is marked Manually promoted to wheel root. Detach removes an item; for a covered-call roll chain, detach is shown on the chain's first link and removes the continuous chain. Manual covered-call and put premium is included when cycle totals are recalculated, and the detail panel updates to the rebuilt cycle. Manual choices correct membership; they do not rewrite broker transactions.
How to read the results
Net P/L is Put premium + Call premium + Stock P/L (assignment) + Stock disposition P/L. It is the same idea as the 540.50 and 210 in the worked example, with the stock half split in two so you can see assignment handling separately from the eventual disposition. It does not include anything outside the detected cycle — unrelated shares of the same symbol, or calls the detector left unattached.
Return on capital is Net P/L divided by Capital at risk, multiplied by 100, where capital at risk is the assigned put strike times assigned shares. It answers "what did this loop pay on the money it committed", which is why ABC's 3.5% and XYZ's 10.81% are comparable even though the dollar results are 210 and 540.50. It is not a time-adjusted figure, so always read it beside Days held.
Days held runs from the put assignment to the final disposition for a completed cycle, or to today for an active one. Note that this starts at assignment, not at the original put sale — the capital-at-risk clock and the premium clock are not the same window, which is one reason a short, high-return cycle may have had a long put-selling runway before it.
Capital efficiency is premium divided by average capital at risk, annualized using average days held; the tile presents it as annualized return on capital. Treat any annualised figure the way you treat the 53.32% in the worked example: it rescales a 74-day outcome to a year. It assumes an identical cycle repeating back to back, and real cycles differ in length, strike, premium and whether the shares come back at all. It is a pace, not a forecast.
Win rate counts profitable completed cycles out of all completed cycles. Read it next to Net P/L. A trader with eight small winners and one assignment that went badly can show a high win rate and a negative total.
The Outcome breakdown — Called away, Sold back, Still holding — tells you how your cycles actually end, which is often different from how you think they end. A wheel that mostly ends in Sold back is a different strategy from one that mostly ends Called away, and the return distribution usually reflects that.
Finally, the caveats that apply to every figure on the page. Wheel detection depends on the completeness and quality of imported transactions: missing stock transactions or missing assignment links can prevent exact matching, and date-only imports cannot reveal the true intraday sequence of same-day covered calls. All P/L, premiums, cost basis, capital and returns derived from imported transactions are estimates. Prices used for open activity are delayed quotes or the latest available price, so an active cycle's unrealized portion moves with stale data. Tax-related figures are estimates from your imported transactions, not tax advice, and not a substitute for your broker's 1099-B.
Common mistakes
- Counting premium and ignoring the stock leg. ABC collected 610 in premium and returned 210. Fix: always record the stock result in the same row as the premium, and total both.
- Dropping the premium from rolled puts. The credits from contracts you rolled out of belong to the cycle too. Fix: sum the whole roll chain from the earliest put, net of every buy-to-close.
- Entering premium before fees. A few dollars per leg across nine legs is a visible chunk of a 3.5% return. Fix: record premium after fees and commissions, every time.
- Comparing dollars instead of return on capital. 540.50 on 5,000 beats 210 on 6,000 by a wide margin, and the dollar figures hide it. Fix: divide by strike × shares before you rank anything.
- Ignoring duration. Two identical returns over 74 and 123 days are not equivalent. Fix: record Days and read return on capital beside it.
- Leaving unattached covered calls out of the picture. MetisTrades deliberately leaves a call unattached when pre-existing shares could have covered it, which understates that cycle's call premium. Fix: open the cycle and use Attach → Covered call when the call genuinely belongs to the wheel.
- Judging the strategy on active cycles. A cycle still holding underwater shares has no final stock result yet. Fix: filter to Completed before you draw conclusions, and watch Active capital separately.
Related guides and help pages
Related guides
- Tracking the Wheel Strategy: Premium, Share Basis and the Cycle Result
- Assigned at $100 with the stock at $85: where do you sell the first call?
- Your wheel is stuck: shares 30% under water — the honest ways out
- How much capital does $1,000 a month in options income take?
- Assignment and Exercise Explained: Shares, Cash and Basis
- Plan, Track, Optimize: a complete tour of MetisTrades