Tracking covered-call income by symbol
How to total the premium each symbol has produced, record outcomes, and work out a premium-adjusted share cost by hand — then how the Covered Calls page in MetisTrades keeps the same record for you.
What it is and why it matters
A covered call is owned shares paired with a short call on those shares. You sell someone the right to buy your stock at the strike price by a set date, and you collect premium for taking on that obligation. The premium is yours to keep whatever happens next, but if the call is assigned you have to sell the shares at the strike, so the trade caps part of your upside. That trade-off is the whole point: you are exchanging some of the stock's potential gain for cash today.
Once you sell calls repeatedly against the same holding, a question appears that a single trade confirmation cannot answer: how much has this symbol actually paid me? Your broker records each sale as a credit, each buy-to-close as a debit, and each commission as a small deduction. Adding those up per symbol, across months, is work you have to do yourself.
There are four things worth tracking, and they build on each other:
- Net premium per trade — premium received minus anything you paid to close, minus fees.
- Net premium per symbol — the running total of those trade-level figures for one underlying.
- Outcome — whether the call expired, was assigned, was bought back, or is still open. Outcomes tell you whether your strikes are too close to the money.
- Premium-adjusted share cost — your average share cost minus the net premium spread across the shares you own. This is a tracking figure for your own bookkeeping, not your tax cost basis.
That last number is the one people most often get wrong, and it is the one most worth having. If you bought shares at $52.00 and have since collected $2.39 per share in net call premium, your effective cost for tracking purposes is $49.61 — but your broker's cost basis for tax reporting is still $52.00. Premium received from selling options is accounted for separately. Keeping the two numbers apart in your own records saves confusion later.
How to track it by hand
One row per covered call. You add a row when you sell the call, and you fill in the closing columns when it finishes. Everything else is arithmetic.
The columns
- Opened — the date you sold the call.
- Symbol, Strike, Contracts — the trade itself.
- Premium / share — the premium you received, quoted per share as options are.
- Close cost / share — what you paid per share to buy the call back. Enter
0if it expired worthless or was assigned, because in both cases you paid nothing to close the option. - Fees — commissions and exchange fees in dollars, for the whole trade.
- Outcome — Expired, Bought back, Assigned or Open.
- Net premium — computed:
(premium − close cost) × 100 × contracts − fees. - Symbol premium to date — computed: the running sum of Net premium for that symbol, down to and including this row.
The 100 is the contract size — the number of shares one contract represents. Standard equity options usually represent 100 shares, but mini options represent 10, so check before you assume.
Here are four trades across two symbols, covering two months.
| Opened | Symbol | Strike | Contracts | Premium / share | Close cost / share | Fees | Outcome | Net premium | Symbol premium to date |
|---|---|---|---|---|---|---|---|---|---|
| 2026-01-05 | XYZ | 55 | 2 | 1.1 | 0 | 1.3 | Expired | 218.7 | 218.7 |
| 2026-01-12 | ABC | 32 | 1 | 0.9 | 0.25 | 1.3 | Bought back | 63.7 | 63.7 |
| 2026-02-09 | XYZ | 55 | 2 | 1.3 | 0 | 1.3 | Assigned | 258.7 | 477.4 |
| 2026-02-16 | ABC | 33 | 1 | 0.7 | 0 | 0.65 | Expired | 69.35 | 133.05 |
Walking the arithmetic
Row 1, XYZ 55 calls, expired. Two contracts sold at $1.10 per share. Nothing was paid to close, so the gross is (1.1 − 0) × 100 × 2 = $220.00. Subtract $1.30 in fees and the net premium is $218.70. It is XYZ's first row, so symbol premium to date is also 218.7.
Row 2, ABC 32 call, bought back. One contract sold at $0.90 and closed at $0.25. The per-share difference is $0.65, so the gross is 0.65 × 100 × 1 = $65.00. Less $1.30 in fees gives $63.70. Note that buying back a call for less than you sold it still counts as a win in cash terms — you kept $0.65 of the $0.90.
Row 3, XYZ 55 calls, assigned. Two contracts at $1.30, nothing paid to close: (1.3 − 0) × 100 × 2 = $260.00, less $1.30 in fees, so $258.70. Assignment means the shares were sold at $55, but the option side of the trade still kept its full premium. The stock side of an assignment is a separate record; do not try to fold it into this sheet.
Row 4, ABC 33 call, expired. One contract at $0.70: 0.70 × 100 = $70.00, less $0.65 in fees, $69.35. The symbol running total for ABC becomes 63.7 + 69.35 = $133.05.
Totalling the Net premium column gives $610.45 across all symbols: $477.40 from XYZ and $133.05 from ABC. The symbol running totals already tell you this — the last XYZ row reads 477.4 and the last ABC row reads 133.05 — which is exactly why the running column is worth carrying.
Turning symbol premium into an adjusted share cost
Take the symbol total and divide by the shares you hold. Suppose you own 200 shares of XYZ bought at $52.00 each. The $477.40 of net premium spread across 200 shares is $2.387 per share, so your premium-adjusted cost is 52.00 − 2.39 = $49.61, a reduction of about 4.6% against the original share cost. Keep this in a second small sheet with columns for Symbol, Shares, Stock cost, Net premium, Adjusted cost and Reduction, and refresh it whenever the symbol total changes.
The spreadsheet below already contains these four rows, the running-total formula and the column notes, so you can delete the example rows and start entering your own.
Download the template: Covered-call income tracker (.xlsx). It opens in Excel, and in Google Sheets via File → Import. The worked example from this guide is already filled in, and the formulas carry down into the blank rows.
Outcome discipline
Fill in the Outcome column the same week the trade finishes, not months later. Three of the four outcomes in the example produced an identical kind of cash flow, but they mean different things about your strike selection: two expirations suggest strikes were far enough out, one assignment means the stock ran past $55 and the shares went, and one buy-back means you chose to close early rather than risk the last $0.25.
Where manual tracking breaks down
The sheet above works perfectly for four trades. It degrades in specific, predictable ways.
Missed rows. The sheet only knows about trades you type in. A call you sold on a busy afternoon and forgot to record silently removes premium from the symbol total — and because the running total is cumulative, every later row for that symbol is wrong too, including the adjusted cost derived from it.
Partial fills. You enter an order to sell three contracts and get two filled at one price and one at another, on separate confirmations. Now one intended trade is two rows, each with its own fees, and the strike-level history no longer lines up with what you remember doing.
Rolls. Rolling is closing one call and opening a replacement at a different strike or expiration, often as a single order. In the sheet that is a close cost on the old row plus a brand-new row, and nothing links the two. Six weeks later you cannot tell whether a symbol's premium came from six independent calls or from one position rolled five times, which are very different in terms of risk taken.
Assignments. Assignment touches two records at once: the option closes with no buy-back cost, and 100 shares per contract leave the account at the strike. If you only update one of them, your share count drifts, and a share count that is wrong makes every per-share adjusted cost wrong.
Multiple accounts. The same symbol in a taxable account and an IRA needs either separate sheets or an account column plus more careful formulas. Mix them and you can end up matching a buy-to-close in one account against an opening sale in the other.
Corrections. Brokers adjust fees, reverse mistaken trades and restate activity. Each correction means hunting down a row you entered weeks ago and recomputing everything below it.
Open positions. The sheet can tell you cash received, but it cannot tell you what an open call would cost to buy back today. Without that, you do not know whether an open position is currently ahead or behind.
How MetisTrades does it
MetisTrades builds the same record from your imported transactions. Everything it shows is an estimate derived from those transactions, which is worth holding in mind throughout.
Getting to the page
Go to Analysis → Covered Calls in the top nav, at the route /analysis/covered-calls. The page is available to users with active access; a signed-in user without an active subscription or lifetime access cannot reach the Analysis tab. Someone holding a public share link can see Covered Calls for the shared data.
The page analyzes call-opening sales that belong to positions classified as Covered Call. Calls that are part of spreads or other strategies are excluded, which is why a short call you remember selling may not appear here.
The summary cards
Four cards sit at the top. Net Premium Income is premium collected minus premium paid to close — compare it with your $610.45 total. Win Rate shows wins and losses among non-open covered calls. Assignment Rate shows assigned calls as a percentage of closed trades. Open P/L shows estimated P/L across open calls and the number of open positions, which is the figure your sheet could not produce.
When your data covers more than one month, Monthly Premium Income charts net covered-call premium by month, with positive months in green and negative months in red.
Adjusted Cost Basis by Symbol
Below the chart is the per-symbol table, which is the hand-built sheet's second page done for you. Look at how Stock Cost and Net Premium combine into Adjusted Cost, and at the Reduction column that expresses the difference in dollars and as a percentage.
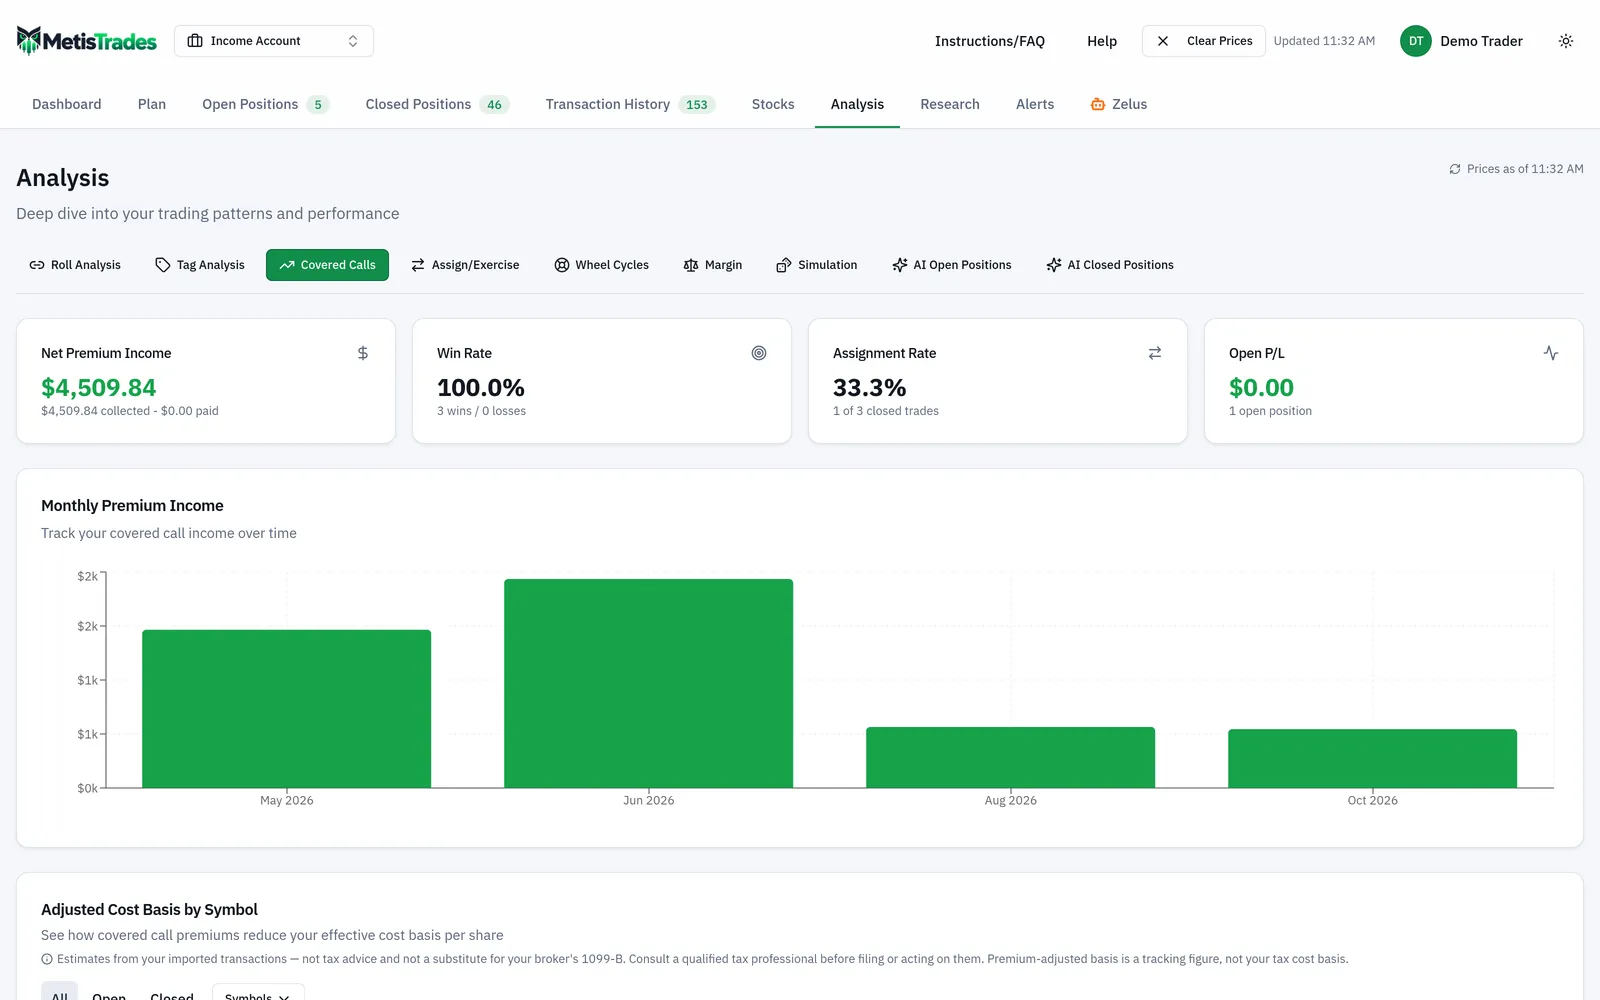
The table columns are Symbol, Shares, Stock Cost, Net Premium, Adjusted Cost, Reduction, Trades and Win Rate. Adjusted Cost is Stock Cost minus Net Premium divided by Shares — the same division you did to get $49.61.
The card's filters are All, Open and Closed, plus a multi-select symbol picker. Clear removes all active filters, and a summary line reports how many trades and symbols remain and whether only open or closed trades are shown. In the status filter, every outcome other than Open counts as closed, so expired and assigned calls are included there.
Per-symbol trade history
Expand a symbol to open Trade History for that symbol. Its columns are Strike, Opened, Expiration, Contracts, Premium, Net P/L and Outcome — close to the sheet you built, with the expiration date added. Outcome badges include Open, Expired, Assigned, Closed and Rolled.
The rolled badge is the part a spreadsheet cannot replicate. A roll-chain indicator identifies a trade that belongs to a chain, including its roll count and Chain Total, and selecting it opens position details. A wheel-cycle marker can open the related cycle detail panel, which matters if your calls sit inside a wheel — selling puts, taking assignment, then selling calls on the shares.
If you run more than one account, an all-accounts view groups symbol rows by account. Each account section shows symbols, trades, open and closed counts, win rate and net premium, and can be expanded or collapsed. Opening and closing calls are matched within the same account, so premium in one account cannot affect another account's trade matching.
Individual finished trades
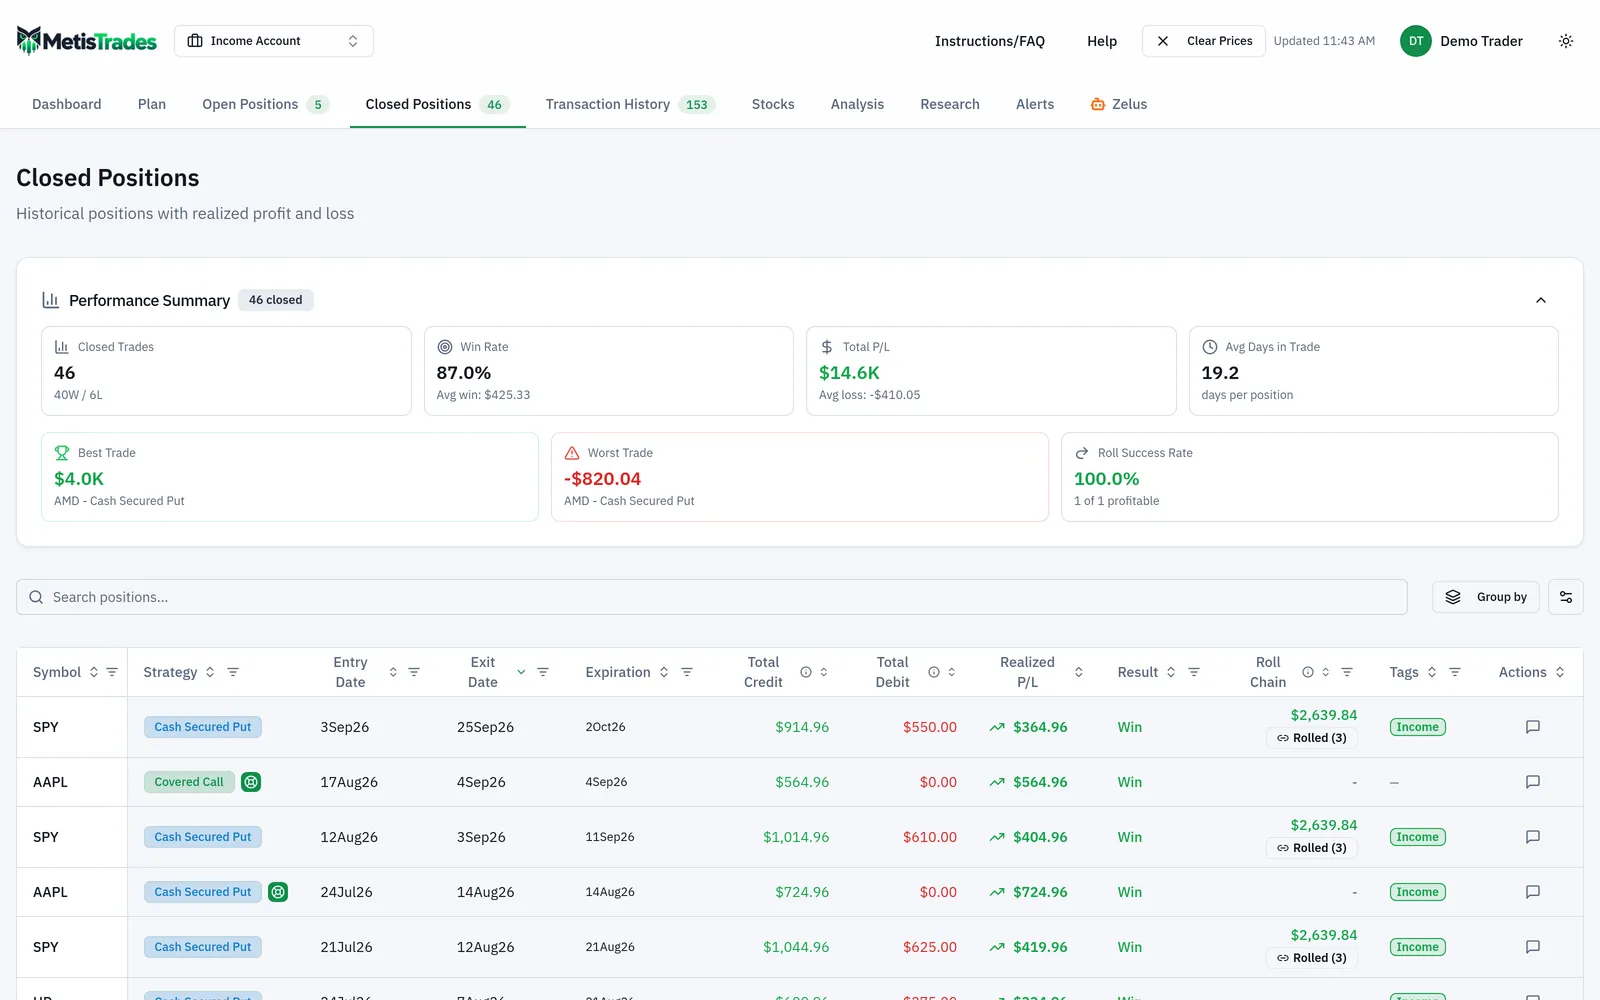
Covered Calls is organized by symbol. When you want one finished trade on its own rather than the symbol total, selecting a trade from the history opens its position details, and the portfolio's Closed Positions page lists completed positions.
If nothing appears at all, the page shows No Covered Calls Found, with a message explaining that covered calls are detected when you sell call options against shares you own.
How to read the results
Net Premium Income is opening premium received minus amounts paid on matched buy-to-close transactions. It is cash from the option side only. It does not include gains or losses on the shares themselves, so a symbol with healthy premium income can still be a loss overall if the stock fell.
Win Rate is winning closed trades divided by all non-open trades. Expired and assigned outcomes count as wins, and a normally closed trade wins when net premium is positive. That definition means assignment is counted as a win even though it took your shares — reasonable from the option's point of view, but read Win Rate next to Assignment Rate rather than alone.
Assignment Rate is assigned outcomes divided by all non-open trades. A rising rate usually means your strikes are sitting closer to the money than you intend.
Open P/L is opening premium received minus the estimated cost to close each open call at the latest available price. An open call is valued using the available mark, then the bid/ask midpoint, then the last price. Quotes are delayed, so this figure can be stale, and it may be absent when no usable option price is available. It is an estimate of where you stand, not a fill you can get.
Adjusted Cost is Stock Cost minus Net Premium divided by Shares, and Reduction is the per-share difference shown in dollars and as a percentage of Stock Cost. Stock Cost is the holding's average share cost from imported stock activity, including transferred shares that have an entered basis. Adjusted Cost is blank when there is no matching stock holding with shares and a stock cost basis.
Adjusted Cost does not change your broker's tax basis. It is a premium-adjusted tracking figure that spreads net covered-call premium across the currently recognized shares, and it can differ from broker accounting. In an all-accounts view, account rows remain separate for covered-call premium, but share and cost-basis figures for the same symbol use the aggregate holding. Tax-related figures here are estimates from imported transactions, not tax advice, and not a substitute for your broker's 1099-B.
Chain Total is P/L for all positions linked in that roll chain, not only the covered-call row you selected. When you are judging whether a rolled position worked, the chain total is the honest number; the individual row is just one leg of a longer story.
Outcomes are derived rather than declared: a matching buy-to-close marks a call closed, an expiration record marks it expired, and an assignment or exercise record marks it assigned. A past expiration with no matched close is also shown as expired.
Common mistakes
- Treating premium-adjusted cost as tax cost basis. It is a tracking figure only. Fix: keep the broker's basis as the number you use for tax, and label the adjusted figure clearly in your own records.
- Entering a close cost for an assigned or expired call. You paid nothing to close in either case, which is why rows 1, 3 and 4 of the example show 0. Fix: reserve the close-cost column for actual buy-to-close transactions.
- Forgetting fees. The example loses $4.55 to fees across four trades — small per trade, visible over a year. Fix: record fees on the row, not as an annual lump you never get round to.
- Assuming every contract is 100 shares. Mini options use 10, and other contracts can use a broker-supplied multiplier. Fix: check the multiplier before multiplying.
- Recording a roll as one trade. A roll is a close and an open, and collapsing it hides both the cost of closing and the real number of trades. Fix: record both legs, and read Chain Total when you want the lifecycle result.
- Reading a high Win Rate as a good outcome. Expired and assigned both count as wins, so a symbol can show a strong win rate while repeated assignment keeps selling your shares. Fix: read Win Rate, Assignment Rate and Net Premium Income together.
- Expecting Open P/L to be a fill price. It is built from delayed quotes and may be missing entirely. Fix: treat it as a position estimate and check the live market at your broker before acting.
Related guides and help pages
Related guides
- Tracking the Wheel Strategy: Premium, Share Basis and the Cycle Result
- Covered Calls Explained: Premium, Capped Upside and Adjusted Cost
- Premium-Adjusted Cost Basis for Covered-Call Holders
- Plan, Track, Optimize: a complete tour of MetisTrades
- Your covered call is in the money: let it go, roll up and out, or buy it back?
- Your wheel is stuck: shares 30% under water — the honest ways out