Covered Calls Explained: Premium, Capped Upside and Adjusted Cost
A covered call sells someone the right to buy shares you already own. Work through four trades by hand to see how premium accumulates, what assignment really costs you, and how premium lowers your tracking cost per share.
What it is and why it matters
A covered call is two things held together: shares you already own, and a call option you sold against those shares.
A call gives its holder the right, but not the obligation, to buy the underlying stock at a fixed price — the strike — up to the expiration date. When you sell a call, you take the other side of that right. You collect money up front, called the premium, and you accept the obligation to deliver shares at the strike if the holder exercises.
The word "covered" describes where those shares come from. If you already hold them, you can deliver without buying at the market price first. One standard equity option normally represents 100 shares, so 200 shares covers two contracts. That number is the contract size or multiplier, and it is not always 100 — mini options use 10, and futures options use a broker-supplied multiplier. Everything below assumes standard 100-share contracts.
Premium is quoted per share. A call sold at $1.10 on a standard contract pays $1.10 × 100 = $110 before fees, not $1.10.
Three outcomes end a covered call:
- Expired. The stock finishes at or below the strike, the call has no intrinsic value (the amount a call sits above its strike, floored at zero), and it expires worthless. You keep the premium and the shares.
- Bought back (closed). You pay to buy the call back before expiration. Your result is premium received minus what you paid, minus fees.
- Assigned. The holder exercises and you are assigned: you sell your shares at the strike, whatever the market price is. You keep the premium.
This matters because the trade changes the shape of your stock ownership. The premium is money in hand regardless of outcome, and over time it reduces what the shares effectively cost you. In exchange, gains above the strike are no longer yours — your upside is capped. And the premium does not protect you much on the way down: if the stock falls, you still own all of the decline, cushioned only by the premium you collected. Options involve risk, and a covered call does not remove the risk of owning the shares.
That trade-off is why the record keeping matters. Premium arrives in small amounts across many trades; the capped upside and the assignments show up as one-off events. Unless you total them, you cannot say what the approach actually did for you.
Work it out by hand
Here are four covered calls across two symbols, opened over two months. For each one, record the premium per share you received, the per-share cost to close if you bought it back (zero if it expired or was assigned), fees, and the outcome.
The arithmetic for each row is:
Net premium = (premium per share − close cost per share) × 100 × contracts − fees
The spreadsheet below contains these four rows and the formulas that produce every figure in the table, including the running per-symbol total.
Download the template: Covered-call income tracker (.xlsx). It opens in Excel, and in Google Sheets via File → Import. The worked example from this guide is already filled in, and the formulas carry down into the blank rows.
| Opened | Symbol | Strike | Contracts | Premium / share | Close cost / share | Fees | Outcome | Net premium | Symbol premium to date |
|---|---|---|---|---|---|---|---|---|---|
| 2026-01-05 | XYZ | 55 | 2 | 1.10 | 0 | 1.30 | Expired | 218.70 | 218.70 |
| 2026-01-12 | ABC | 32 | 1 | 0.90 | 0.25 | 1.30 | Bought back | 63.70 | 63.70 |
| 2026-02-09 | XYZ | 55 | 2 | 1.30 | 0 | 1.30 | Assigned | 258.70 | 477.40 |
| 2026-02-16 | ABC | 33 | 1 | 0.70 | 0 | 0.65 | Expired | 69.35 | 133.05 |
Row by row
Row 1 — XYZ, expired. Two contracts at $1.10 per share: 1.10 × 100 × 2 = $220.00 collected. Nothing was paid to close, so subtract fees of $1.30: $220.00 − $1.30 = $218.70. The stock finished at or below $55, the call expired worthless, and you kept both the premium and the 200 shares.
Row 2 — ABC, bought back. One contract at $0.90 collects 0.90 × 100 = $90.00. You later bought it back at $0.25 per share, paying 0.25 × 100 = $25.00. The difference is $65.00, and fees of $1.30 leave $63.70. You gave up $25 of the original $90 to end the obligation early and free the shares.
Row 3 — XYZ, assigned. Two contracts at $1.30: 1.30 × 100 × 2 = $260.00, minus $1.30 in fees = $258.70. Nothing was paid to close, because the position ended by assignment instead: the 200 shares were sold at the $55 strike.
Row 4 — ABC, expired. One contract at $0.70: 0.70 × 100 = $70.00, minus $0.65 = $69.35.
Totals by symbol
The running column adds each row to the previous total for the same symbol. XYZ: $218.70 + $258.70 = $477.40. ABC: $63.70 + $69.35 = $133.05. Across both symbols, net premium is $477.40 + $133.05 = $610.45.
Four trades, three different outcomes, one number you can defend. Notice the assigned trade is the largest single contributor to premium — assignment is not a failure of the premium column. What it costs you shows up elsewhere.
Turning premium into an adjusted cost per share
Premium collected on a symbol can be spread across the shares you hold in that symbol to give a premium-adjusted tracking cost. Suppose the 200 XYZ shares were bought at $52.00 each, a stock cost of $10,400.
$477.40 of net premium across 200 shares is 477.40 ÷ 200 = $2.387 per share, about $2.39. Adjusted cost is $52.00 − $2.387 = $49.61 per share, a reduction of 4.6% against the $52.00 stock cost (2.387 ÷ 52.00 = 0.0459).
This is a tracking figure for your own records. It is not your broker's tax cost basis, and it does not change anything your broker reports.
What the assignment actually cost
The premium column does not show the capped upside, so work it out separately. The 200 XYZ shares were sold at the $55 strike for $11,000, against a $10,400 stock cost: a $600 stock gain, plus $477.40 of premium, or $1,077.40 in total.
If XYZ was trading at $60 when the call was assigned, the shares you delivered at $55 would have been worth 60 × 200 = $12,000 on the open market. The $5.00 per share above the strike — $1,000 across 200 shares — is upside you sold. Against $477.40 of premium collected on that symbol, the call capped you $522.60 short of simply holding. Track both numbers, or the premium total will flatter the strategy.
What changes the outcome
Change one input at a time in the worked example and watch what moves.
Premium per share. Row 1 at $1.30 instead of $1.10 collects 1.30 × 100 × 2 = $260.00 and nets $258.70 rather than $218.70 — a $40 swing from a twenty-cent change in quote. Premium is multiplied by 100 and by contracts, so small quote differences are not small dollars.
Strike. Row 3 written at $57 instead of $55 collects less premium, because a call further out of the money (above the stock price, with no intrinsic value) is worth less. It is also less likely to be assigned, and if it is, the shares sell for $2 more each — $400 more across 200 shares. A higher strike trades premium for retained upside.
Cost to close. Row 2 bought back at $0.60 instead of $0.25 pays 0.60 × 100 = $60.00 against $90.00 collected, netting $90.00 − $60.00 − $1.30 = $28.70 instead of $63.70. Buying back late, after the stock has risen toward the strike, is the most common way a winning covered call becomes a small one.
Fees. Row 4's $0.65 fee against $70.00 of premium is just under 1%. Apply $1.30 instead and net premium drops to $68.70. On a one-contract, seventy-cent call, fees are a visible share of the result; on a two-contract, $1.30 call, far less so.
Contracts. Row 1 at four contracts rather than two collects 1.10 × 100 × 4 = $440.00. It also requires 400 shares of coverage. Size scales both premium and the quantity of stock whose upside you have capped.
Time to expiration. A call's price above its intrinsic value is extrinsic value, and it decays toward zero by expiration. A longer-dated call pays more premium up front but keeps your shares committed longer, while a short-dated one pays less per trade and comes back for a decision sooner.
Implied volatility. Implied volatility (IV) is the level of future movement implied by an option's market price. Higher IV raises the premium on the same strike and expiration — but it is priced in because the market expects a wider range of moves, which is also the environment in which the stock can run past your strike or fall well below your entry.
Contract size. Swap a standard contract for a mini and the multiplier is 10, not 100. Row 1 as two mini contracts collects 1.10 × 10 × 2 = $22.00 and needs 20 shares of coverage. Always use the contract's actual multiplier.
Where you see it in MetisTrades
MetisTrades builds these same figures from your imported transactions. Go to Analysis → Covered Calls (route /analysis/covered-calls). The page analyzes call-opening sales that belong to positions classified as Covered Call, and it is available to users with active access; a signed-in user without an active subscription or lifetime access cannot reach the Analysis tab.
At the top, four summary cards line up with the hand calculation. Net Premium Income is premium collected minus premium paid to close — the app's counterpart to the $610.45 total in your spreadsheet. Win Rate counts winning closed trades against all non-open trades, with expired and assigned outcomes counting as wins and a normally closed trade counting as a win when its net premium is positive. Assignment Rate is assigned outcomes divided by all non-open trades. Open P/L is opening premium received minus the estimated cost to close each open call at the latest available price, alongside the number of open positions. When the data spans more than one month, Monthly Premium Income charts net premium by month, green for positive and red for negative. Below that, Adjusted Cost Basis by Symbol is the card that reproduces the $49.61 calculation — look at the Symbol, Shares, Stock Cost, Net Premium, Adjusted Cost, Reduction, Trades and Win Rate columns.
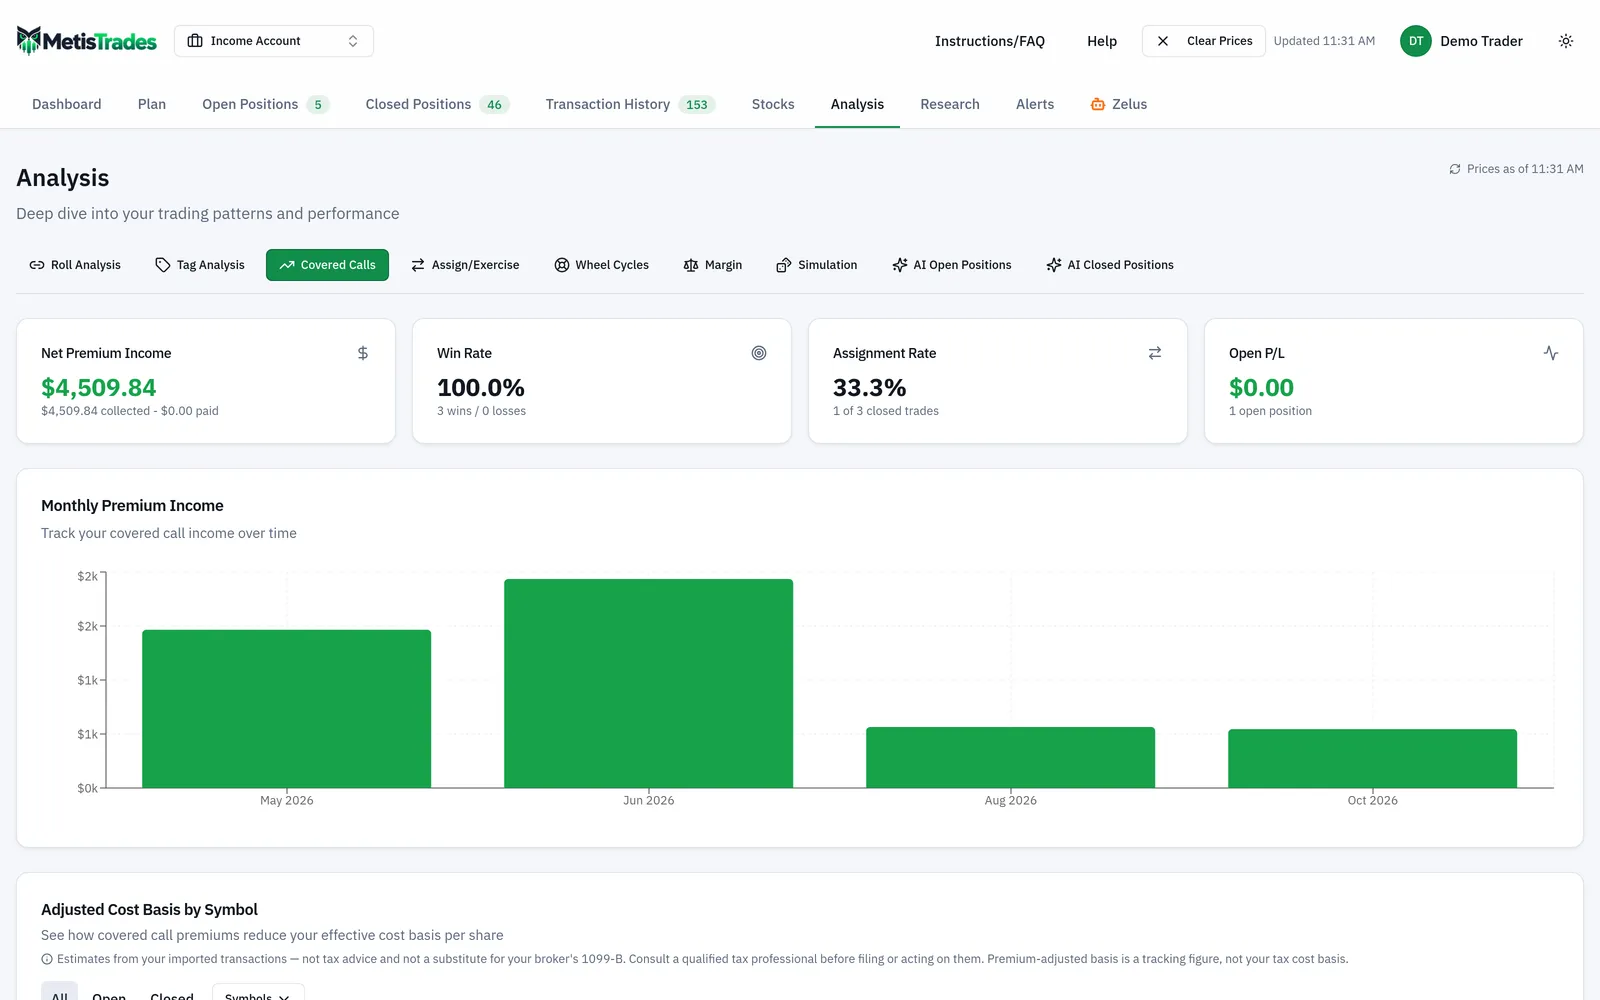
Adjusted Cost is Stock Cost minus Net Premium divided by Shares, which is exactly the $52.00 − ($477.40 ÷ 200) arithmetic above. Reduction shows the per-share difference in dollars and as a percentage of Stock Cost. The card's filters are All, Open and Closed, plus a multi-select symbol picker, and Clear removes all active filters; a summary line reports how many trades and symbols remain. Expanding a symbol opens Trade History for that symbol, with columns Strike, Opened, Expiration, Contracts, Premium, Net P/L and Outcome — your spreadsheet rows, one for one. Outcome badges include Open, Expired, Assigned, Closed and Rolled. A roll-chain indicator marks a trade that belongs to a chain and shows its roll count and Chain Total, which is P/L for every position in that chain, not just the row you selected. A wheel-cycle marker can open the related cycle detail panel. If no covered calls are found, the page shows No Covered Calls Found.
None of that appears unless the position is labelled Covered Call, and that label comes from Open Positions. MetisTrades classifies a single sell-to-open call as Short Call unless there is sufficient long-share context to support Covered Call, using the option's contract multiplier to decide how many shares are needed — normally 100 for a standard equity option and 10 for a mini. Look at the Strategy column.
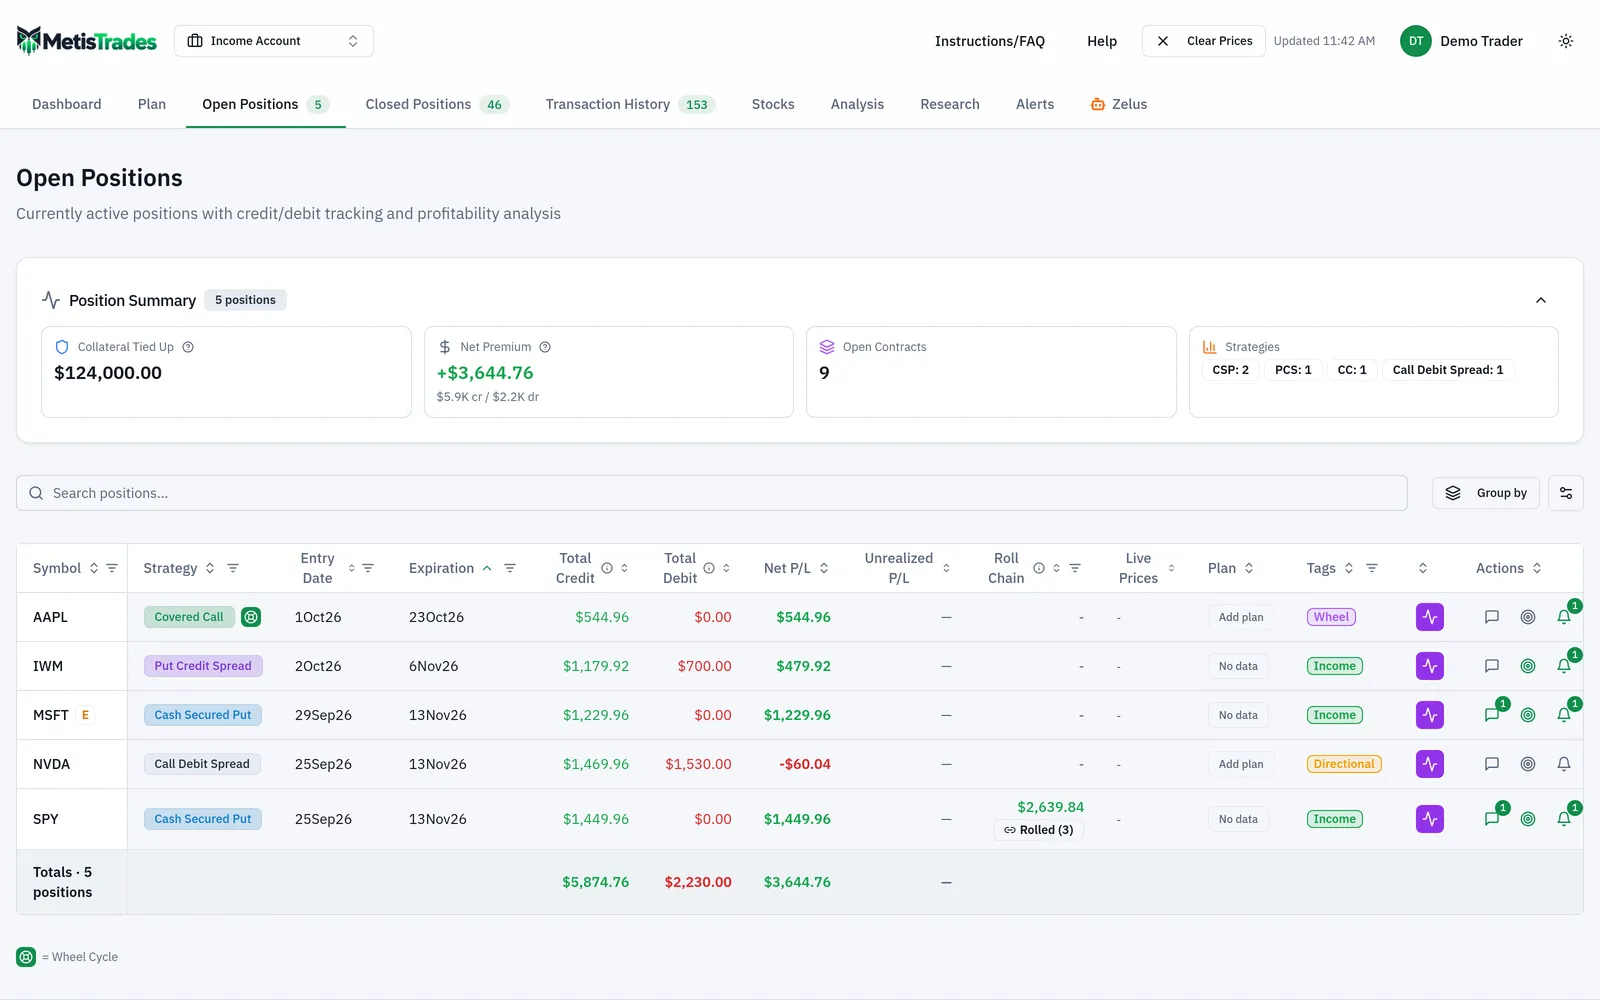
If your import starts after you bought the shares, or a transfer is missing, a genuinely covered call can appear as an uncovered Short Call and drop out of the Covered Calls page. Use Reclassify on Open Positions or Closed Positions to open the Strategy Reclassification dialog, which lists eligible Short Call and Long Put positions and converts Short Call to Covered Call. A converted row carries an R badge beside its strategy, and the Revert tab undoes it. The override changes the displayed strategy and the strategy-specific treatment that follows it; it does not rewrite, merge, split or delete your broker transactions. These position tables are Pro surfaces.
Two things to hold in mind when reading the numbers. Open P/L uses delayed quotes and may be absent when no usable option price is available; for an open call the page prefers the available mark, then the bid/ask midpoint, then the last price. And every classification, outcome, premium total and P/L figure is an estimate built from your imported transactions.
Common mistakes
- Reading premium per share as the dollars received. $1.10 is $110 on a standard contract. Fix: multiply by the contract's actual multiplier and by contracts before recording anything.
- Treating assignment as a loss. Row 3 was the largest premium contributor at $258.70, and the shares sold at the strike. Fix: record the premium and the forgone upside above the strike as two separate numbers.
- Thinking premium protects you on the downside. $2.39 per share of premium cushions a $2.39 fall, not a $10 one. Fix: size the position to stock risk you would accept without the call.
- Taking adjusted cost as tax cost basis. $49.61 is a premium-adjusted tracking figure, not your broker's accounting. Fix: use your broker's official forms for tax; MetisTrades' figures are estimates from imported transactions.
- Forgetting the buy-back cost. Row 2 collected $90.00 but netted $63.70. Fix: always subtract the close cost per share before calling a trade a winner.
- Judging the approach on Win Rate alone. Expired and assigned both count as wins, so a high rate can sit beside heavy capped upside. Fix: read Win Rate together with Net Premium Income, Assignment Rate and what the called-away shares would have been worth.
- Assuming a missing call means a missing trade. The page includes only sell-to-open calls attached to positions classified as Covered Call; calls in spreads and other strategies are excluded. Fix: check the Strategy column on Open Positions and reclassify an eligible Short Call if the share context was not imported.
Related guides and help pages
Related guides
- Cash-Secured Puts Explained: Collateral, Effective Price and the Wheel
- Vertical spreads: defined-risk option trades
- Iron Condors, Straddles and Other Multi-Leg Positions
- How Strategies Get Their Names (And How to Correct Them)
- Tracking the Wheel Strategy: Premium, Share Basis and the Cycle Result
- Tracking covered-call income by symbol