Cash-Secured Puts Explained: Collateral, Effective Price and the Wheel
A cash-secured put commits cash today in exchange for premium, and may hand you shares tomorrow. Work out the collateral, the effective purchase price and the return on collateral by hand, then see where those figures appear in MetisTrades.
What it is and why it matters
A put is a contract that gives its holder the right, but not the obligation, to sell 100 shares of a stock at a fixed price by a fixed date. That fixed price is the strike. The fixed date is the expiration. The buyer pays the seller a premium for that right, quoted per share, so a premium of $1.50 on a standard contract is $150 of cash.
When you sell a put, you take the other side. You collect the premium and accept the obligation: if the holder exercises, you must buy the shares at the strike. That obligation landing on you is called assignment.
A cash-secured put is a short put backed by enough cash to buy those shares if assignment happens. The cash you set aside is the collateral. For one standard contract at a $50 strike, that is $50 × 100 = $5,000 held in reserve from the day you open the trade until the option is closed, expires or is assigned.
Two things matter here, and both are arithmetic you can do on paper.
The first is the effective purchase price if assigned: the strike minus the premium per share. You agreed to pay $50, but you were paid $1.50 to agree, so the shares cost you $48.50 net. That figure is also your breakeven at expiration. Above it you are ahead; below it you are behind, and the stock can keep falling. If the company goes to zero, you paid $48.50 per share for nothing, which is $4,850 of loss on one contract. A cash-secured put is not a low-risk trade; it is a trade whose risk looks very much like owning the stock, with the upside capped at the premium.
The second is return on collateral: premium received divided by the cash committed. This is the honest denominator. The $150 premium is not a return on nothing — it is a return on the $5,000 you cannot use for anything else while the trade is open.
Cash-secured puts also start the wheel: sell a cash-secured put, take the shares if assigned, then sell covered calls against those shares. Everything downstream depends on getting the first step's numbers right, because the price you were effectively assigned at becomes the reference point for the stock position that follows.
Work it out by hand
Two trades, opened a week apart. The same four formulas apply to both.
Step 1: collateral
Collateral = strike × 100 × contracts.
XYZ: $50 × 100 × 1 = $5,000. ABC: $30 × 100 × 2 = $6,000. Together you have committed $11,000 of cash to two positions. That total is the number to compare against your account, not the premium.
Step 2: premium received
Premium received = premium per share × 100 × contracts.
XYZ: $1.50 × 100 × 1 = $150. ABC: $0.80 × 100 × 2 = $160. Total credit: $310. ABC pays slightly more in dollars than XYZ despite the lower per-share premium, purely because it is two contracts.
Step 3: effective purchase price if assigned
Effective price = strike − premium per share. This is per share, not per contract, and it does not change with the number of contracts.
XYZ: $50.00 − $1.50 = $48.50. ABC: $30.00 − $0.80 = $29.20. If XYZ is assigned you own 100 shares with $48.50 of cost per share attached. If ABC is assigned you own 200 shares at $29.20 each, a $5,840 stock position funded out of the $6,000 you set aside.
Step 4: return on collateral
Return on collateral = premium received ÷ collateral, ignoring fees.
XYZ: $150 ÷ $5,000 = 0.03, or 3.0000%. ABC: $160 ÷ $6,000 = 0.026667, or 2.6667%. Across both: $310 ÷ $11,000 = 0.028182, or 2.8182%. The combined figure sits between the two because it weights each trade by the cash it ties up, which is exactly what you want.
Step 5: days to expiration
Days to expiration (DTE) = expiration date − open date. XYZ: 2026-01-05 to 2026-02-06 is 26 remaining days in January plus 6 in February = 32 days. ABC: 2026-01-12 to 2026-02-13 is 19 plus 13 = 32 days. Same holding window, which makes the two returns directly comparable.
If you want a rate you can compare with other uses of cash, scale by time rather than guessing: 3.0000% over 32 days is 0.03 × 365 ÷ 32 ≈ 34.2% a year, and the pair together is 0.028182 × 365 ÷ 32 ≈ 32.1%. Treat that as arithmetic only. It assumes you repeat the trade continuously at the same premium and are never assigned at a loss, and neither assumption is safe.
The spreadsheet below contains both rows with these formulas already in place, so you can change a strike or a premium and watch every derived column move.
Download the template: Cash-secured put log (.xlsx). It opens in Excel, and in Google Sheets via File → Import. The worked example from this guide is already filled in, and the formulas carry down into the blank rows.
| Opened | Symbol | Expiration | Strike | Contracts | Premium / share | Collateral | Premium received | Effective price if assigned | Return on collateral | Days to expiration |
|---|---|---|---|---|---|---|---|---|---|---|
| 2026-01-05 | XYZ | 2026-02-06 | 50 | 1 | 1.50 | 5,000 | 150 | 48.50 | 3.0000% | 32 |
| 2026-01-12 | ABC | 2026-02-13 | 30 | 2 | 0.80 | 6,000 | 160 | 29.20 | 2.6667% | 32 |
| Total | 11,000 | 310 | 2.8182% |
Read the table as two outcomes rather than one. If both options expire worthless you keep $310 on $11,000 of committed cash over 32 days. If both are assigned you own 100 XYZ at $48.50 and 200 ABC at $29.20, and your profit or loss from that point depends entirely on where the stocks go next.
What changes the outcome
Change one input at a time and recompute. Every figure below is the XYZ row with a single number altered.
Strike
Drop the strike from $50 to $45 and the premium will fall too — say to $0.60. Collateral becomes $45 × 100 = $4,500, premium becomes $60, the effective price becomes $44.40, and return on collateral becomes $60 ÷ $4,500 = 1.3333%. You cut the return by more than half to move the breakeven $4.10 lower. That trade is not better or worse; it is a different bet on where the stock will not go.
Premium, which moves with implied volatility
Implied volatility (IV) is the amount of future movement the market is pricing into the option. Higher IV means a wider expected range and a fatter premium. If IV rises and the same $50 put pays $2.25, premium received becomes $225, the effective price becomes $47.75, and return on collateral becomes $225 ÷ $5,000 = 4.5000%. The extra $75 is not free: the market is paying you more because it expects larger moves in both directions.
Time to expiration
Stretch the 32 days to 60 and the premium might go to $2.10 rather than doubling, because extrinsic value does not grow in a straight line with time. That is $210 on $5,000, or 4.2000% — but spread over 60 days it is $3.50 of premium per day against $4.69 per day for the 32-day version ($150 ÷ 32). Longer dates raise the headline return and lower the rate at which the cash works.
Contracts and contract size
Go from 1 contract to 3 and collateral becomes $15,000, premium becomes $450, and return on collateral stays at 3.0000%. The percentage is unchanged; the dollars at risk triple. Contract size matters too: standard equity options usually represent 100 shares, but mini options represent 10, so the same $50 strike on a mini contract ties up $500 and pays $15.
Where the stock lands
If XYZ finishes at $44, you are assigned 100 shares at $50 while they are worth $44. Against your $48.50 effective price that is a $450 unrealized loss ($48.50 − $44.00 = $4.50, × 100). The $150 premium did not disappear; it reduced a $600 loss to $450. If XYZ finishes anywhere above $50, you keep the $150 and nothing else.
Fees
Return on collateral in the worked example ignores fees. At roughly $0.65 per contract plus exchange charges, ABC's two contracts might cost $1.30, leaving $158.70 net. Return on collateral becomes $158.70 ÷ $6,000 = 2.6450% instead of 2.6667%. Small on one trade, meaningful across dozens of small premiums a year.
Whether the cash is actually there
"Cash-secured" is a description of how you have funded the trade, not something the contract enforces. If you are assigned on XYZ and the $5,000 is not sitting in the account, the purchase is financed by borrowing, and the position is no longer the trade you worked out on paper. Early assignment is possible on American-style options, particularly when a put is deep in the money, so the cash needs to be available before expiration day, not on it.
Where you see it in MetisTrades
Start with the cash side. Transaction History shows a Cash Summary built from your imported transactions, separating Total Deposits, Withdrawals, Trade Cash Flow, Dividends, Interest, Subscriptions/Margin Interest, Other Activity and trading fees. The $310 of premium from the two puts arrives inside Trade Cash Flow, and the trading-fee total is where the costs that your hand calculation ignored are summed. An anonymous visitor who has uploaded a transaction file can see a Cash Summary calculated in the browser from that session's file; nothing is saved.
Next, the position itself. MetisTrades classifies a position from its opening legs, and a single sell-to-open put is normally labeled Cash Secured Put. On Open Positions, look at the Strategy column, which shows the effective strategy label for each row. Open Positions and Closed Positions are Pro surfaces, reached with an active subscription or lifetime access.
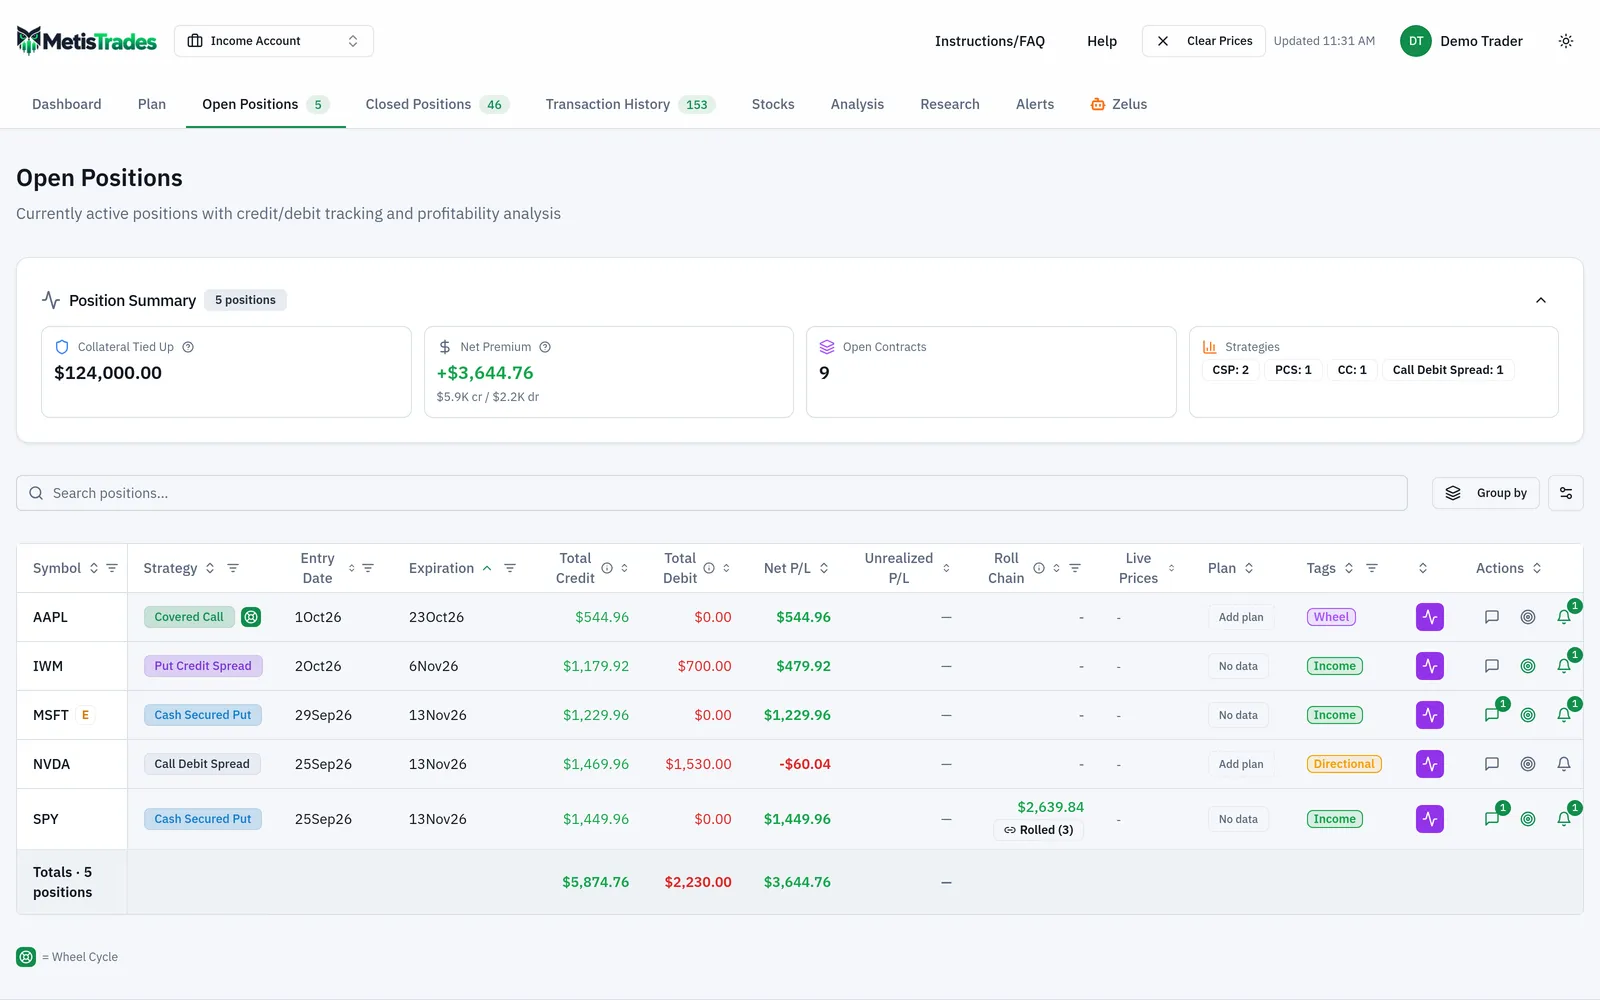
If a short put is showing some other label, reclassification is usually not the answer. The Strategy Reclassification dialog only converts Short Call to Covered Call and Long Put to Protective Put, so it will not touch a short put. A put that has been swept into a multi-leg label was probably grouped with legs you traded separately; use the position table's split control, then let the app classify the separated legs again. An overridden row carries an R badge beside its strategy, so you can always tell a correction from an automatic label.
Your $5,000 collateral figure has a home on the position. Open Positions and Closed Positions can show BP at Open, the positive dollar amount your broker required to open that specific position, and you set it on Position Details through Buying Power at Open: choose Set beside a missing value, type the amount and choose Save. You can click a displayed estimate to copy it into the input, but the saved value is whatever you enter, and only signed-in users can save it. Recording $5,000 against XYZ and $6,000 against ABC keeps the denominator of your hand calculation attached to the trade instead of living in your head.
For the portfolio-level version of the same ratio, the Dashboard has a Return on Buying Power card: monthly realized profit or loss divided by the month's capital base. Return on Buying Power Settings lets you choose % of cash at month start, Fixed dollar amount or Manual buying-power log. With the manual log you enter a date and a Buying power ($) value and choose Add; each month uses the average of its entries, and a month with no entry shows No log entry rather than treating buying power as zero. The log belongs to the selected account.
Then there is the outcome the whole trade is built around. If XYZ is assigned, the $5,000 becomes 100 shares and the option stops being an option. The screenshot below shows that hand-off on the Assignments tab: check the share quantity against the 100 shares per contract you expected, and compare the basis recorded there with the $48.50 effective price you worked out by hand.
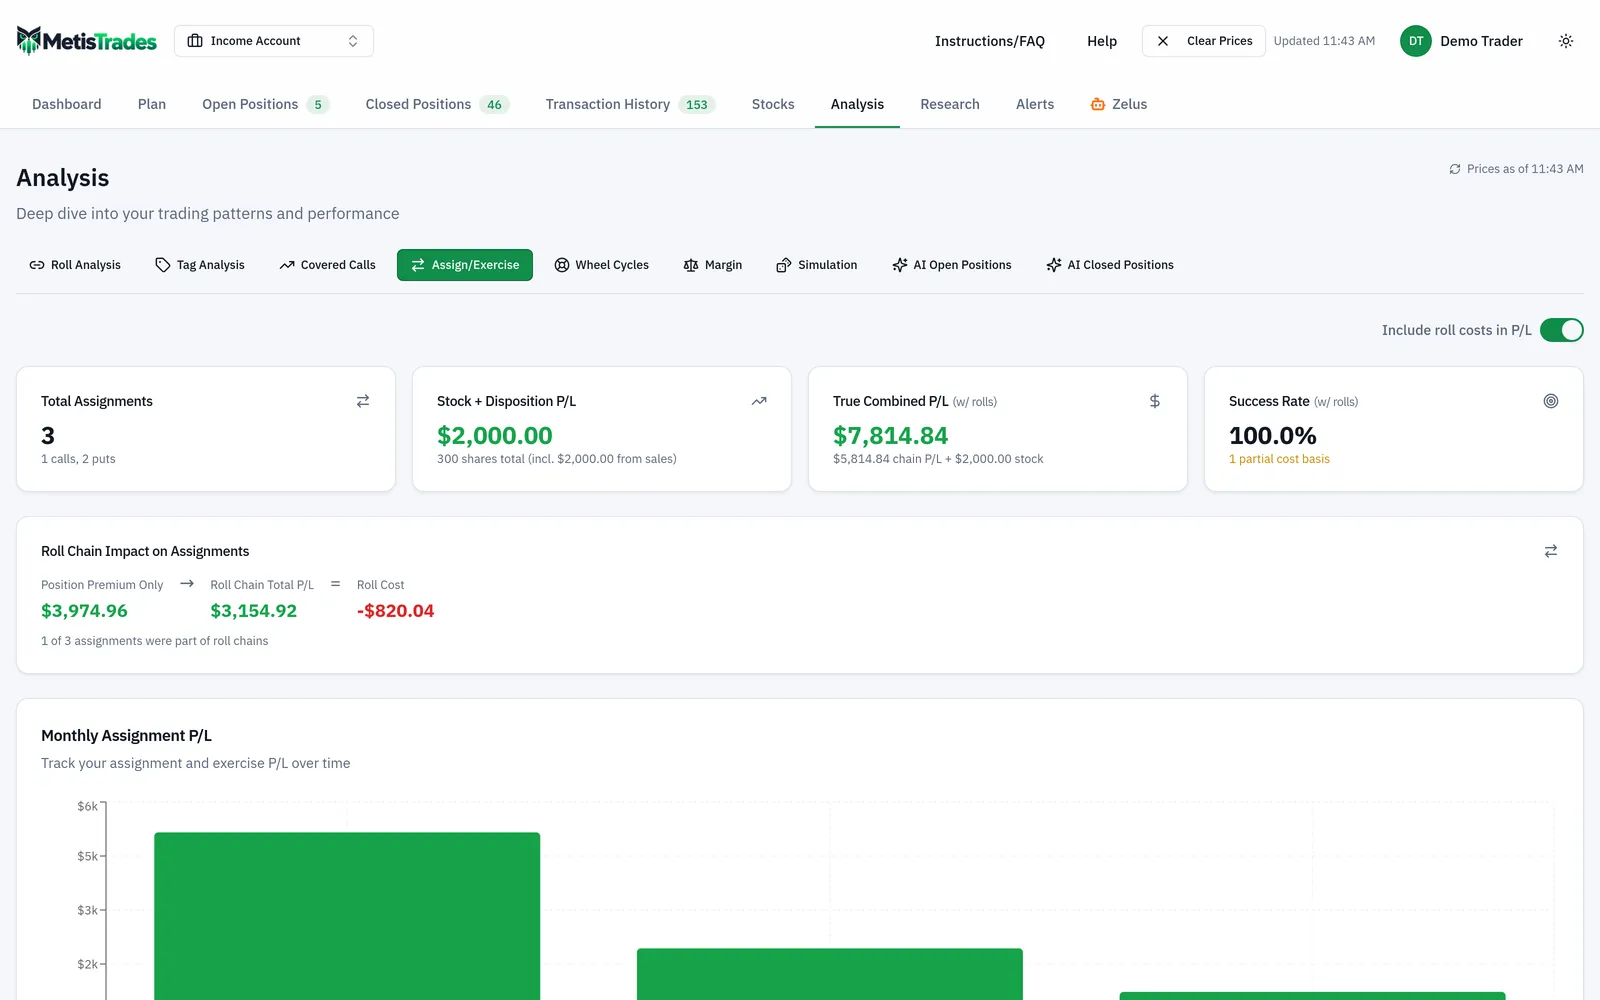
Assignment also has a cash consequence worth watching. An account is treated as On Margin only when its effective cash balance is negative, and margin debt is the positive magnitude of that negative balance. If buying the shares pushes cash below zero, the Analysis — Margin page shows Portfolio Value, Margin Debt, Current LTV, Safety Cushion and Margin Interest. Note how collateral is measured there: stock value plus positive cash, with open option positions excluded. A portfolio of unassigned cash-secured puts contributes nothing to that collateral figure. Margin analysis is not exposed in a public share.
One standing caveat across all of these screens: quotes in MetisTrades are delayed, and anything derived from imported transactions is an estimate. Figures priced from market quotes on an open short put can be stale or differ from a price you could actually trade at, and tax-related figures are estimates from your imported transactions, not a substitute for your broker's 1099-B.
Common mistakes
- Quoting the premium as the return. $150 is not "3% of the premium" or a return on nothing — it is 3.0000% of the $5,000 the trade locks up. Fix: always divide by collateral, strike × 100 × contracts.
- Treating the strike as your cost if assigned. You pay $50 but the net cost is $48.50 after the $1.50 premium, and that same $48.50 is your expiration breakeven. Fix: compute strike minus premium per share once, and write it down when you open the trade.
- Assuming the collateral caps the loss. Setting aside $5,000 does not protect you; it only means you can pay. The loss if the stock collapses is up to $4,850 on one contract. Fix: size the position by what you would accept owning, not by what you can afford to pledge.
- Annualizing a 32-day return and calling it a yield. The 34.2% figure assumes continuous repetition at the same premium with no assignment losses. Fix: use the annualized number to compare trades of different lengths, never to project income.
- Leaving fees out of every calculation. ABC's 2.6667% is 2.6450% after $1.30 of fees, and small premiums suffer most. Fix: record fees per trade and check the trading-fee total in Cash Summary against your own log.
- Assuming every contract is 100 shares. Mini options represent 10 shares, and classification uses each option's contract multiplier when deciding how much share coverage a position needs. Fix: confirm the multiplier before multiplying anything by 100.
- Trusting a strategy label built from incomplete data. Classification can only use the legs reconstructed from your imported history, so missing fills or wrongly grouped legs produce a wrong or Unknown label. Fix: import the full history, and split incorrectly combined positions rather than relabeling them.
Related guides and help pages
Related guides
- Covered Calls Explained: Premium, Capped Upside and Adjusted Cost
- Vertical spreads: defined-risk option trades
- Iron Condors, Straddles and Other Multi-Leg Positions
- How Strategies Get Their Names (And How to Correct Them)
- Understanding margin, cash and loan-to-value
- Calls and Puts: What an Option Contract Actually Is