Understanding margin, cash and loan-to-value
Margin debt is just a negative cash balance, and loan-to-value measures it against your collateral. Learn to reconstruct cash from your ledger, calculate LTV by hand, stress-test it against a market drop, and see how MetisTrades does the same work.

What it is and why it matters
Three numbers decide how much borrowing risk sits in a brokerage account: your cash balance, your margin debt, and your loan-to-value ratio. They sound like broker jargon. They are not complicated.
Cash balance is the net cash in the account. You can rebuild it yourself by adding up every transaction amount in your ledger: deposits, withdrawals, trade proceeds, premium collected, premium paid, dividends, interest, fees. Every row moves the number.
Margin debt is what happens when that balance goes below zero. If your cash balance is negative $30,000, you have borrowed $30,000 from the broker. There is no separate "loan" line to find. The negative cash is the loan. This is the single most useful idea in this guide, because it means you can tell whether you are borrowing just by looking at one number, and you never have to guess.
A related trap: a margin interest charge in your ledger from last March does not mean you are borrowing today. It means you borrowed then. Current margin status depends only on whether your cash balance is negative right now.
Loan-to-value (LTV) compares the debt with the collateral backing it. Collateral is the value of the stock you own plus any positive cash. Divide debt by collateral and you get a percentage. $30,000 of debt against $150,000 of stock is 20%.
Why LTV rather than the raw debt figure? Because $30,000 borrowed against $1,000,000 of stock and $30,000 borrowed against $60,000 of stock are completely different situations, and the dollar amount cannot tell them apart. LTV can.
The reason to track LTV rather than glance at it is that it moves on its own. Your debt stays put when the market falls; your collateral does not. A 20% decline in your holdings raises your LTV even if you place no trades at all. That is what the stress test in the next section is for — working out where your ratio lands after a drop, before the drop happens.
One warning before the arithmetic. The limits you set for yourself are not your broker's maintenance requirement, and nothing in this guide tells you where your broker would issue a margin call. Borrowing on margin can lose you more than you deposited. The point of tracking LTV is to know your own position well enough to act before someone else acts for you.
How to track it by hand
You need two inputs per account: the cash balance and the market value of the stock you own. Everything else is division.
Step 1: rebuild the cash balance
Export your transaction history from your broker and sum the amount column across every row. Not just the trades — every row. Deposits add, withdrawals subtract, a stock purchase subtracts, premium collected on a short put adds, dividends add, commissions and fees subtract. If you meet a transaction type you do not recognise, still include it; an unfamiliar row that you drop silently is the most common reason a hand-built cash figure comes out wrong.
If the total is positive, you are not borrowing. If it is negative, the magnitude of that negative number is your margin debt.
Step 2: price the stock
Count only shares you actually own, including shares transferred in from another broker, and multiply each holding by its latest available price. Do not count open option positions as collateral. Options can have value, but leaving them out keeps your ratio conservative, and a conservative ratio is the one you want when you are measuring borrowing risk.
Step 3: divide, then re-price for a drop
LTV is debt divided by stock value. Then pick a decline to test — 20% is a reasonable starting point — multiply the stock value by (1 minus the drop), and divide the same debt by the smaller collateral figure.
The spreadsheet below has one row per account snapshot, with the computed columns already carrying the formulas described here.
Download the template: Margin and LTV check (.xlsx). It opens in Excel, and in Google Sheets via File → Import. The worked example from this guide is already filled in, and the formulas carry down into the blank rows.
| Date | Account | Cash balance | Stock value | Drop to test | Margin debt | LTV | Stock value after drop | LTV after drop |
|---|---|---|---|---|---|---|---|---|
| 2026-02-27 | Margin account | -30,000 | 150,000 | 0.2 | 30,000 | 0.2 | 120,000 | 0.25 |
| 2026-02-27 | Cash account | 12,000 | 60,000 | 0.2 | 0 | 0 | 48,000 | 0 |
Walk the first row. The margin account's ledger sums to -30,000, so margin debt is the positive magnitude of that: 30,000. The formula is =IF(N(C{r})<0,-N(C{r}),0) — if cash is below zero, flip the sign; otherwise there is no debt at all. Stock value is 150,000, so LTV is 30,000 ÷ 150,000 = 0.2, or 20%.
Now the stress columns. The drop to test is 0.2. Stock value after drop is 150,000 × (1 − 0.2) = 120,000. The debt has not moved — a falling market does not repay your loan — so LTV after drop is 30,000 ÷ 120,000 = 0.25. A 20% market decline pushes this account from 20% to 25%.
Notice the asymmetry. The collateral fell by 20% but the ratio rose by 5 percentage points, a quarter of its starting level. The deeper the decline, the faster the ratio accelerates, because you are dividing a fixed number by a shrinking one.
The second row is the control case. Cash is +12,000, which is not below zero, so margin debt is 0 and LTV is 0. Stock value after the same 20% drop is 60,000 × 0.8 = 48,000, and LTV after drop stays at 0. The holdings lost 12,000 of value, which matters to your account balance, but it is not a borrowing problem. No debt, no ratio.
The totals at the foot of the sheet are total margin debt 30,000 and total stock value 210,000. Dividing those gives roughly 14.3% across both accounts, which is lower than the 20% sitting inside the margin account. That is not a mistake; it is the point. A portfolio-level ratio averages away a concentration of debt in one account. Keep the per-account rows and read them first.
One simplification to be aware of: this sheet divides debt by stock value alone. Positive cash is also collateral, so a fuller calculation would add it in. Here it makes no difference — the account with debt has no positive cash, and the account with positive cash has no debt — but if you ever hold both in the same account, add the positive cash to the denominator.
Where manual tracking breaks down
The arithmetic above takes about a minute. Getting the two inputs right is the hard part, and it fails in specific ways.
- A missed ledger row. Cash is the sum of every transaction. One omitted fee, one sweep you did not recognise, one internal transfer you skipped because it looked like noise, and the balance is wrong — which means the debt is wrong, which means the LTV is wrong.
- Unfamiliar transaction types. Brokers emit rows for return of capital, margin bookkeeping, manufactured dividends, stock-lending income and futures sweeps. If your approach is "include the ones I understand", your reconstruction drifts further from reality each month.
- Interest that is not labelled as margin interest. Some brokers use one generic interest type for both interest earned and interest paid. Adding all of it to a margin interest total overstates the cost; ignoring all of it understates it.
- Stale prices. Your collateral figure is only as current as the quotes you typed in. A sheet refreshed last month is stress-testing a portfolio that no longer exists.
- Holdings with no quote. If a symbol cannot be priced, you either leave it out — and understate collateral — or guess, and you will not remember next quarter which it was.
- Multiple accounts. Debt in one account and cash in another do not behave as a single pot. You need both the per-account rows and a combined view, and keeping the two consistent by hand is where most spreadsheets rot.
- No history. A snapshot cannot tell you whether your debt has been creeping up for eight months. Rebuilding a daily cash balance and pricing holdings at historical closes is not realistic by hand.
How MetisTrades does it
MetisTrades runs the same calculation from your imported transactions, with the ledger reconstruction, the pricing and the stress test done for you. Quotes are delayed, so treat every figure as an estimate rather than a live broker statement.
The Margin report
Go to Analysis → Margin, at /analysis/margin. The top cards are Portfolio Value (counted stock value plus positive cash), Margin Debt (the amount represented by a negative cash balance), Current LTV (margin debt as a percentage of portfolio value), and Safety Cushion (the estimated market decline that would put LTV at your hard limit). If your cash balance is not negative, the report says You're not on margin and shows the current cash balance instead; the stress test and projection still work, so you can model borrowing you have not done yet.
Below the snapshot the page carries the risk zones, the stress test, interest detection and the paydown tools described next — the whole report in one place.
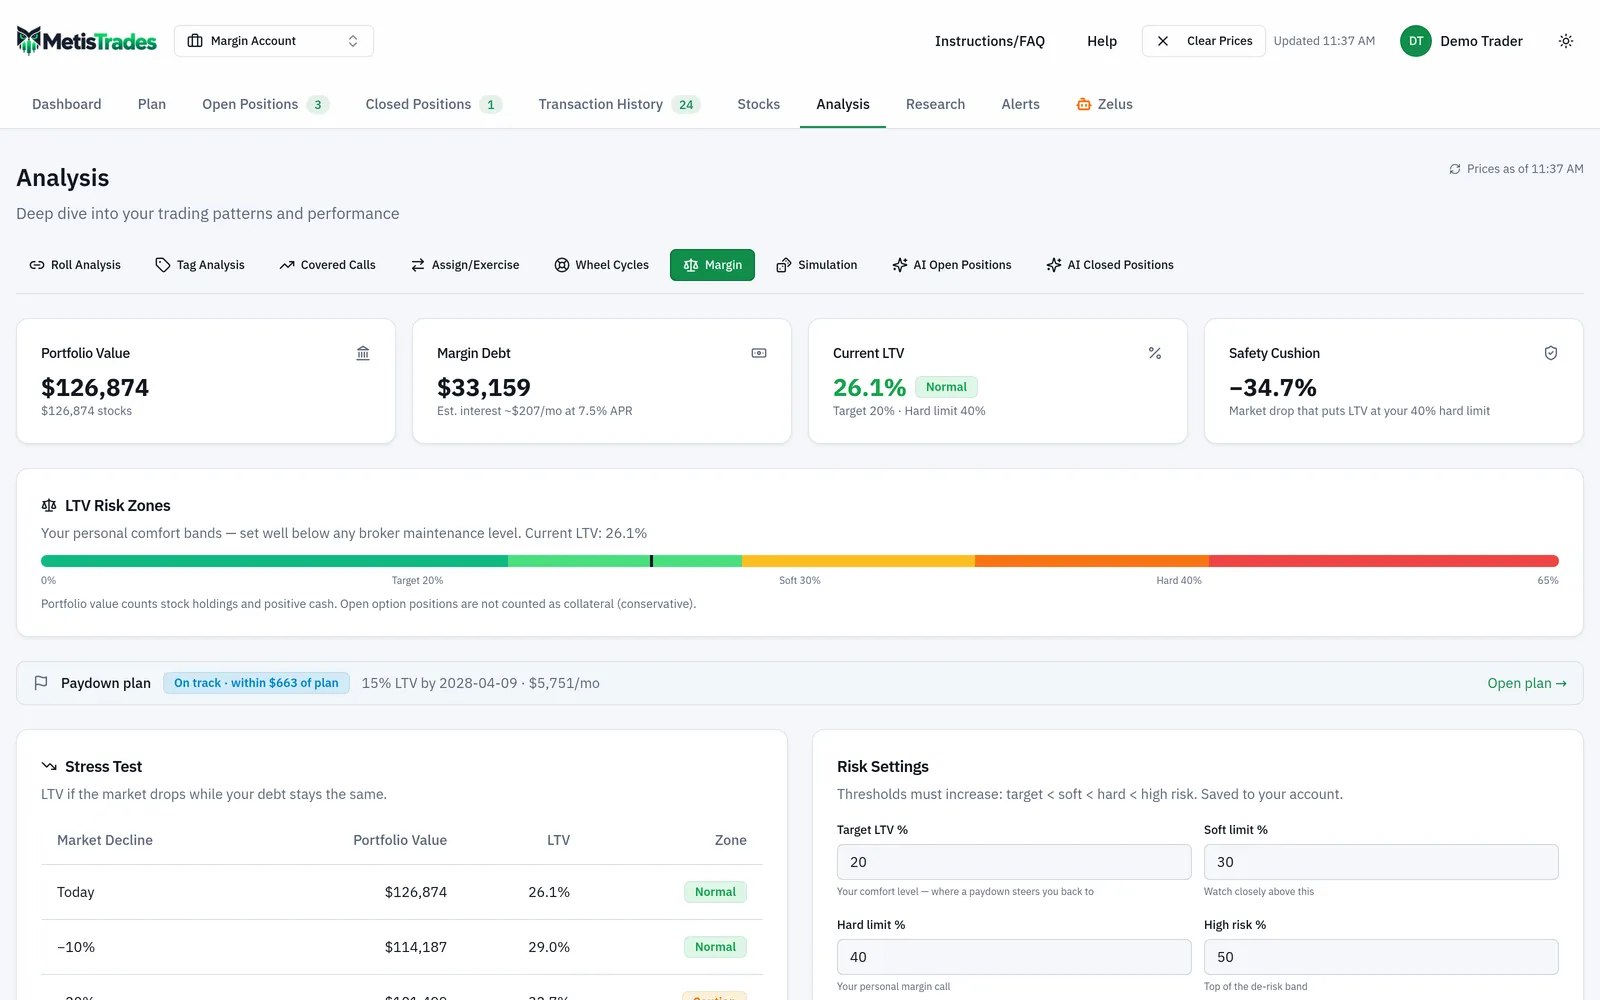
LTV Risk Zones places your Current LTV in your personal comfort bands. A new report starts with Target LTV 10%, Soft limit 15%, Hard limit 20%, High risk 25%, and Interest APR 6%. These must increase in that order. At or above your hard limit the page can show Personal margin call, with estimates of the outside cash or securities sales needed to return to your target. That banner is explicitly about your own limit, not a broker margin call — the report does not know your broker's maintenance requirements.
Stress Test is the worked example, automated. It shows Market Decline, Portfolio Value, LTV and Zone while debt stays unchanged — the same assumption you applied by hand when the 30,000 did not move. The reverse stress test estimates how far the market can fall before you reach your Soft limit, Hard limit and High risk level.
Margin Interest shows Total paid (all time) from explicit interest charges found in your imports, Est. current monthly based on current debt and your APR setting, and up to the last 12 months of detected charges. If none are found it says No explicit margin interest charges found in your imports. Generic interest rows are not added to the total, because they can also represent interest earned; when generic interest exists the report warns that the total may undercount.
The Paydown Calculator compares Pay down with outside cash against Sell securities to repay for a Target LTV you enter between 1% and 99%. That entry is a scratch figure for the calculation only — it is not saved and does not change the Target LTV in Risk Settings. When a securities sale can reach the target, What Should I Sell? appears with two auto-ranked scenarios plus Custom Selection, listing Symbol, Acquired, Shares to Sell or Shares, Cost Basis, Current Price, Est. Proceeds, Est. Gain / Loss and Term. The advisor is display-only and never places trades, and taxes on sales are not modelled.
Portfolio vs Margin Debt Over Time reconstructs daily cash and prices holdings with historical closes; Pro users can choose 1Y, 3Y or All, and LTV Over Time appears where debt existed. Borrow-to-Live Projection is a deterministic what-if, not a forecast, starting from Monthly spending $5,000, Annual return 8%, Dividend yield 1.5%, Spending inflation 3%, Annual repayment $0, 10 Years and Capitalized (compounds) interest.
Checking the cash figure
Because everything above depends on one number, it is worth seeing where it comes from. Transaction History shows Cash Summary, built as the sum of every transaction amount — not assembled from the category cards. It separates Total Deposits, Withdrawals, Trade Cash Flow, Dividends, Interest, Subscriptions/Margin Interest, Other Activity, and trading fees. An unfamiliar transaction type still changes the balance and lands in Other Activity, so it is not silently lost.
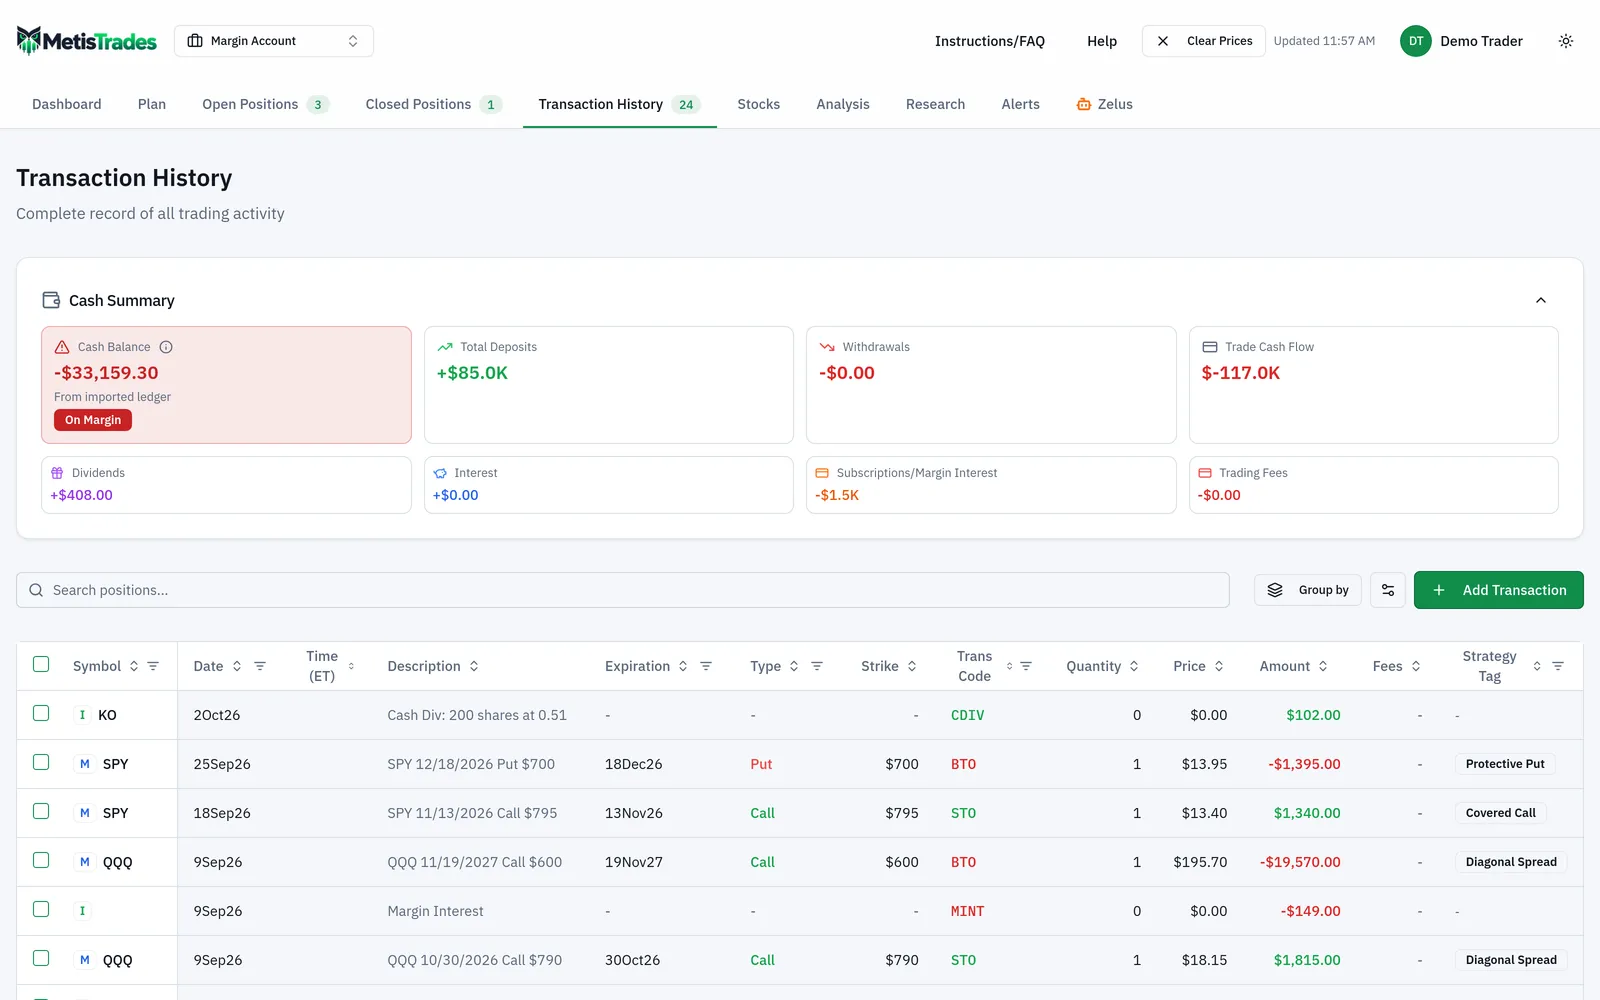
For a linked brokerage account, MetisTrades first requests the broker-reported cash balance and uses it instead of that account's reconstructed ledger figure. If a fresh request fails, a saved snapshot less than 24 hours old can still be used; an older one is rejected and the imported ledger is used. In All Accounts each account resolves separately, so a combined result can be labelled Broker + imported ledger. Margin history stays ledger-based even when today's headline uses a broker balance, which is why the chart and the snapshot can disagree.
Access
Anonymous visitors can use the Margin report after uploading a transaction file in the current browser session; nothing is saved, risk settings last for the visit only, and the history chart requires an account. Pro users get saved settings, account-specific views, All Accounts and margin history, and can choose Save settings and Save as defaults. Signed-in users without an active subscription cannot reach the Analysis tab. The Margin sub-tab is hidden from public share links.
How to read the results
Margin Debt means your effective cash balance is negative by that amount. It does not mean a broker has flagged anything. Equally, a zero here does not mean you have never borrowed — only that you are not borrowing now.
Portfolio Value on this page is counted stock value plus positive cash. It is deliberately narrower than your account's total worth. Open options are excluded even if your broker would give them some value, and symbols with no available delayed quote are excluded and named on the page. Both exclusions make the displayed LTV conservative: the denominator is smaller, so the ratio reads higher than a broker's equivalent might.
Current LTV is debt divided by that collateral. With no debt it is zero. Debt with no collateral has an undefined ratio and is treated as the highest-risk state rather than as zero — a detail worth knowing, because a nil denominator quietly becomes a zero in a hand-built sheet.
Safety Cushion is the estimated market decline that would raise your LTV to your personal hard limit. If your hand calculation showed 20% now and 25% after a 20% drop, and your hard limit is 20%, then your cushion is already gone. That is a fact about your own setting, not about your broker.
Zone in the stress test and the Per-Account Breakdown reflects your own thresholds. Change the thresholds and the zone changes without a single trade. Risk zones are personal limits, not broker maintenance or liquidation levels.
In All Accounts, Per-Account Breakdown shows Account, Portfolio Value, Cash, Margin Debt, LTV and Zone. Read it alongside the headline, because combined cash can offset debt held inside another account. In the worked example, the combined effective cash is −30,000 + 12,000 = −18,000, so a combined view shows 18,000 of debt while the margin account itself carries 30,000. Both are correct answers to different questions.
Est. current monthly interest is your APR setting applied to current debt and divided across months. It is an estimate from a number you typed, not a charge forecast from your broker.
Everything derived from imported transactions is an estimate. Missing rows, missing transfers, or absent quotes change the result. Figures involving lots and gains are estimates too, not tax advice and not a substitute for your broker's 1099-B.
Common mistakes
- Treating an old margin interest charge as proof you are borrowing today. Fix: check the sign of the current cash balance — that alone decides margin status.
- Counting open options as collateral. Fix: leave them out, as the Margin report does, and accept a conservative LTV rather than an optimistic one.
- Dropping unfamiliar ledger rows when summing cash. Fix: include every transaction amount; unknown types still move the balance and belong in Other Activity.
- Reading only the combined LTV in All Accounts. Fix: open Per-Account Breakdown, because positive cash in one account can mask debt concentrated in another.
- Assuming your debt shrinks in a sell-off. Fix: stress-test with the debt held constant — only the collateral falls, which is why the ratio accelerates.
- Mistaking your hard limit for a broker threshold. Fix: treat Personal margin call and the risk zones as your own comfort bands, and confirm your broker's actual maintenance requirement separately.
- Expecting a securities sale to work like a cash paydown. Fix: remember a sale repays debt and removes collateral at the same time, so it takes a larger amount to reach the same target LTV.
Related guides and help pages
Related guides
- Cash-Secured Puts Explained: Collateral, Effective Price and Where the Wheel Starts
- Planning a Margin Paydown: Setting a Destination LTV and Tracking Progress
- Planning your portfolio: a tour of the Plan tab
- Exit plans: deciding how you will leave a trade
- Setting and Tracking an Options Income Goal
- Planning retirement income from an options portfolio