Planning a Margin Paydown: Setting a Destination LTV and Tracking Progress
Learn how to turn a margin balance into a dated paydown plan: pick a destination loan-to-value, work out the monthly payment, and check each month whether you are ahead or behind. Includes a worked spreadsheet example.

What it is and why it matters
If your brokerage cash balance is negative, you are borrowing from your broker. That borrowed amount is your margin debt. The assets backing it are your collateral — in MetisTrades, priced stock holdings plus positive cash, with open option positions deliberately excluded. Divide one by the other and you get loan-to-value, or LTV: margin debt divided by collateral, expressed as a percentage.
LTV is the number that matters because it moves for two separate reasons. It rises when you borrow more or when interest is added to the balance. It also rises when the market falls, even if you never borrow another dollar, because the denominator shrinks. A $40,000 debt against $160,000 of stock is 25% LTV. The same debt against $120,000 of stock is 33%. You did nothing; the number got worse.
A margin paydown plan is the answer to that. It has three parts:
- A destination — either a target LTV you are comfortable carrying, or zero debt.
- A date — when you intend to be there.
- A monthly amount — the outside cash you need to pay each month to arrive on time.
Without those three, "I should pay down the margin" is a sentiment, not a plan. With them, every month produces a verdict: ahead, on track, or behind. That is the whole point of tracking it. You are not trying to predict the market; you are trying to know, on the last day of each month, whether the balance you actually have is the balance your plan said you would have.
One warning before the arithmetic. Interest works against you quietly. If you pay $2,000 and the broker charges $250 of interest, your debt only fell by $1,750. People who track payments instead of balances consistently overestimate their progress.
How to track it by hand
You need five inputs per month and four computed columns. Record the month end, the interest your broker charged, what you paid down, and the account's stock value. Enter the starting debt on the first row only — after that the sheet carries the balance forward.
The worked example below starts with $40,000 of margin debt against $160,000 of stock, with a destination LTV of 15% (entered as 0.15).
The four computed columns
- Debt after month = starting debt + all interest charged to date − all paid down to date.
- LTV = debt after month ÷ stock value.
- Debt at target LTV = stock value × target LTV. This is the debt your destination allows at this month's collateral value.
- Still to pay = debt after month − debt at target LTV, floored at zero.
| Month end | Starting debt | Interest charged | Paid down | Stock value | Target LTV | Debt after month | LTV | Debt at target LTV | Still to pay |
|---|---|---|---|---|---|---|---|---|---|
| 2026-01-31 | 40,000 | 250 | 2,000 | 160,000 | 0.15 | 38,250 | 0.239063 | 24,000 | 14,250 |
| 2026-02-28 | 238 | 2,000 | 152,000 | 0.15 | 36,488 | 0.240053 | 22,800 | 13,688 | |
| 2026-03-31 | 226 | 2,500 | 158,000 | 0.15 | 34,214 | 0.216544 | 23,700 | 10,514 |
Walking the rows
January. You start at $40,000. The broker charges $250 of interest and you send $2,000 of outside cash. Debt after the month is 40,000 + 250 − 2,000 = 38,250. Stock value is $160,000, so LTV is 38,250 ÷ 160,000 = 0.239063, or 23.91%. At a 15% destination, the debt allowed against $160,000 of collateral is 160,000 × 0.15 = 24,000. You are 38,250 − 24,000 = 14,250 above the line.
February. Interest falls to $238 because the balance is smaller. You pay another $2,000. The cumulative arithmetic is 40,000 + (250 + 238) − (2,000 + 2,000) = 36,488. Debt fell by $1,762 — not the $2,000 you paid. Now look at the LTV: 36,488 ÷ 152,000 = 0.240053, or 24.01%. It went up, from 23.91%, in a month when you paid down debt. The stock value dropped from $160,000 to $152,000 and the smaller denominator more than cancelled your payment. The allowed debt also fell, to 152,000 × 0.15 = 22,800, so "still to pay" only improved to 13,688.
March. Interest is $226, you pay $2,500, and the market recovers to $158,000. Debt is 40,000 + 714 − 6,500 = 34,214, LTV is 34,214 ÷ 158,000 = 0.216544 (21.65%), allowed debt is 23,700, and the gap closes to 10,514.
Two totals matter at the bottom of the sheet. Total interest paid = 714 and total paid down = 6,500. Over the quarter you sent $6,500 of outside cash and the balance fell by $5,786. The difference is the $714 the loan cost you. If you only tracked payments, you would think you were $714 further along than you are.
Notice also how the "still to pay" column behaves. It fell from 14,250 to 13,688 to 10,514 — not in even steps, because the finish line moves with your collateral. A destination expressed as an LTV percentage is a moving target by design. A margin-free destination (zero debt) is the only fixed one.
The spreadsheet below contains these three rows, the formulas and the totals, ready for you to extend.
Download the template: Margin paydown plan (.xlsx). It opens in Excel, and in Google Sheets via File → Import. The worked example from this guide is already filled in, and the formulas carry down into the blank rows.
The formulas are written so blank month-end cells produce blanks rather than errors, and so the LTV column stays empty if you have not yet filled in a stock value. Add a row per month, keep the starting-debt cell on the first row only, and the running balance takes care of itself.
Where manual tracking breaks down
The sheet above works until real account activity meets it. The failure modes are specific.
- Interest is hard to find. Some brokers post margin interest as a clearly labelled charge; others fold it into a generic interest line. If you miss a month's charge, your running balance drifts above your sheet and stays wrong forever, because every later row builds on it.
- Cash moves that are not "paydowns". Dividends land, option premium settles, you withdraw money for living expenses, a deposit clears. Each one changes the debt without appearing in your "Paid down" column. Within a few months your computed balance and the broker's balance no longer agree, and you cannot tell which transaction caused the gap.
- Collateral needs a price every month. The denominator is your stock value on the last day of the month. Pulling that figure by hand for a dozen holdings, on the right date, every month, is the step people quietly skip — and once skipped, the LTV column has a hole in it.
- Assignments and share movements. A put assignment buys shares with borrowed cash: debt up, collateral up. A call assignment sells them: debt down, collateral down. Both change LTV in ways a payment-only sheet never sees.
- Multiple accounts. If you have margin in one account and cash in another, a combined sheet hides the leverage and a per-account sheet doubles the work. Switching scope halfway through a plan makes the history meaningless.
- Corrections after the fact. A broker reverses a fee, a transfer is re-dated, a price was wrong. Fixing one old row means re-reading every row below it.
- There is no plan line. The sheet tells you where you are. It does not tell you where you were supposed to be this month, which is the question you actually want answered.
How MetisTrades does it
Start from the snapshot
Open Analysis → Margin first. It estimates your Portfolio Value (counted stock value plus positive cash), Margin Debt (the amount represented by a negative cash balance), Current LTV, and Safety Cushion — the estimated market decline that would push LTV to your hard limit. LTV Risk Zones grades your current LTV against your own comfort bands, which start at Target 10%, Soft limit 15%, Hard limit 20%, High risk 25%, with Interest APR 6%. Margin Interest shows total paid all time from explicit interest charges in your imports, an estimated current monthly figure, and up to the last 12 months of detected charges — the column your hand sheet keeps losing.
Note the scope rules. Open option positions are not counted as collateral, and symbols that cannot be priced are excluded and named on the page. The current snapshot can use broker-reported cash when that is available; the historical chart is reconstructed from the imported ledger.
Create the plan
Go to Plan → Margin (top nav → Plan → Margin). This page requires a signed-in account with an active subscription or lifetime access; anonymous visitors see Sign In Required. You can also reach it from the paydown-plan strip on Analysis → Margin via Set a goal → or Open plan →.
Before a plan exists, Set a paydown goal summarizes your current margin debt, collateral and LTV for the selected account or All Accounts view. The start button combines your saved comfort target with a 12-month date — for example, Start a plan to 10% LTV in 12 months. That percentage is only the starting suggestion. Once the plan exists it becomes the plan's own Destination LTV %, and later changes to your comfort target do not move it. If you have no margin debt, the page says You're not on margin and offers Open margin analysis →.
Under Paydown goal you choose a Destination — Target LTV or Margin-free (zero debt) — set Destination LTV % between 0.5% and 90% (unavailable for a margin-free plan), and pick a Target date after the plan start. There is no Save button: valid changes save as you make them.
Read the plan summary and the chart
The four summary cards replace the arithmetic you did by hand. The screen below is where the monthly figure, the destination and the running verdict live.
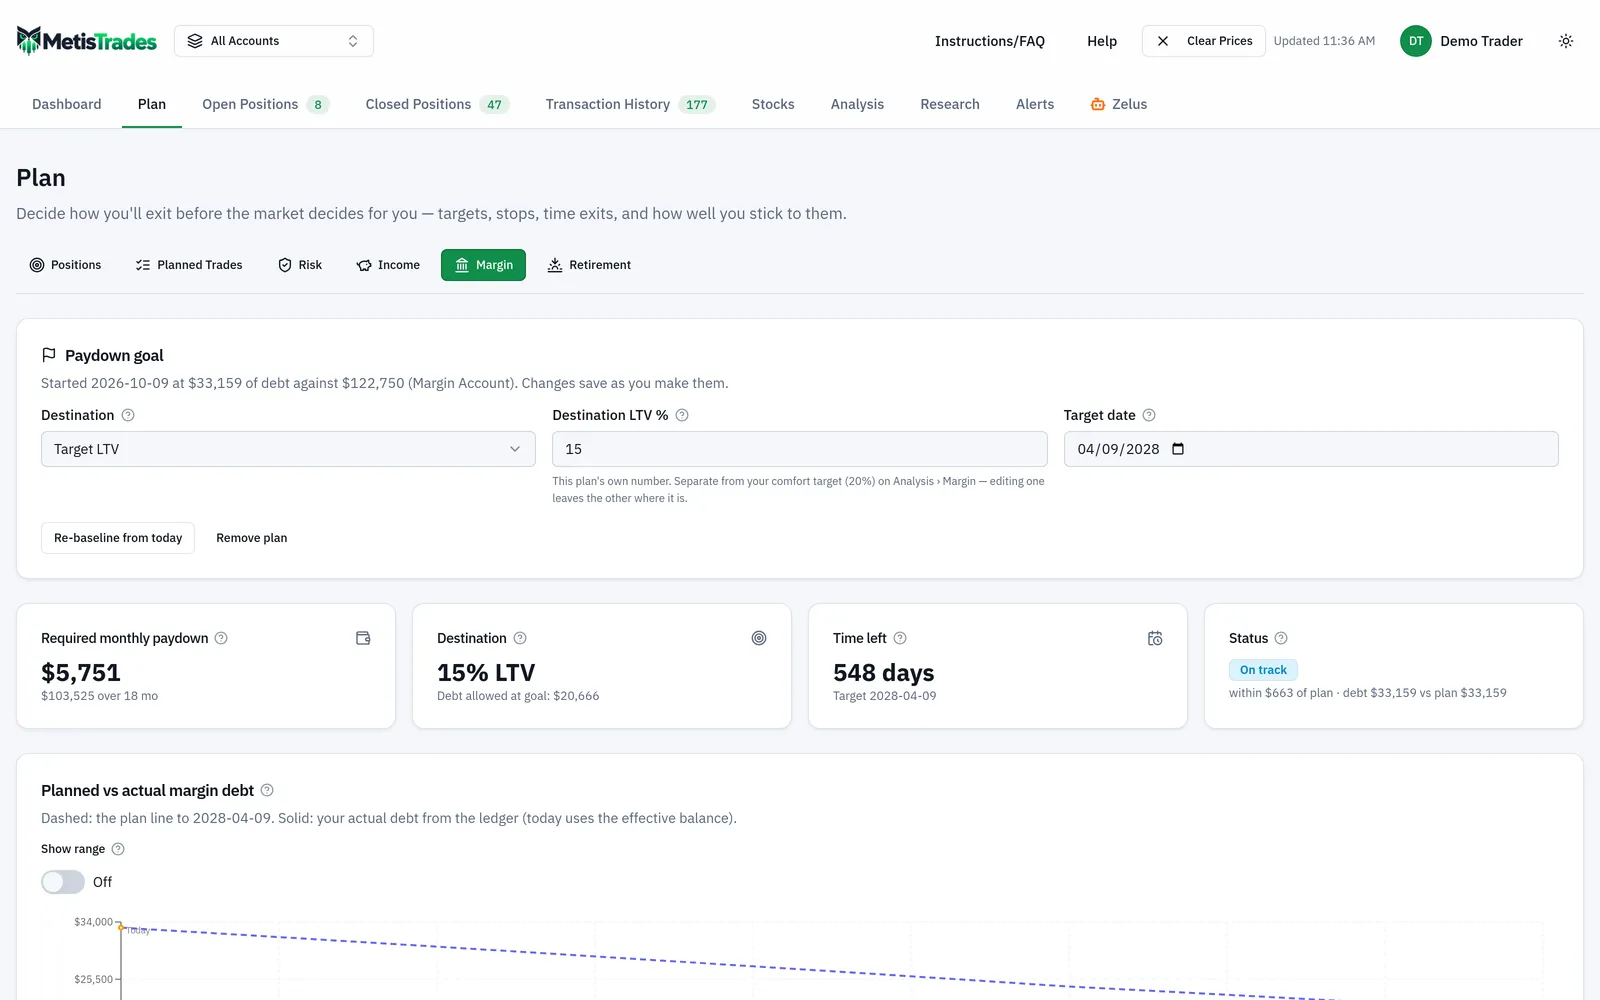
Required monthly paydown is the monthly outside-cash amount needed to meet the goal, with the total planned paydown and the plan length. If your saved assumptions reach the goal without payments it says Assumptions alone reach the goal; if the schedule cannot work it says Not reachable and Push the date out or lower the bar. Destination shows Margin-free or the chosen LTV plus Debt allowed at goal — the same idea as your "Debt at target LTV" column. Time left shows days remaining and the target date. Status shows the verdict, your current actual debt, and planned debt for today.
Planned vs actual margin debt charts four series: Plan (the dashed planned path), Debt allowed at target LTV (shown for Target LTV plans only, moving as projected collateral changes), Actual (debt history reconstructed from the ledger with today's effective balance added), and a Today reference line.
The plan uses the same borrow-to-live assumptions as Analysis → Margin: Monthly spending $, Annual return %, Dividend yield %, Spending inflation %, Interest APR % and Interest handling (Capitalized, which compounds, or Paid with outside cash). Use Change assumptions to edit them on Analysis → Margin.
Optional: a range around the plan
The Show range switch above the chart is Off by default. Turned on, it adds a shaded 10th-to-90th-percentile band behind the Plan line with a thin Median line, a Return volatility / yr field (initially 16%, allowed 0–80%), an estimates badge, and a payoff-date summary under the chart. Portfolio return and dividend yield vary across paths; spending, inflation, interest APR, interest handling and the monthly paydown do not. The switch is disabled when the goal is not reachable by the target date, or when the plan is longer than 40 years. Ranges are estimates, not predictions.
How to read the results
The Status card compares your actual debt with the planned debt for today, not with your starting balance. The labels are Ahead of plan, On track, Behind plan, Goal reached, and Goal date passed. The tolerance band around the plan line is 2% of the debt recorded when the plan started, with a minimum of $50. So in a plan anchored at $40,000, anything within $800 of the planned figure reads as On track.
This is why you can make a payment and still be Behind plan. In the February row above, $2,000 went out and LTV still rose from 23.91% to 24.01%. Spending, interest, dividends, returns and the timing of your payment all feed the comparison.
For the leverage picture behind the plan — zones, stress tests, detected interest and a one-time paydown comparison — the Analysis tab is the place to look.
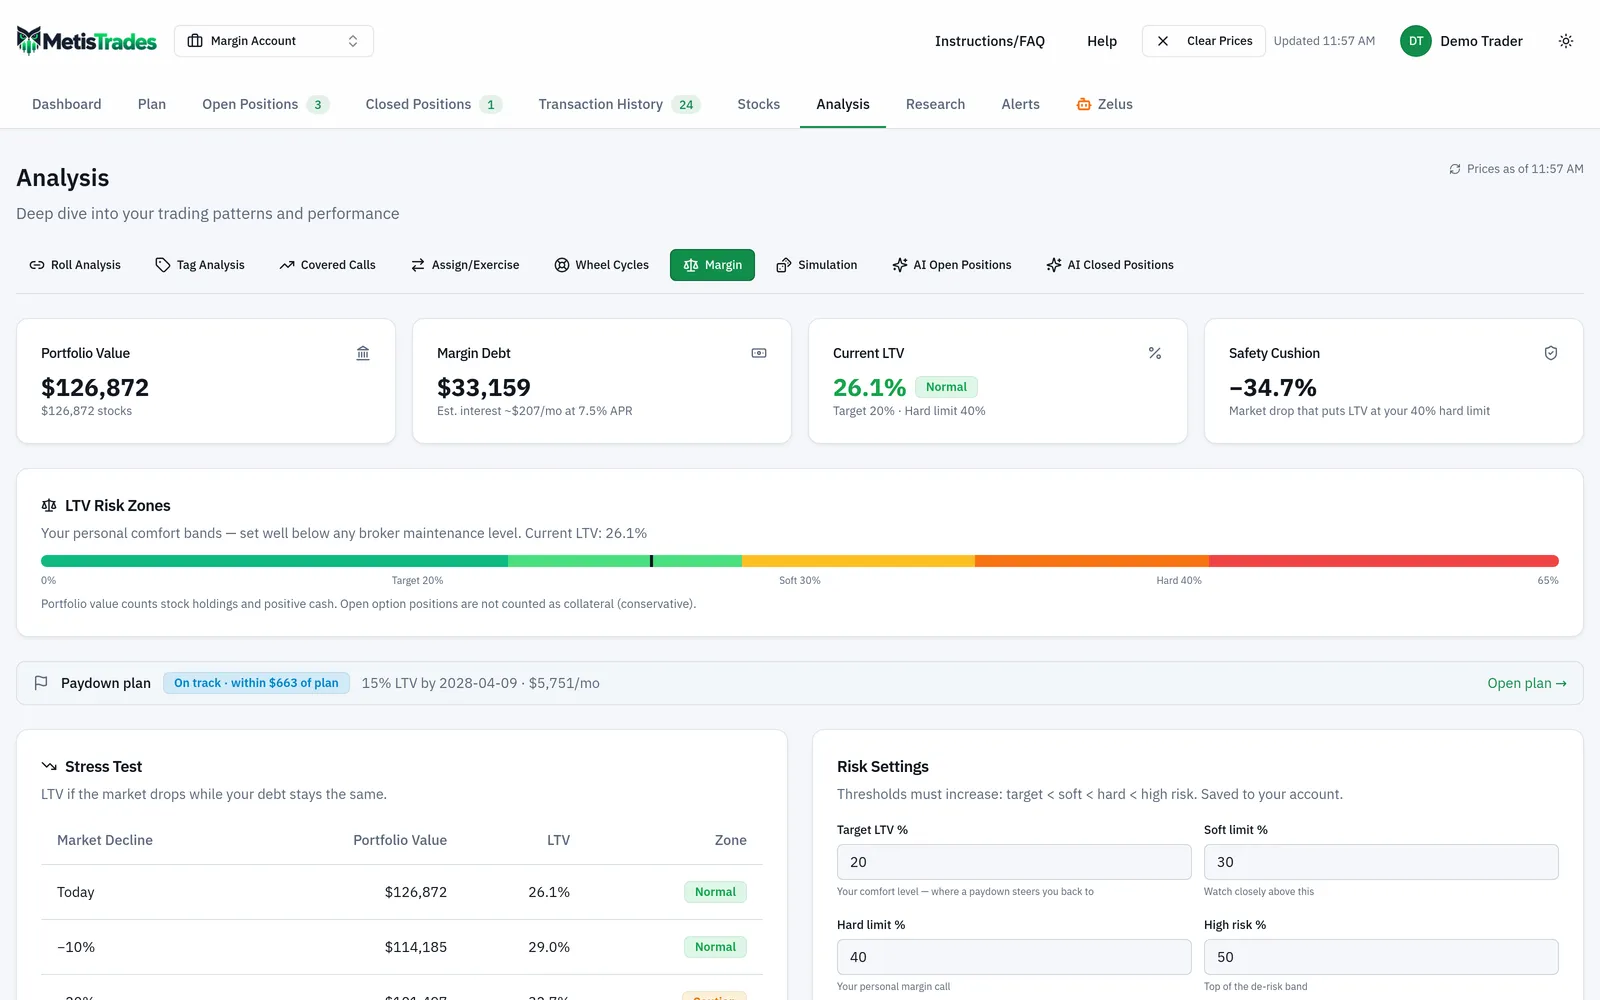
A few boundaries on what these numbers mean. Debt allowed at goal for a Target LTV plan is the destination LTV multiplied by projected collateral on the target date, so it is an estimate that moves; for a margin-free plan it is simply zero. Safety Cushion on Analysis → Margin is measured against your own hard limit, not your broker's maintenance requirement, and a Personal margin call banner means your self-imposed hard limit was reached — not that your broker issued anything. The Paydown Calculator on that page takes a scratch Target LTV % between 1% and 99% that is not saved and does not change Risk Settings; its sale estimate is larger than its cash estimate for the same target because selling also reduces collateral.
The plan calculates an outside-cash schedule. It does not move money, repay your broker, sell securities or place trades. Figures derived from imported transactions are estimates — incomplete imports, transfers, missing prices and account assignment can change them — and quotes are delayed, so unpriced holdings reduce counted collateral.
If you use Zelus, it can read this section: you can ask whether you are ahead of, on, or behind the plan, what the required monthly paydown is, or what interest is projected. It measures against the account scope the plan was anchored to, and it cannot create or change the plan.
Common mistakes
- Confusing Destination LTV % with Target LTV %. The first belongs to the paydown plan and is where the schedule is heading; the second, in Risk Settings on Analysis → Margin, is your comfort level that grades the risk zones. Fix: edit each where it lives and expect the other to stay put.
- Tracking payments instead of balances. In the example, $6,500 paid produced only a $5,786 fall in debt because $714 of interest went the other way. Fix: always compute the closing balance as starting debt + interest − payments.
- Assuming a falling debt means a falling LTV. February's LTV rose to 24.01% on a smaller debt because collateral dropped to $152,000. Fix: record the stock value every month and read LTV, not debt, as your progress measure.
- Re-baselining whenever you fall behind. Re-baseline from today restarts the plan line from today's debt and collateral, so earlier slippage stops affecting the comparison. Fix: use it only when you genuinely intend to restart progress measurement.
- Expecting the chart to follow the account picker. The comparison stays tied to the account or All Accounts scope saved when the plan was created or last re-baselined. Fix: create the plan in the scope you actually want measured.
- Counting option positions as collateral. Open options are excluded from collateral on purpose, which makes LTV read higher than a broker figure that includes them. Fix: compare like with like before concluding the page is wrong.
- Reading the Show range band as a forecast. The required paydown is solved to land exactly on the goal under the assumed return, so roughly half the simulated paths finish late by construction. Fix: read the 90% month to see how late the slow half runs, and treat the band as an estimate.
Related guides and help pages
Related guides
- Understanding margin, cash and loan-to-value
- Monte Carlo simulation: what it is and where MetisTrades uses it
- Plan, Track, Optimize: a complete tour of MetisTrades
- Planning Your Portfolio: A Tour of the Plan Tab
- Exit plans: deciding how you will leave a trade
- Setting and Tracking an Options Income Goal