Setting and Tracking an Options Income Goal
How to define a monthly premium goal, measure net option premium, dividends and interest against it, and work out what would close the gap. Includes a spreadsheet method and how Plan → Income does the same job.

What it is and why it matters
An income goal is a dollar amount you want your portfolio to produce over a stated period — usually a month, sometimes a year. It is a measuring stick, not a prediction. Without one, "I had a decent month" is a feeling. With one, it is a number you can check.
Three portfolio sources are normally counted toward it:
- Option premium — the net option cash from your trades: credits received for selling options, minus debits paid to buy options or to close short positions. This is net, not gross. A month in which you collect $2,100 of credits and pay $450 to buy positions back is a $1,650 net premium month.
- Dividends — cash paid to you by companies whose shares you hold.
- Interest — interest credited on cash balances.
The reason to insist on net premium is that gross credits flatter every record. Rolling a short option produces a debit and a credit on the same day; buying a protective put is a debit with no offsetting credit at all. If you only add up what you sold, your log drifts further from your account statement every month.
Two more definitions you will need. Net premium = premium received − premium paid. Gap to goal = goal − total income, where a negative gap means you came in above the goal. Both are arithmetic, not opinion, and both are easy to get wrong if you record trades inconsistently.
A caution worth stating once: selling options to pursue an income number changes how you trade, usually toward more contracts, closer strikes or shorter expirations. Those choices carry real risk of loss, and a goal does not reduce it. Tracking tells you where you stand; it does not tell you what to trade.
How to track it by hand
The manual method is one row per month and four computed columns. Keep the raw inputs — premium received, premium paid, dividends, interest — as numbers you copy from your broker's activity, and let everything else be a formula.
Enter premium paid as a positive number. The formula subtracts it. If you enter it as a negative, the subtraction turns it into an addition and your month looks twice as good as it was.
Here are three months from the worked example, with a monthly goal of $2,500.
| Month | Premium received | Premium paid | Dividends | Interest | Monthly goal | Net premium | Total income | Gap to goal | % of goal |
|---|---|---|---|---|---|---|---|---|---|
| 2026-01-01 | 2100 | 450 | 380 | 40 | 2500 | 1650 | 2070 | 430 | 82.8% |
| 2026-02-01 | 1850 | 900 | 120 | 35 | 2500 | 950 | 1105 | 1395 | 44.2% |
| 2026-03-01 | 2600 | 300 | 410 | 45 | 2500 | 2300 | 2755 | -255 | 110.2% |
| Totals | 7500 | 5930 |
Walking the arithmetic
January. Net premium is 2100 − 450 = 1650. Total income adds the other two sources: 1650 + 380 + 40 = 2070. The gap is 2500 − 2070 = 430, so you finished $430 short. As a proportion, 2070 ÷ 2500 = 0.828, or 82.8% of the goal.
February. Credits fell and buy-backs rose: 1850 − 900 = 950 of net premium. A light dividend month adds only 120, plus 35 of interest, for 1105 total. The gap is 2500 − 1105 = 1395 and the month landed at 1105 ÷ 2500 = 44.2%. Note that gross credits of 1850 were not far off January's 2100 — the damage was done by the 900 paid out, which a gross-premium log would have hidden.
March. 2600 − 300 = 2300 net premium, plus 410 and 45, is 2755 total. The gap is 2500 − 2755 = −255. The negative sign is the point: you beat the goal by $255, and the month came to 110.2% of target.
The quarter. Total income across the three months is 2070 + 1105 + 2755 = 5930 against a total goal of 7500, so you are 1570 behind over the quarter. The average monthly income is 5930 ÷ 3 = 1976.67. Compare that with the 2500 goal and your average monthly shortfall is 523.33.
The spreadsheet below contains these rows and the formulas that produce them.
Download the template: Income goal tracker (.xlsx). It opens in Excel, and in Google Sheets via File → Import. The worked example from this guide is already filled in, and the formulas carry down into the blank rows.
Turning the gap into something actionable
A gap of 523.33 per month is only useful once you convert it into the unit of whichever source you intend to lean on. Each of these is an alternative, not a shopping list to add together.
Premium. Your average net premium over the quarter is (1650 + 950 + 2300) ÷ 3 = 4900 ÷ 3 = 1633.33 per month. Covering the whole 523.33 gap from premium alone means 523.33 ÷ 1633.33 = 0.320, roughly 32% more net premium per month than you have been producing. That is a demanding number, and seeing it stated as a percentage is the useful part: it tells you whether the goal is a small adjustment or a different way of trading.
Dividends. Your dividends averaged (380 + 120 + 410) ÷ 3 = 303.33 per month. Covering the gap with dividends instead means an extra 523.33 × 12 = 6280 per year. At an assumed 3% annual yield, that implies 6280 ÷ 0.03 = 209,333 of additional dividend-paying capital. Again, the value is in the size of the answer.
Interest. Interest is averaging 40 per month and moves with cash balances and rates, so it is rarely the lever that closes a gap of this size.
Do this once a month, on the same day, from the same broker report. Twelve rows a year is not much work. Keeping them honest is the work.
Where manual tracking breaks down
The spreadsheet is correct for as long as the inputs are. Here is where they stop being correct.
- Missed rows. One expiring short put that you never recorded because nothing happened on expiration day. One assignment fee. One month skipped during a holiday. Each one quietly shifts your average and therefore your gap calculation.
- Partial fills. A five-contract order that fills as two and three, at different prices, arrives as two rows. Copy one and you have understated premium received; copy a quantity of five against a single price and you have overstated it.
- Rolls. A roll is a debit and a credit in the same session. Record only the credit and February's $900 of premium paid vanishes, making a 44.2% month look like a good one.
- Assignments. Assignment produces a stock transaction, not a premium transaction. It does not belong in the premium columns at all, but it changes your share count, and therefore next quarter's dividends — which do belong.
- Multiple accounts. A goal set for "the portfolio" but measured from one broker export is measuring something else. Combining exports by hand means reconciling different column layouts, date formats and fee conventions.
- Corrections. Brokers restate things: a trade is busted, a dividend is reclassified, a fee is refunded. Your January row was right when you wrote it and wrong a month later, and nothing tells you that it changed.
- Fees and commissions. Some brokers net fees into the transaction amount, some report them separately. Subtract them when they are already included and you double-count the cost.
- Dividend timing. Ex-dates, pay dates and reinvested dividends all land in different places. Deciding which month a dividend belongs to is a judgement call you have to make the same way every time, or your monthly comparisons drift.
None of these is hard individually. Together, over a year, they are the reason a hand-kept income log and a broker statement rarely agree.
How MetisTrades does it
MetisTrades does the same measurement from your imported transactions, on the Plan → Income page at /plan/income. The full page is Pro-gated: you need a signed-in account with an active subscription or lifetime access. Anonymous visitors can open Plan but see Sign In Required instead of the Income section.
Set the goal
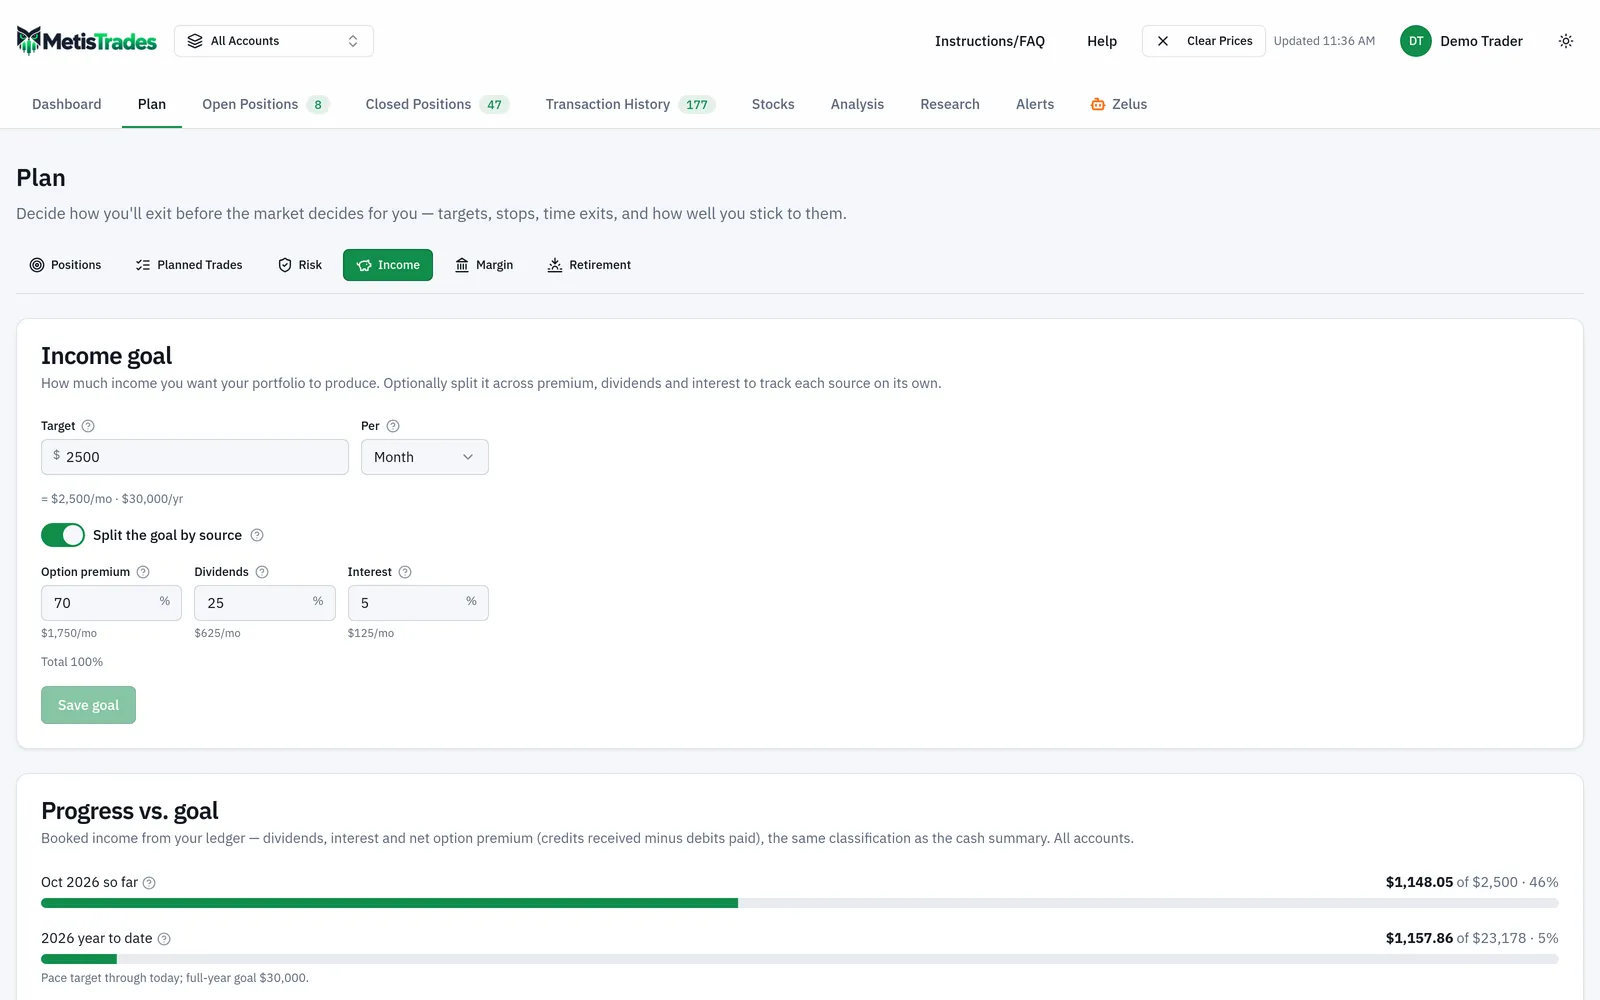
The Income goal card holds Target (the dollar amount) and Per (Month or Year). Our worked example is a target of 2,500 per Month; when the target is above zero the card also shows the monthly and yearly equivalents, so a yearly goal and a monthly goal are directly comparable.
Optionally turn on Split the goal by source to divide the target among Option premium, Dividends and Interest. The three percentages must add to 100%; the line below shows Total [percentage]% and adds — must add up to 100% when they do not. Select Save goal to keep a valid change — Unsaved changes appears after you edit a saved value, and a successful save reports Income goal saved.
The screen below is the Income page with a goal in place. Look at the goal card at the top, then the progress section and the projected months beneath it.
Progress vs. goal
Progress vs. goal is the equivalent of your gap columns. It shows the current month so far with the booked total, the monthly target, the percentage and a progress bar; the calendar year to date measured against the goal's pace through today; the full-year goal below the year-to-date bar; and separate Option premium, Dividends and Interest cards with this month's amount and the year-to-date amount. With the source split on, each card also shows its own monthly target.
If you have not set a positive target, the card says Set a target above to measure against. Your income so far is shown below either way. — the booked source totals are still there to review.
Where year-to-date costs exist, the page shows Commissions & fees recorded this year. They are displayed for context and are not subtracted from income, because your broker may already have included them in the transaction amounts. That is the double-counting trap from the previous section, handled by not subtracting twice.
The selected trading account controls the income shown. In All Accounts mode the description ends with All accounts., so you can tell at a glance which scope you are reading.
Next 12 months
The Next 12 months card carries an estimates badge and shows a Projected 12-month total, your Goal as a yearly amount, and monthly Premium run-rate, Dividends and Interest figures. The stacked bars use these series: Booked this month, Dividends — confirmed, Dividends — estimated, Premium — run-rate, Interest — run-rate and Goal. Solid bars are booked income or confirmed dividends; dashed, lighter bars are estimates.
The first bar starts from income already booked in the current month, with premium and interest estimates covering only the rest of that month. Later months carry premium and interest forward at the average of up to the last three completed months — the same three-month average you computed by hand, except that the current partial month is excluded from it.
Closing the gap
Closing the gap appears only after you set a positive goal. It compares the current monthly run rate with the monthly goal and says whether you have a gap or are on target, then breaks the result down by source. The Option premium line shows your recent monthly average and can express the shortfall as dollars per month and as a percentage above that average. The Dividends line shows the current monthly amount and, when a forward yield is available, estimates how much more dividend-paying capital would be needed to cover that source's gap at the current yield — that yield is derived from the latest available prices and projected dividend rates of priced dividend-paying holdings, not from your transaction ledger. The Interest line shows the current monthly amount and any monthly shortfall.
With a source split, each line compares that source with its own target. Without a split, each line shows what closing the whole gap with that one source alone would take — alternatives, not amounts to add together. The page states plainly that these are planning implications, not instructions to buy, sell, or pursue a particular yield or premium level.
Multi-year outlook and Dashboard widget
The Multi-year outlook card carries a projection badge and extends the picture over 5, 10, 15, 20 or 30 years, with assumptions for Monthly contribution, Dividend growth / yr, Premium growth / yr and Reinvest dividends (DRIP). A Show range switch, off by default, adds a shaded 10th to 90th percentile band with a dashed Median line and a Market volatility / yr field (initially 16%, allowed 0–80%).
On the Customizable dashboard, the widget catalogue lists Income goal progress under Capital & costs; the tile is titled Income goal. It shows current-month and Year to date (pace) progress using the same booked income, target, percentages and account scope as the page, plus Run-rate gap [amount]/mo (estimate). or Run-rate is at or above the goal. The widget is current and does not follow the Dashboard's selected time period. Select Open income plan → to go back to the full page.
How to read the results
Booked income is income classified from imported ledger transactions as option premium, dividends or interest. Like every figure derived from imported transactions, it is an estimate: missing, duplicated, transferred, future-dated or misclassified broker rows change it.
Option premium on this page is signed net option cash — credits received minus debits paid — not gross premium sold. That is why it can be negative in a month where you paid more to close than you collected, exactly as your February row shrank to 950. Booked actuals preserve a negative figure, but the 12-month projection and the gap analysis treat a negative recent premium or interest run rate as zero rather than projecting losses forward.
Year-to-date progress is measured against a pace target: the share of the full-year goal corresponding to the portion of the calendar year elapsed through today. That is why the year-to-date target is smaller than your yearly goal, and the same row states the full-year goal so you can see both.
Recent run rate is the average monthly premium or interest from up to the last three completed ledger months, with the current partial month excluded. If your hand-kept average includes a half-finished month, it will not match.
Gap is the monthly goal minus the combined non-negative dividend, premium and interest run rates, with no gap shown below zero. It describes your recent rate of production, not a promise about next month.
What these numbers do not mean: a 110.2% month does not mean the goal is reached on average — over the quarter you were still 1570 behind. The estimates and projection badges mark figures that depend on assumptions, and the Show range band is a simulation with fixed simplifications, not a forecast. Quotes are delayed, so forward yield and dividend capital use the latest available prices, not executable ones. The dividend forecast is built from each holding's payment history rather than an announced-dividend feed, so timing and cadence can differ from what a company actually pays.
Common mistakes
- Counting gross credits instead of net premium. A $2,100 credit month with $450 of buy-backs is a $1,650 month. Fix: always subtract premium paid, entered as a positive number.
- Entering premium paid as a negative. The formula subtracts it, so a negative becomes an addition. Fix: check that any month with buy-backs shows net premium below premium received.
- Judging the year by one strong month. March hit 110.2% while the quarter was still 1570 short. Fix: read the average monthly figure (1976.67) and the year-to-date pace, not the latest bar.
- Comparing a partial month with a full-month goal. Mid-month, the current month is always behind. Fix: use the current-month progress bar for the month in progress and the run rate for comparisons.
- Adding the "closing the gap" lines together. Without a source split, each line shows what covering the whole gap with that source alone would take. Fix: pick one, or turn on the source split so each line is measured against its own target.
- Measuring the wrong account. A portfolio-wide goal checked against a single account understates income. Fix: confirm the account selector, and look for All accounts. at the end of the description when you want everything.
- Subtracting commissions twice. Many brokers already net fees into transaction amounts. Fix: treat Commissions & fees recorded this year as context, and do not deduct it again in your own sheet.
- Treating a projection as a plan. Run rates assume recent completed months continue. Fix: re-check the gap each month, and let a change in trading show up in the numbers before you rely on it.
Related guides and help pages
Related guides
- Monte Carlo simulation: what it is and where MetisTrades uses it
- Plan, Track, Optimize: a complete tour of MetisTrades
- How much capital does $1,000 a month in options income take?
- Planning Your Portfolio: A Tour of the Plan Tab
- Exit plans: deciding how you will leave a trade
- Planning a Margin Paydown: Setting a Destination LTV and Tracking Progress