Planning retirement income from an options portfolio
How to project withdrawals, dividends, other income and option premium year by year, check whether income covers spending, and read a range of outcomes instead of a single line.

What it is and why it matters
Retirement planning for an options portfolio asks one question in two parts: does the income your portfolio produces cover what you want to spend, and if it does not, how long does the capital last while you cover the difference?
The income side usually has three or four components. Dividends are payments companies make to shareholders. Option premium is the money you collect net of what you pay — credits received minus option debits paid, which is what matters when you roll and buy back positions rather than letting everything expire. Interest is what cash earns. Other retirement income is everything from outside the portfolio: Social Security, a pension, rent, part-time work.
The spending side is a number you choose. The gap between the two is the part people underestimate. If you spend $54,000 a year and your portfolio throws off $36,000, you are not "living off premium" — you are drawing $18,000 a year from capital, and that capital is also the thing producing the $36,000. Every dollar you sell is a dollar that stops paying dividends and stops supporting cash-secured puts.
Two more ideas matter before you can plan sensibly.
Today's dollars. It is far easier to write down "$4,500 a month" in money you understand today than to guess at the nominal figure twenty years out. The honest version of that shortcut is to keep every input in today's dollars and apply an inflation rate separately when you project forward. The sketch below skips inflation on purpose, which is part of why it is a sketch.
A single line is not a plan. Any projection that assumes 6% a year, every year, tells you what happens on one path the market will never actually take. Options premium in particular is lumpy: a quiet quarter, an assignment, a month you did not trade. A single-line projection that is funded by a small margin is a plan that fails whenever reality runs slightly below average. Reading a range of outcomes — what share of plausible paths stay funded, and how early the failures run out — is a different and more useful question.
Nothing here is a forecast. Projections depend entirely on the assumptions you feed them, and options carry risk including assignment and loss of capital. The point of the exercise is to know which assumptions your plan depends on, and how much room you have when they miss.
How to track it by hand
Start with the simplest version that still tells you something: a no-growth, no-inflation table with one row per year. You enter the starting nest egg once, on the first row. Each year you enter the three income sources and your spending, and four columns do the rest.
The worked example below is a planning sketch for someone retiring in 2027 with $600,000, spending $54,000 a year, collecting roughly $24,000 a year in net option premium and $12,000 in dividends, with Social Security of $2,400 a month ($28,800 a year) starting in 2029.
| Year | Starting nest egg | Option premium | Dividends | Other income | Spending | Income | Shortfall drawn | Nest egg at year end | Income covers spending |
|---|---|---|---|---|---|---|---|---|---|
| 2027 | 600,000 | 24,000 | 12,000 | 0 | 54,000 | 36,000 | 18,000 | 582,000 | 0.666667 |
| 2028 | 24,000 | 12,500 | 0 | 55,000 | 36,500 | 18,500 | 563,500 | 0.663636 | |
| 2029 | 22,000 | 13,000 | 28,800 | 56,000 | 63,800 | 0 | 563,500 | 1.139286 |
The spreadsheet below already contains these rows and the formulas that compute the shaded columns, so you can change the numbers and watch the last three columns move.
Download the template: Retirement income check (.xlsx). It opens in Excel, and in Google Sheets via File → Import. The worked example from this guide is already filled in, and the formulas carry down into the blank rows.
Row 1 — 2027, the first retirement year
Income is the sum of the three sources: 24,000 + 12,000 + 0 = 36,000. Spending is 54,000, so income does not cover it. The shortfall drawn is 54,000 − 36,000 = 18,000; that is what you sell or spend from cash during the year. The nest egg at year end is the starting figure less everything drawn so far: 600,000 − 18,000 = 582,000. The coverage ratio is income divided by spending, 36,000 ÷ 54,000 = 0.666667, or 66.7%. Two thirds of your spending came from income; one third came out of the capital.
Row 2 — 2028
Premium is held flat at 24,000 and dividends step up slightly to 12,500, so income is 36,500. Spending rises to 55,000 — a modest nod to prices drifting up. The shortfall is 55,000 − 36,500 = 18,500. The nest egg column does not subtract from last year's figure; it recomputes from the top, summing every starting nest egg entered and subtracting every shortfall drawn: 600,000 − (18,000 + 18,500) = 563,500. Coverage is 36,500 ÷ 55,000 = 0.663636, or 66.4%. Slightly worse than 2027, because spending grew faster than income.
Row 3 — 2029, Social Security starts
Premium is reduced to 22,000 — the plan assumes a little less option activity with age — and dividends grow to 13,000. Other income arrives at 28,800. Total income is 22,000 + 13,000 + 28,800 = 63,800 against spending of 56,000. Income now exceeds spending, so the shortfall formula returns 0: the sketch deliberately does not reinvest the surplus, it simply stops drawing. The nest egg stays at 600,000 − 36,500 = 563,500. Coverage is 63,800 ÷ 56,000 = 1.139286, or 113.9% — income covers spending with 14% to spare.
Reading the totals
Total drawn from nest egg is 18,000 + 18,500 + 0 = 36,500. Total income is 36,000 + 36,500 + 63,800 = 136,300. Over three years this plan funds 136,300 of 165,000 in spending from income and 36,500 from capital — a 6.1% dent in the starting nest egg, concentrated entirely in the two years before Social Security begins.
That bridge period is the useful finding. It is the thing to stress-test: what if premium is 15,000 instead of 24,000 in 2027? Change the cell and the shortfall jumps to 27,000 and the coverage ratio to 50%.
What this sketch leaves out
Be honest about its limits before you lean on it. It assumes no market growth at all, so the nest egg only falls. It assumes no inflation beyond the spending numbers you typed in. It ignores taxes, account types, healthcare and required minimum distributions. It does not reinvest surpluses, does not model margin debt or margin interest, and does not account for the fact that selling holdings to cover a shortfall reduces next year's dividends and next year's premium capacity. And it is annual — a plan can be fine at year-end and still have run dry in August.
Where manual tracking breaks down
The sketch is useful precisely because it is simple. The trouble starts when you try to make the inputs honest.
The premium number is the hardest input. "$24,000 a year" has to come from somewhere. The defensible version is net option cash over your recent completed months: credits received minus debits paid. That means pulling every option transaction, netting rolls (a roll is a close and an open in the same breath, and only the net matters), excluding assignments that moved shares rather than cash, and handling partial fills that arrive as three rows instead of one. Miss a buy-to-close and your run-rate is overstated.
Premium varies, and one average hides that. A single annual figure cannot tell you whether your worst three months in the last two years would have broken the bridge period. To know that you need month-by-month history, not a mean.
Dividends drift in both directions. Yields change, companies cut, and selling holdings to cover a shortfall cuts dividends mechanically. A flat dividend column quietly assumes none of that happens.
Multiple accounts. A taxable account, an IRA and a joint account each hold part of the nest egg and part of the income. Adding them by hand once is fine; keeping three spreadsheets agreed with three brokers for twenty years is not.
Margin changes the arithmetic. If you carry margin debt, your nest egg is holdings plus cash minus debt, interest accrues against you, and a paydown plan consumes cash that could otherwise fund spending. Borrowing to cover a shortfall rather than selling is a legitimate choice, but it needs a loan-to-value limit and a check on every period, not a note in the margin.
Corrections propagate. Fix one transaction — a mis-grouped spread, a missing opening trade, a transfer recorded as a purchase — and your premium run-rate, your nest egg and every row below it change. By hand that means re-entering and re-checking.
Annual rows hide monthly failures, and a single line hides the sequence problem entirely: the same average return delivered in a different order can leave you funded or broke, because withdrawals in bad years sell more shares.
How MetisTrades does it
MetisTrades builds the same projection from your imported transactions on the Plan → Retirement page (Top nav → Plan → Retirement). It reads the figures the other planning pages already produce — Plan › Income projects your dividends, option premium and interest; Plan › Margin runs a paydown plan; the Dashboard knows your account value and net contributions — adds one saved retirement goal, and runs a year-by-year projection through an accumulation phase (today to the retirement date) and a retirement phase (the retirement date to the end of your horizon).
You need a signed-in account with an active subscription or lifetime access. Anonymous visitors see Sign In Required instead of the Retirement section, because the plan is saved to your account rather than the browser session. The section is not shown on public share pages.
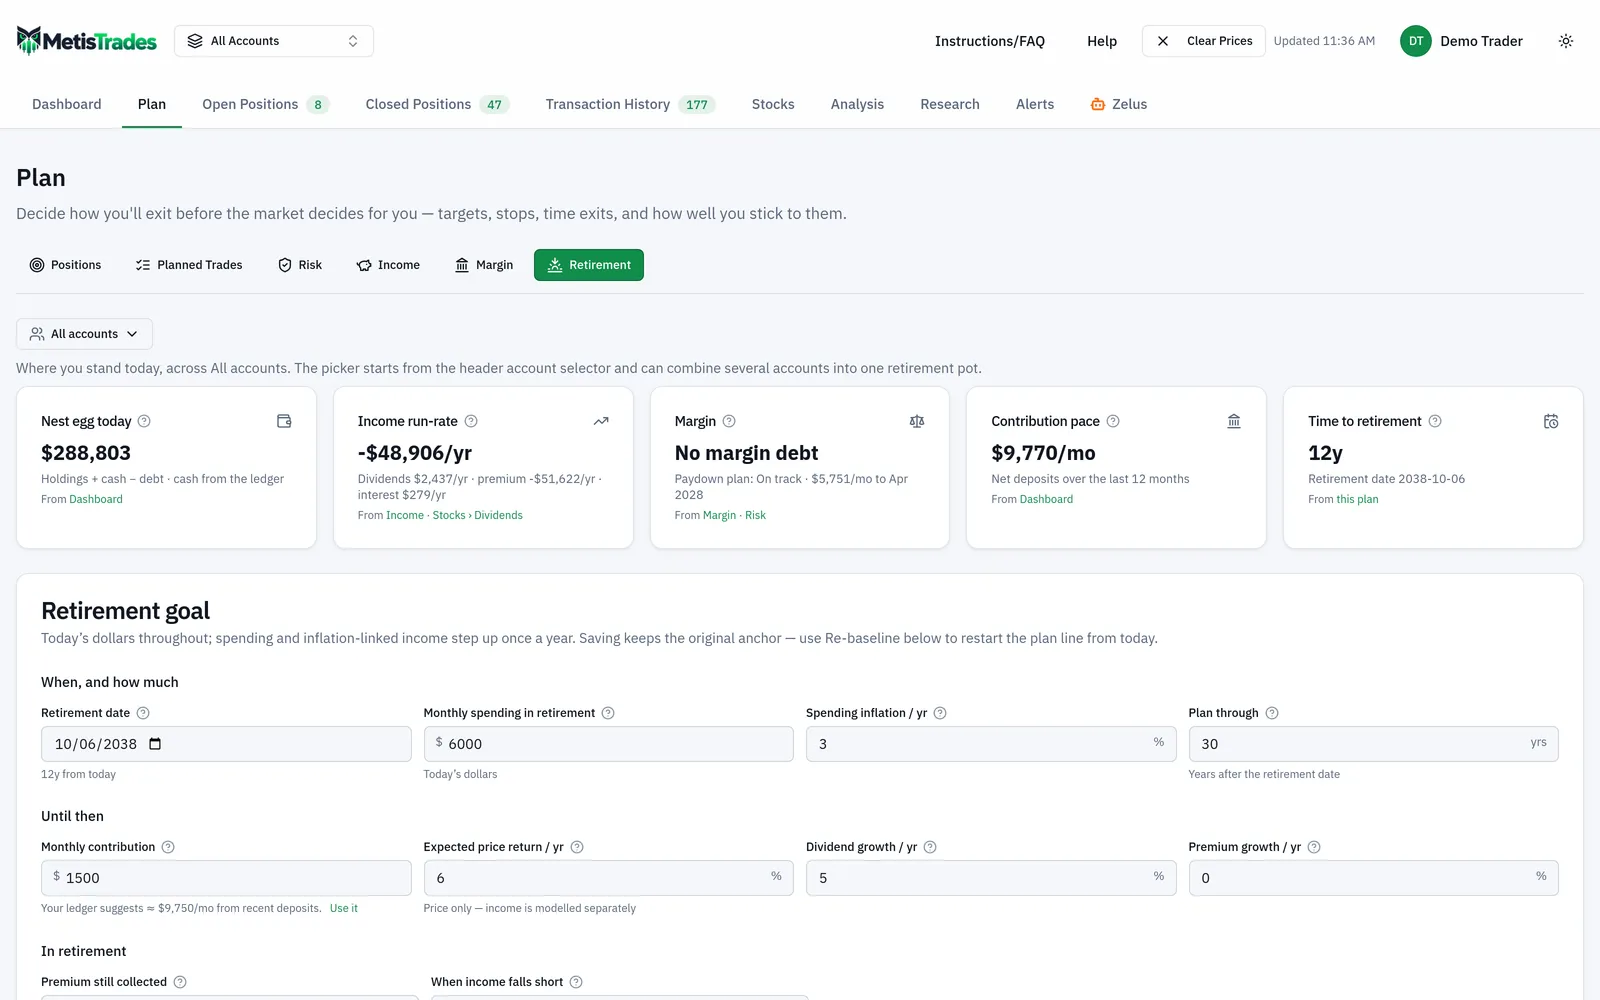
The screenshot below shows the page as a whole: the strip of today's figures at the top, the goal you save, and the projection it produces. Look at how the separate inputs — nest egg, dividends, premium, interest, margin and contributions — all feed one picture.
Where you stand
Five tiles describe today for the account chosen in the header selector. Nest egg today is account value: holdings plus cash minus margin debt, with a note on whether the cash figure came from your broker or the ledger. Income run-rate is per year, split into dividends, option premium and interest, using the same net premium run-rate as Plan › Income. Margin shows debt and loan-to-value plus any paydown plan. Contribution pace is net deposits per month over the last year of ledger history. Time to retirement counts down to your saved date. An input that cannot be read shows Unknown, never $0 — the strip does not guess.
Creating the plan
Before a plan exists, the page pre-fills the goal editor from today's figures: a retirement date fifteen years out, spending and return assumptions from your saved margin projection settings, and a monthly contribution rounded from your recent deposit pace. Review and select Create plan. The card recommends switching the header selector to All Accounts first, because creating the plan anchors it to today's nest egg in the selected scope.
The retirement goal
Everything is in today's dollars. Under When, and how much you set the Retirement date, Monthly spending in retirement, Spending inflation / yr and Plan through (1–50 years after retirement). Under Until then: Monthly contribution (with a hint reading Your ledger suggests ≈ $X/mo from recent deposits and a Use it shortcut), Expected price return / yr (price only; income is modelled separately), Dividend growth / yr and Premium growth / yr.
Under In retirement you set Premium still collected (0–100% of today's net premium run-rate), the shortfall policy under When income falls short — Sell holdings, or Borrow on margin up to my comfort LTV, then sell — and Other retirement income: up to eight sources, each with a name, a monthly amount, an optional start date (blank means it starts at retirement) and an Inflation-linked switch. That is where the 2029 Social Security row from the worked example belongs. Margin assumptions are read-only here; Change assumptions opens Analysis › Margin.
Readiness and timeline
Retirement readiness gives the verdict — Funded through <month year>, Money runs out <month year>, or Margin LTV crosses your N% hard limit <month year> — plus four figures, each badged estimate: Nest egg at retirement, Sustainable monthly spending, Earliest funded retirement and Extra contribution to fund the date.
The Timeline switches between two views. Nest egg stacks holdings and cash by year with margin debt as a dashed line and the nest egg on top, marked with Retirement, Runs out and LTV limit. Retirement income covers the retirement years only: dividends, option premium, interest and other income stacked, then withdrawals or borrowing, against the inflated spending line — with anything the plan could not cover shown as Uncovered. That is the hand-built table's coverage column, drawn.
Show range
With the Nest egg view selected, the Show range switch adds a probability band. It is Off by default and nothing about the verdict or figures changes while it is off. Turned on, a shaded band shows the 10th to 90th percentile of the year-end nest egg across simulated paths, with a thin Median line, and a Return volatility / yr field appears (initially 16%, allowed 0–80%) — the only new assumption you set.
Three things vary across paths: the monthly price return, drawn at your volatility and centred so your expected return stays the median; option premium, resampled from your own ledger month by month over your last 3 to 36 completed months of net premium; and dividend growth, drawn each plan-year around the rate you set with a fixed 5-point standard deviation. Spending, inflation, contributions, other income, interest, the margin APR and the LTV lines are identical on every path. The run is seeded, so the same inputs reproduce the same band, and the note quotes the run number.
Plan vs actual
Saving the goal anchors it to a date, a nest egg and an account scope. Before the retirement date the card classifies you Ahead of plan, On track or Behind plan by comparing today's actual account value in the anchored scope with the planned nest egg for today, and states the dollar difference and days to go. Re-baseline from today restarts the plan line from today's nest egg; Remove plan clears it. A Retirement readiness widget is also available on the Customizable dashboard under Capital & costs.
How to read the results
Nest egg today is holdings plus cash minus margin debt, derived from imported transactions and delayed quotes. It is not a statement balance and will differ from your broker if an import is incomplete or a holding is unpriced.
Income run-rate is per year, from dividends, net option premium and interest. The premium component is Plan › Income's net option-cash run-rate over recent completed months — never a gross premium figure. It describes what you have been collecting, not what you will collect.
Funded through the horizon means no month in the projection has an uncovered shortfall and, under the borrow policy, LTV never crosses the hard limit. It means that under one set of fixed assumptions, applied every year. It does not mean the plan is safe.
Sustainable monthly spending is the largest today's-dollar spending that stays funded through the horizon with everything else held constant. If it is below what you entered, the plan runs out at your figure. Lower spending, a later retirement date, more contributions, keeping more premium in retirement, or adding other income all move it.
Earliest funded retirement is the first month from today at which retiring keeps the plan funded on current assumptions, with the same spending and horizon length. Extra contribution to fund the date is the additional monthly contribution that funds the date you chose — None needed when already funded, Unreachable when contributions alone cannot get there.
In the range: the band is the middle 80% of outcomes, so one in ten lands above it and one in ten below. The summary reads "X% of outcomes stay funded through <year>", with median nest eggs at the retirement date and the end of the horizon, each with its band. The depletion years are the year by which half of the failing outcomes have run out and the year by which 90% have — they count only the paths that fail, not the whole set. If the verdict says funded but only 60% of outcomes stay funded, both are describing the same plan: the line is funded with little to spare and the slower paths miss.
The range is a simple model. Monthly returns are drawn independently at one volatility — no market regimes, no fat tails, no engineered sequence-of-returns scenarios beyond what independent draws produce. Premium and market draws are not correlated.
Plan vs actual compares today's account value with the planned value for today in the anchored scope; within 2% (at least $50) counts as on track. Switching the header selector does not change the verdict.
What none of these numbers include: taxes, account types (IRA versus taxable), required minimum distributions, healthcare costs and ages are not modelled. The plan works in dates and years only, and Social Security or pension amounts are whatever you enter. Any tax question belongs with your broker's forms and your accountant. The plan does not move money, sell securities, borrow or place trades.
Common mistakes
- Using gross premium collected as your retirement income. Credits received before buybacks and rolls overstate what actually landed. Use net option cash — credits minus debits — over recent completed months.
- Assuming today's premium continues forever. Volatility falls, capital gets sold to fund spending, and most people trade less at 75 than at 60. Set Premium still collected to a share you would defend out loud, and consider a lower figure than today's.
- Forgetting that selling to cover a shortfall cuts future income. In the hand-built sketch the dividend column stays flat while the nest egg falls. Under the Sell holdings policy the projection reduces holdings pro-rata, so future dividends fall with them — check that your own sketch does too.
- Creating the plan with one account selected. The anchor remembers the scope, so a plan built on the IRA alone keeps measuring the IRA alone. Switch the header selector to All Accounts before you select Create plan.
- Reading a "funded" verdict as a safety margin. It is one line under fixed assumptions. Turn on Show range and look at the share of outcomes that stay funded and the depletion years before you treat the date as settled.
- Mixing today's dollars with nominal dollars. Entering a spending figure inflated to 2045 and then applying a spending inflation rate on top double-counts. Every input belongs in today's money.
- Planning spending without planning the bridge. The worked example draws its entire 36,500 in the two years before Social Security starts. Check the years before each income source begins, not just the horizon total.
Related guides and help pages
Related guides
- Monte Carlo simulation: what it is and where MetisTrades uses it
- Plan, Track, Optimize: a complete tour of MetisTrades
- Planning Your Portfolio: A Tour of the Plan Tab
- Exit plans: deciding how you will leave a trade
- Setting and Tracking an Options Income Goal
- Planning a Margin Paydown: Setting a Destination LTV and Tracking Progress