Iron Condors, Straddles and Other Multi-Leg Positions
How multi-leg option positions are built from legs, how they get their names, and why grouping the legs correctly changes the credit, the risk and the P/L you record. Worked by hand on a four-leg XYZ iron condor.

What it is and why it matters
A leg is one option contract inside a position: one underlying, one expiration, one strike, one type (call or put), bought or sold. A multi-leg position is two or more legs that you traded as a single idea, even though the broker filled them as separate contracts.
The names you see on multi-leg positions are descriptions of shape, not of intent. A vertical spread is two options of the same type and expiration at different strikes, one bought and one sold. A straddle is a call and a put at the same strike and expiration in the same direction; a strangle is the same thing at different strikes. A calendar spread uses the same type and strike at different expirations; a diagonal spread changes the strike as well. An iron condor is four legs: a put credit spread below the market and a call credit spread above it, sold together so the position collects a net credit (money received) and profits if the underlying stays inside the range.
Why does the grouping matter? Because the numbers you care about — net credit, maximum loss, breakevens — only exist at the level of the whole structure. A short 95 put on its own carries one risk profile. The same short put with a long 90 put behind it carries a different, capped one. If those two legs are recorded as separate positions, nothing in your records shows the capped risk, and the per-position profit and loss you read is only part of the story.
MetisTrades builds positions from imported transactions rather than asking you to enter a finished strategy, and it names each position by examining its opening legs. That reconstruction is an estimate of what you intended, which is exactly why it is worth being able to check the arithmetic yourself.
Work it out by hand
XYZ is trading at $100.00. You open a four-leg iron condor, one contract per leg, standard equity options with a contract multiplier of 100 shares. You sell the 95 put and buy the 90 put below the market; you sell the 105 call and buy the 110 call above it. All four legs expire on the same date.
Step 1: net the cash flows
Each leg's cash flow is its price per share multiplied by the contracts and the multiplier. Money received from sold legs is positive; money paid for bought legs is negative.
| Leg | Action | Strike | Price per share | Contracts × multiplier | Cash flow |
|---|---|---|---|---|---|
| Long put | Buy to open | 90 | $0.55 | 1 × 100 | −$55 |
| Short put | Sell to open | 95 | $1.20 | 1 × 100 | +$120 |
| Short call | Sell to open | 105 | $1.10 | 1 × 100 | +$110 |
| Long call | Buy to open | 110 | $0.45 | 1 × 100 | −$45 |
| Net | $1.30 | +$130 |
The put wing brings in $1.20 − $0.55 = $0.65 per share. The call wing brings in $1.10 − $0.45 = $0.65 per share. Added together that is $1.30 per share, and $1.30 × 100 = $130 of net credit for one condor. Because the sold legs cost more than the bought legs, the position opens at a credit rather than a debit (money paid).
Step 2: find the maximum loss
Each wing is five points wide: 95 − 90 = 5 on the put side and 110 − 105 = 5 on the call side. The underlying cannot finish below both put strikes and above both call strikes at once, so only one wing can be in the money at expiration. The worst case is one wing fully in the money:
$5.00 × 100 = $500 of intrinsic value owed, less the $130 already collected, gives $500 − $130 = $370 as the most this condor can lose at expiration, before fees.
Step 3: find the breakevens
Below the short put, losses start once the put's intrinsic value exceeds the credit. $95.00 − $1.30 = $93.70. Above the short call, $105.00 + $1.30 = $106.30. Between those two prices the position is profitable at expiration; outside them it is not.
Step 4: check a specific expiration price
Suppose XYZ finishes at $93.00. The short 95 put is in the money by $2.00, costing $200. The long 90 put expires worthless. The call wing expires worthless. Net result: $130 − $200 = −$70. At $88.00, the short put costs $700 and the long put returns $200, a net $500 out against $130 in: −$370, the maximum loss from step 2.
| Figure | Arithmetic | Result |
|---|---|---|
| Net credit | ($1.20 − $0.55 + $1.10 − $0.45) × 100 | $130 |
| Maximum gain at expiration | Net credit | $130 |
| Maximum loss at expiration | ($5.00 × 100) − $130 | $370 |
| Lower breakeven | 95 − 1.30 | $93.70 |
| Upper breakeven | 105 + 1.30 | $106.30 |
| Result at $93.00 | $130 − $200 | −$70 |
What changes the outcome
Change one input at a time and rework the same arithmetic. Every figure below comes from the same XYZ condor with a single number altered.
Wing width
Buy the 90 put for $0.55 or buy the 85 put for $0.30? With the 85 put, the credit becomes ($1.20 − $0.30 + $0.65) × 100 = $155, but the put wing is now ten points wide: ($10.00 × 100) − $155 = $845 of maximum loss. You collected $25 more and accepted $475 more risk. Wider wings also push the lower breakeven out slightly, to 95 − 1.55 = $93.45.
Strike selection
Move the short put from 95 to 97 (and the long put from 90 to 92) and suppose the wing now brings in $1.90 − $0.70 = $1.20 instead of $0.65. Total credit becomes ($1.20 + $0.65) × 100 = $185 and maximum loss ($5.00 × 100) − $185 = $315. But the lower breakeven moves up to 97 − 1.85 = $95.15, only $4.85 below the current price instead of $6.30. Selling closer to the money raises the credit and shrinks the range.
Size
Three contracts per leg triples everything linearly: $390 of credit and $1,110 of maximum loss. The breakevens do not move, because they are per-share figures.
Contract multiplier
The multiplier is not always 100. On a mini option with a multiplier of 10, the same $1.30 of net premium is $13 of credit and the maximum loss is ($5.00 × 10) − $13 = $37. The strikes and breakevens are unchanged; only the dollars differ.
Fees
At $0.65 per contract, four opening fills cost $2.60 and four closing fills another $2.60. That $5.20 reduces the net credit to $124.80 and raises the maximum loss to $375.20. Breakevens move in to roughly $93.75 and $106.25. On a $130 credit, fees are 4% of the best case.
Closing early
You do not have to hold to expiration. If you can buy the condor back for $0.60 per share, you pay $60 and keep $130 − $60 = $70. If the underlying has moved and the condor costs $1.90 to close, you pay $190 and record $130 − $190 = −$60. Rising implied volatility generally raises what it costs to buy the structure back; falling implied volatility lowers it.
How the legs are grouped
This one changes nothing about the trade and everything about the record. Split the four legs into two positions and you have a put credit spread showing $65 of credit and a call credit spread showing $65. Neither row shows the $130 combined credit, the $370 combined risk, or the $93.70/$106.30 range. Group only the two short legs together and the shape that remains is a short strangle — a different structure with different risk from the condor you actually placed.
Where you see it in MetisTrades
MetisTrades first identifies opening option transactions, builds a ledger for each contract and direction, then matches later closes, expirations, assignments and exercises to those opening lots. Broker evidence has priority: if several fills share one brokerage order identifier and cover different contracts, the app treats them as one multi-leg order. For automatically synced activity, execution-time proximity can connect legs when the brokerage identifiers do not line up. Failing that, it compares candidate legs with the same underlying and entry time, classifies the combined shape, and checks that balanced strategies have matching quantities.
Date-only exports are where this gets hard. Robinhood, Charles Schwab and Fidelity CSV-style exports, and Interactive Brokers Flex and other date-only files, can lack both execution timestamps and shared order identifiers. When only the date is known, trades placed hours apart can fall into the same candidate group, and two separate same-day orders can resemble a valid vertical, straddle, strangle or condor. Review positions after importing busy same-day option activity.
The first screen to check is Open Positions. A correctly grouped condor appears as one row, with the structure named in the Strategy column — a four-leg put-and-call credit structure can be classified as Iron Condor. Look for one row per structure rather than four separate single-leg rows, and confirm the strategy name matches what you actually traded.
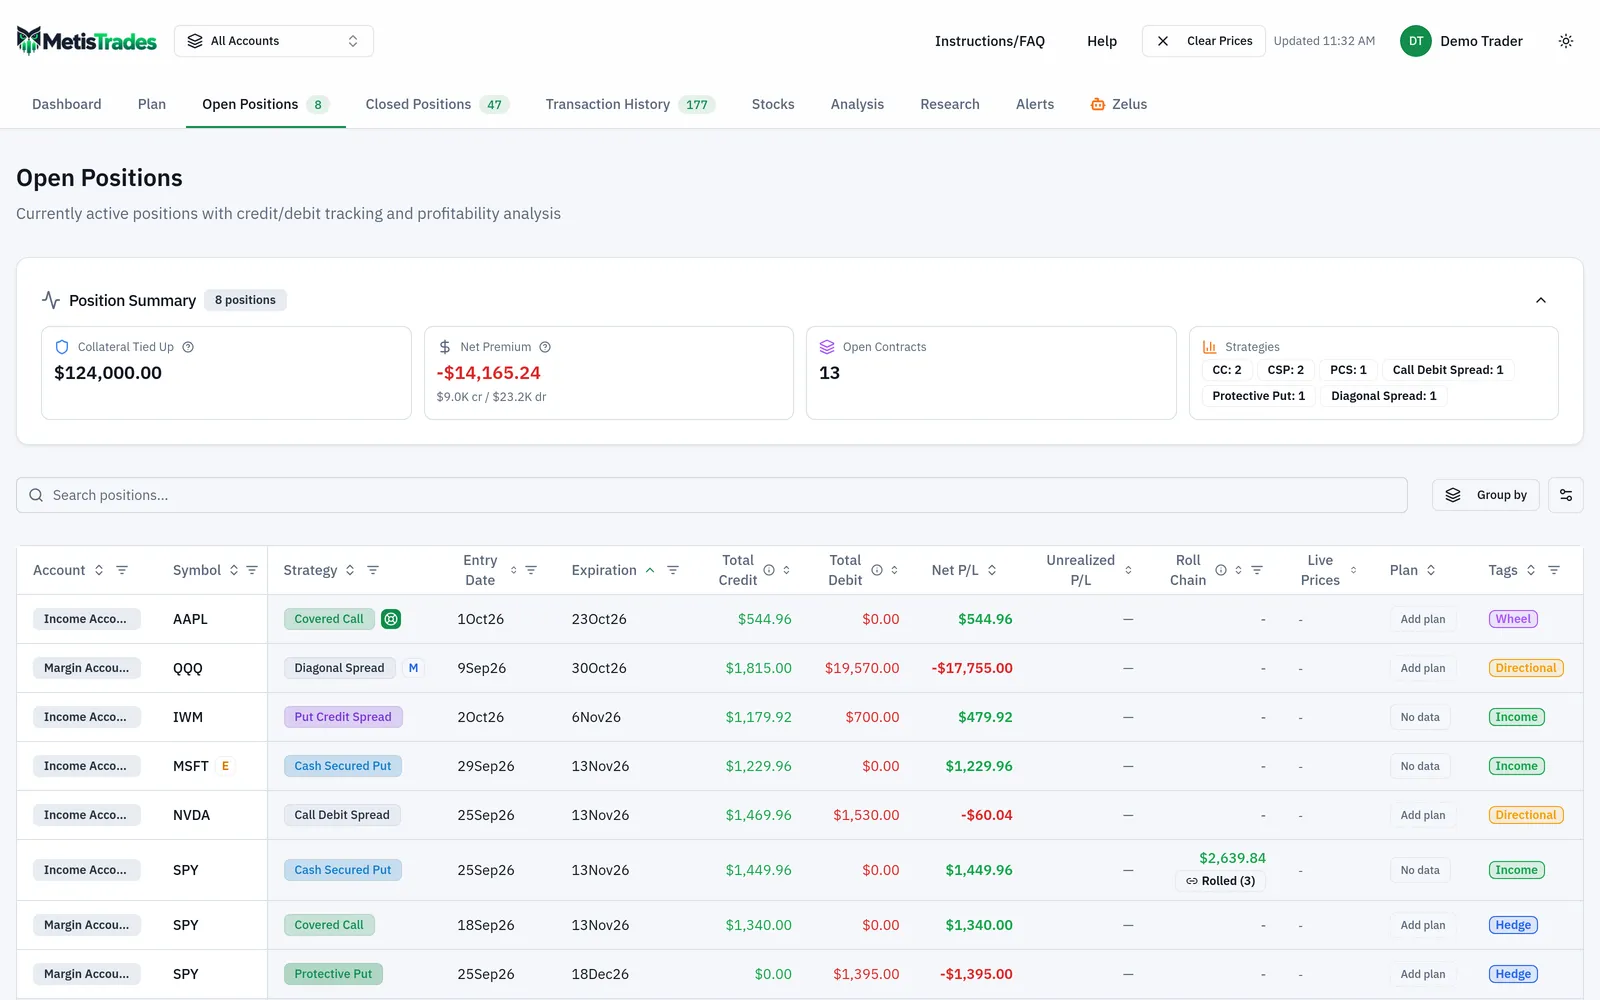
If a row is wrong, the fix depends on the problem. The row action whose tip reads Split this multi-leg position into separate legs separates every distinct leg and gives each one its own single-leg classification, such as Long Call, LEAPS, Long Put, Short Call or Short Put; that correction is saved, and Restore auto-grouping (undo ungroup) reverses it. If the opposite happened and your four legs were left apart, open Transaction History for one specific trading account, select the related rows, and choose Group as Position. The Group Transactions as Position dialog asks for a Strategy Type, previews the Selected Transactions with Date, Description, Code and Amount, and shows a Position Summary with Symbols, Transactions, Total Credit, Total Debit and Net P/L — the same netting you did by hand in step 1. Manual grouping needs at least two rows and at least one opening transaction, and it is not available in the all-accounts view.
From Open Positions, open a position's detail to inspect what the group actually contains leg by leg. This is where you confirm that the 90/95 put wing and the 105/110 call wing are all accounted for before you trust any position-level figure.
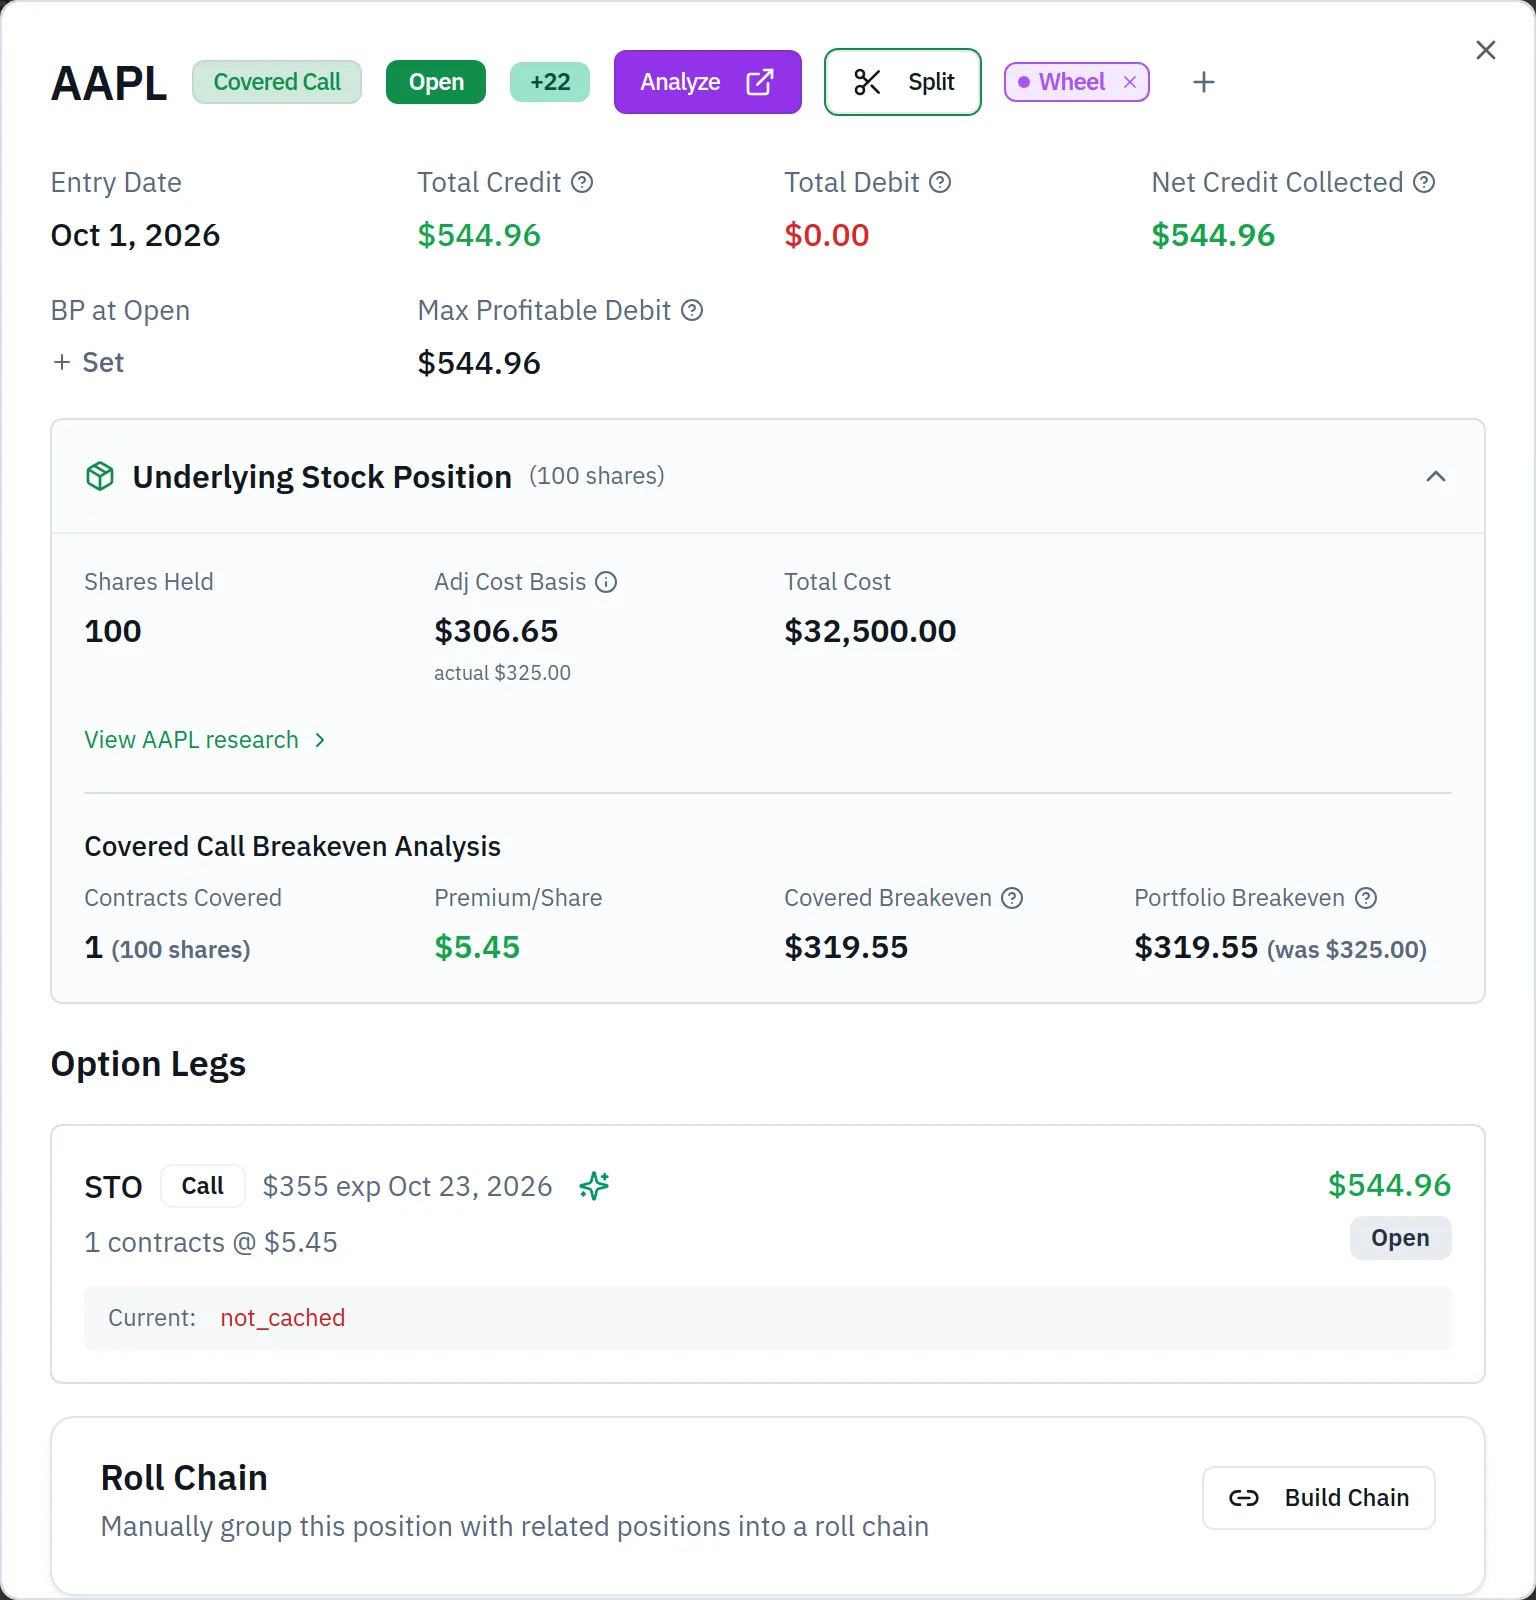
Position details is also where Split lives, for the case where only some contracts belong elsewhere. Split Position asks for a Target Strategy Type, then under Legs to Split lists each leg with Option, Expiration, Strike, Type, Current Qty and Move Qty. Move Qty starts at 0 and cannot exceed that leg's current quantity, and at least one leg must be above 0. The Split Summary confirms the moved quantities and the new strategy before you create the group; the original position keeps the contracts you did not move. A split position shows Unsplit in its detail, which merges the contracts back and recalculates the strategy.
Two things to keep in mind when reading the numbers on these screens. Any prices used in position views are delayed quotes or the latest available price. And anything calculated from imported transactions — including position profit and loss, returns and cost basis — is an estimate, because the app can only work from the activity it was given.
On access: the position tables that expose these controls are Pro surfaces, and grouping, ungrouping, splitting, restoring and unsplitting are editing actions for signed-in Pro users, scoped to a specific trading account. Anonymous visitors can see positions created from their uploaded browser-session data but cannot save these manual grouping adjustments. Someone viewing a public share cannot change grouping or splitting.
Common mistakes
- Trusting the automatic grouping after a date-only import. A trade date alone cannot prove several fills were one order — review multi-leg rows after any busy same-day option activity and correct them before reading the P/L.
- Using Reclassify to fix a badly grouped condor. The reclassification tool only converts Short Call to Covered Call and Long Put to Protective Put — for incorrectly combined legs, use the split control instead.
- Confusing ungrouping with splitting. Ungrouping separates every distinct leg; splitting moves a chosen number of contracts into a new group and leaves the rest — pick the one that matches the correction you need.
- Reading one wing's credit as the whole structure's risk. $65 on a put spread row says nothing about the condor's $370 maximum loss — group the four legs so the structure-level figures exist.
- Assuming every contract represents 100 shares. Mini options use a multiplier of 10, so re-run the credit and maximum-loss arithmetic with the contract's actual multiplier.
- Leaving fees out of the breakevens. Eight fills at $0.65 cut a $130 credit to $124.80 — subtract opening and closing costs before you decide where the range really ends.
- Expecting a corrected grouping to survive any file change. Manual groupings and splits persist across re-uploads, but editing an imported transaction changes its identity, so review grouping after editing or replacing broker history.
Related guides and help pages
Related guides
- Covered Calls Explained: Premium, Capped Upside and Adjusted Cost
- Cash-Secured Puts Explained: Collateral, Effective Price and the Wheel
- Vertical spreads: defined-risk option trades
- How Strategies Get Their Names (And How to Correct Them)
- Grouping and Splitting Imported Option Legs Correctly
- Plan, Track, Optimize: a complete tour of MetisTrades