Premium-Adjusted Cost Basis for Covered-Call Holders
Covered-call premium lowers the effective cost of the shares you own, but it never changes the cost basis your broker reports. Here is how to track both numbers by hand, and how MetisTrades keeps them side by side.
What it is and why it matters
A covered call is a short call option sold against shares you already own. You collect premium — the money the buyer pays you for the contract — and in exchange you accept the obligation to sell those shares at the strike price if the call is assigned.
Sell calls against the same shares month after month and the premium adds up. Many holders start thinking of it as a discount on the stock: "I paid $50, I've collected $3.27 a share in premium, so I'm really in at $46.73." That number has a name. It is your premium-adjusted cost, sometimes called effective or adjusted cost per share.
It is a useful figure because it answers a question a simple stock P/L cannot. Your shares might be flat since purchase, but the position as a whole has produced cash. Premium-adjusted cost folds that cash into one per-share number you can compare against the market price, against the strikes you are considering, and against the call-away price you would receive on assignment.
Now the warning, because it is the whole reason this guide exists. Premium-adjusted cost is a tracking figure. Your tax cost basis — the amount used to work out gain or loss when you sell the shares — is built from what you paid for them, with applicable adjustments. Option premium you collected on separate contracts is its own set of transactions; it does not reduce what the share purchase cost. If you sell 200 shares bought at $50, the share side is measured against the purchase cost, not against your adjusted $46.73. The two numbers live in different columns and should stay that way in your records.
Confusing them has practical consequences. You can talk yourself into believing a sale at $47 is a breakeven when the share lot shows a loss, or that a call-away at $54 produced less gain than it did. Tracking both figures on the same sheet, in adjacent columns, keeps the distinction visible every time you look.
Worth stating plainly: premium does not protect the shares. A stock that falls $10 has fallen $10 whether or not you collected $3.27 in calls. Adjusted cost tells you what the combined activity has returned so far; it says nothing about what comes next.
How to track it by hand
The method is a running ledger. One row for the share purchase, then one row per covered call you sell. Each call row records what you received, what you paid to close it if anything, and the fees. Two running columns do the work: cumulative net premium, and the adjusted cost per share it implies.
The arithmetic for each call row is:
- Net premium = (premium per share − close cost per share) × 100 × contracts − fees
- Premium to date = the running sum of net premium down the sheet
- Adjusted cost / share = (total share cost − premium to date) ÷ shares
- Tax basis / share = total share cost ÷ shares, which never moves
The 100 is the contract size — the number of shares one contract represents. Standard equity options usually use 100, but mini options use 10 and futures options use a broker-supplied multiplier, so check before you assume.
Here is a worked example on 200 shares of XYZ bought at $50, with three covered calls sold over three months.
| Date | Event | Shares | Total cost | Contracts | Premium / share | Close cost / share | Fees | Net premium | Premium to date | Adjusted cost / share | Tax basis / share |
|---|---|---|---|---|---|---|---|---|---|---|---|
| 2026-01-05 | Buy 200 XYZ at 50 | 200 | 10000 | 0 | 0 | 50 | 50 | ||||
| 2026-01-06 | Sell 2 XYZ 53 calls, expired | 2 | 1.2 | 0 | 1.3 | 238.7 | 238.7 | 48.8065 | 50 | ||
| 2026-02-09 | Sell 2 XYZ 53 calls, bought back | 2 | 1.4 | 0.4 | 2.6 | 197.4 | 436.1 | 47.8195 | 50 | ||
| 2026-03-09 | Sell 2 XYZ 54 calls, expired | 2 | 1.1 | 0 | 1.3 | 218.7 | 654.8 | 46.726 | 50 |
Row by row
2026-01-05. You buy 200 shares at $50 for a total cost of $10,000. No premium yet, so premium to date is 0 and adjusted cost per share is $10,000 ÷ 200 = $50. Tax basis per share is the same $50. From here the two columns separate.
2026-01-06. You sell 2 calls at the 53 strike for $1.20 per share. Gross premium is 1.2 × 100 × 2 = $240. Fees of $1.30 come off, giving net premium of $238.70. The call expires worthless, so there is no close cost. Premium to date is $238.70, and adjusted cost becomes ($10,000 − $238.70) ÷ 200 = $9,761.30 ÷ 200 = $48.8065. Tax basis per share is still $50.
2026-02-09. You sell 2 more 53-strike calls at $1.40 and later buy them back at $0.40. The net per share is 1.4 − 0.4 = $1.00, so 1.0 × 100 × 2 = $200, minus $2.60 in fees across both sides, for net premium of $197.40. Note that buying back a call reduces that row's contribution but does not erase it. Premium to date rises to 238.70 + 197.40 = $436.10, and adjusted cost falls to ($10,000 − $436.10) ÷ 200 = $9,563.90 ÷ 200 = $47.8195.
2026-03-09. You sell 2 calls at the 54 strike for $1.10. That is 1.1 × 100 × 2 = $220, minus $1.30 in fees, for net premium of $218.70. The call expires. Premium to date reaches 436.10 + 218.70 = $654.80, and adjusted cost per share lands at ($10,000 − $654.80) ÷ 200 = $9,345.20 ÷ 200 = $46.726.
So across three calls you collected $654.80 net, which works out to $3.274 per share, or 6.548% of the $50 purchase price. Your tax basis per share is unchanged at $50 in every row.
The spreadsheet below already contains this example and the formulas, so you can overwrite the rows with your own symbol and keep adding calls underneath.
Download the template: Premium-adjusted basis tracker (.xlsx). It opens in Excel, and in Google Sheets via File → Import. The worked example from this guide is already filled in, and the formulas carry down into the blank rows.
Two habits make the sheet reliable. First, record fees on the row where they occurred rather than in a separate total, so each call's economics stand alone. Second, if your share count changes — you buy more, sell some, or shares are called away — add a row that adjusts both shares and total cost, because the adjusted-cost formula divides by the running share total.
Where manual tracking breaks down
The arithmetic is simple. Keeping the ledger complete and correct over years is not. These are the specific places hand tracking fails.
- Missed rows. A call sold on a busy week never gets entered. Nothing in the sheet flags the gap, so the adjusted cost quietly runs too high and the premium total too low.
- Partial fills. You enter an order for 5 contracts and get 3 now, 2 at a different price later. Entering one line at an average price loses the fee detail and can mismatch the eventual closing trades.
- Rolls. Closing one call and opening another in a single order produces two transactions and one net number on the broker confirmation. Hand ledgers tend to record the net and lose which contract was closed, which breaks the matching when you later ask how a particular strike performed.
- Assignments and expirations. An expired call often produces no transaction at all at some brokers, so the row has no natural prompt. An assignment removes shares, changes the denominator, and also ends the premium stream — three edits to make from one event.
- Multiple accounts. The same symbol held in a taxable account and an IRA needs separate premium ledgers, because a call sold in one account has nothing to do with the shares in the other.
- Corrections. Broker-side corrections, cancelled trades and re-booked fees arrive after you have already written the row, and the running totals below it all shift.
- Share-count events. Splits, dividend reinvestment and transfers from another broker all change the share count or the cost side of the division. A reverse split, for example, restates the lot quantity and cost per share without changing the money.
Any one of these produces an adjusted cost that is wrong by a few cents. Several over a few years produce a number you no longer trust, which is worse than not having it.
How MetisTrades does it
MetisTrades builds the same two figures from your imported transactions, so the figures update as you import new activity.
Start with the imported activity
Cost basis is built by replaying the stock transactions you imported. Each stock purchase creates a lot with an acquisition date, original quantity, remaining quantity, price per share and total cost, and later sales and transfers out reduce those lots. Shares moved in from another broker arrive as an ACAT transfer-in: the transaction proves you own the shares but carries no purchase history, so MetisTrades keeps those shares separate and marks their basis as missing until you enter the original cost.
Open Analysis → Covered Calls
The covered-call side lives at /analysis/covered-calls, reached through Top nav → Analysis → Covered Calls. The page analyses call-opening sales that belong to positions classified as Covered Call; calls that are legs of spreads or other strategies are excluded. It is available to users with active access — a signed-in user without an active subscription or lifetime access cannot reach the Analysis tab — and someone holding a public share link can view it for the shared data.
Four summary cards sit at the top. Net Premium Income is premium collected minus premium paid to close. Win Rate covers wins and losses among non-open covered calls. Assignment Rate shows assigned calls as a percentage of closed trades. Open P/L shows estimated P/L across open calls and the number of open positions. When the data spans more than one month, Monthly Premium Income charts net covered-call premium by month, with positive months in green and negative in red.
The card that matches the spreadsheet is Adjusted Cost Basis by Symbol. Look at the Stock Cost, Net Premium and Adjusted Cost columns together, and at the Reduction column that expresses the difference in dollars and as a percentage.
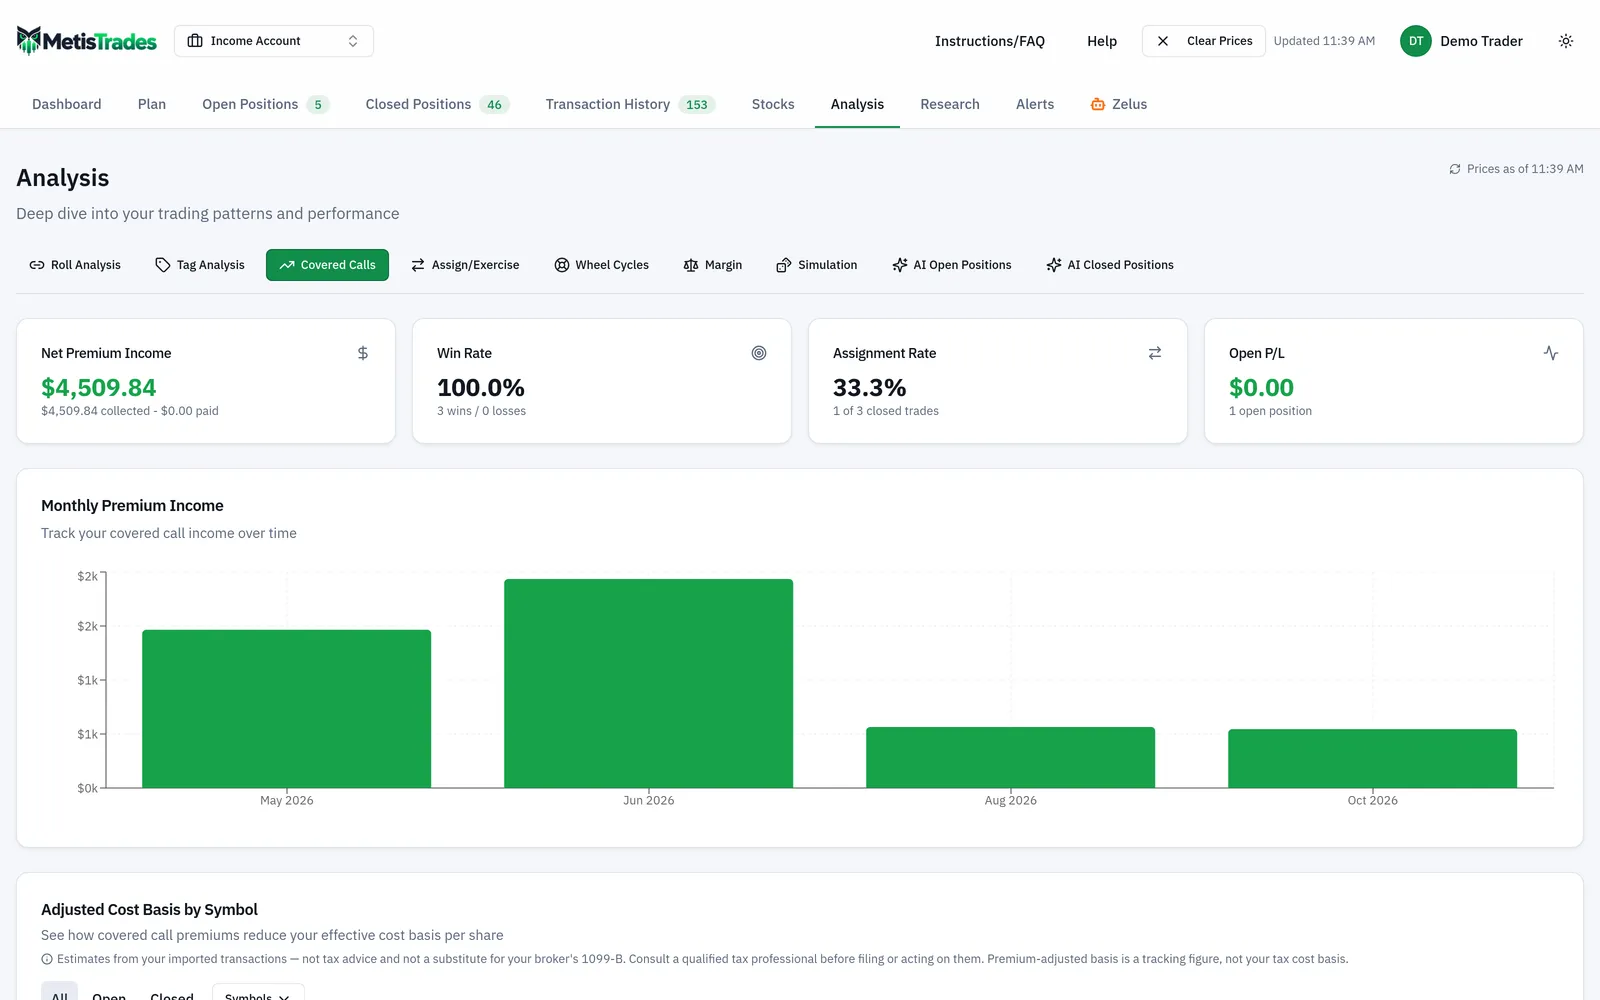
The table columns are Symbol, Shares, Stock Cost, Net Premium, Adjusted Cost, Reduction, Trades and Win Rate. Adjusted Cost is Stock Cost minus Net Premium divided by Shares — the same division you did by hand. Filters are All, Open and Closed, plus a multi-select symbol picker, and Clear removes all active filters. A summary line reports how many trades and symbols remain and whether only open or closed trades are shown.
Expand a symbol for the trade history
Expanding a symbol opens Trade History for that symbol, with columns Strike, Opened, Expiration, Contracts, Premium, Net P/L and Outcome. Outcome badges include Open, Expired, Assigned, Closed and Rolled. A matching buy-to-close marks a call closed, an expiration record marks it expired, an assignment or exercise record marks it assigned, and a past expiration with no matched close is also shown as expired. Where a trade belongs to a roll chain, an indicator shows the roll count and Chain Total, and selecting it opens position details; a wheel-cycle marker can open the related cycle detail panel.
In an all-accounts view, symbol rows are grouped by account, and each account section shows symbols, trades, open and closed counts, win rate and net premium.
Check the share side on Stocks
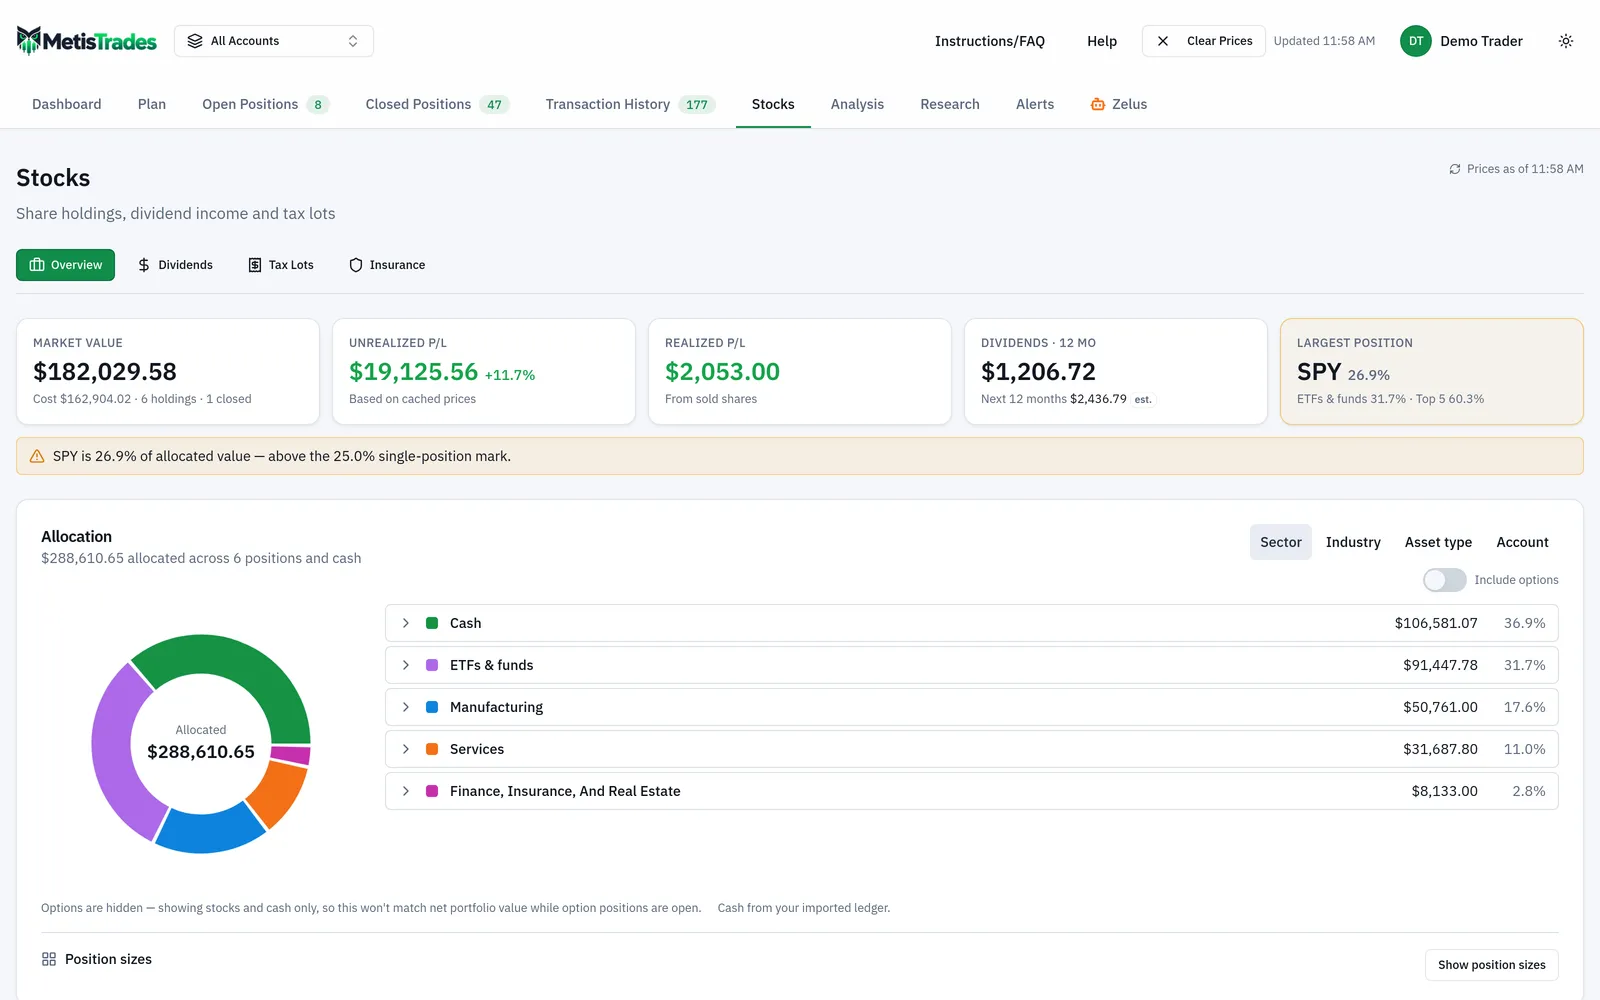
The purchase side of the ledger stays on the Stocks pages, where cost basis comes from your imported stock activity rather than from any option premium. The Shares column shows purchased shares and transferred shares, and opening a symbol row reveals the "Transfers in" section where you can choose "Enter cost basis" for a transfer that has none.
In the "Enter transfer cost basis" dialog, the Shares field starts with the quantity from that transfer; you enter the shares the basis applies to and the original "Cost/share" from your previous broker, and the dialog displays "Total cost basis" as cost per share multiplied by shares. Saving refreshes stock research, holdings, tax lots and account data. Pro users can reach the signed-in Stocks Overview and Stock Research surfaces; the account owner can enter, edit or clear transfer basis, while a public share link is read-only.
How to read the results
Stock Cost is the holding's average share cost from imported stock activity, including transferred shares that have an entered basis. It is the number that corresponds to the $50 tax-basis column in the spreadsheet, and it is not reduced by any option activity.
Net Premium is opening premium received minus amounts paid on matched buy-to-close transactions, for covered calls only. Compare it with the $654.80 total from the worked example. It excludes calls that sit inside spreads or other strategies, so a symbol where you trade several structures will show less premium here than your account statement shows in total.
Adjusted Cost is Stock Cost minus Net Premium divided by Shares. It is a tracking estimate that spreads net covered-call premium across the currently recognized shares, and it can differ from broker accounting. It does not change your broker's tax cost basis. Reduction states the per-share difference between Stock Cost and Adjusted Cost, in dollars and as a percentage of Stock Cost — in the example, $3.274 per share, or 6.548%.
Because Adjusted Cost divides by the current share count, it moves when the share count moves. Buy more shares without selling more calls and the per-share reduction shrinks, even though you collected the same premium. That is arithmetic, not performance.
Win Rate counts winning closed trades over all non-open trades, with expired and assigned outcomes counting as wins and a normally closed trade winning when net premium is positive. Read it next to Net Premium: a high win rate can coexist with one expensive buy-back. Assignment Rate is assigned outcomes divided by all non-open trades, which tells you how often the strikes you chose were reached, not whether those assignments were good or bad for you.
Open P/L is opening premium received minus the estimated cost to close each open call at the latest available price. Quotes in MetisTrades are delayed — the page prefers the available mark, then the bid/ask midpoint, then the last price — so this figure can be stale, and it may be absent when no usable option price is available.
In an all-accounts view, account rows stay separate for covered-call premium, but share and cost-basis figures for the same symbol use the aggregate holding. If you hold the same ticker in two accounts, read the per-account premium figures and the holding figures with that difference in mind.
All of these are estimates from your imported transactions. Cost basis, adjusted cost, holding periods and gain figures are not tax advice and not a substitute for your broker's 1099-B, and MetisTrades does not make wash-sale adjustments.
Common mistakes
- Reporting adjusted cost as your tax basis. Premium collected on options does not reduce what you paid for the shares. Keep the purchase-derived basis in its own column and use the broker's forms when you file.
- Forgetting the buy-back. Counting the $1.40 you received and ignoring the $0.40 you paid overstates that call by $80 on 2 contracts. Record both sides on the same row, as the February example does.
- Leaving fees out. The three calls in the example carry $5.20 of fees in total. Small per trade, but they come straight off net premium and compound across a year of monthly calls.
- Assuming 100 shares per contract. Mini options use 10 and futures options use a broker-supplied multiplier. Multiply by the actual contract size or every row is wrong by a factor.
- Not updating shares after an assignment or purchase. Adjusted cost divides by the share count, so a stale denominator silently distorts the per-share figure.
- Mixing accounts. Premium from calls sold in one account does not belong against shares held in another. Track each account separately; MetisTrades matches opening and closing calls within the same account.
- Treating a low adjusted cost as downside protection. It records premium already collected. It does not stop the share price falling below it, and the shares can still be called away at the strike.
Related guides and help pages
Related guides
- Covered calls explained: premium, assignment and adjusted cost
- Tracking the Wheel Strategy: Premium, Share Basis and the Cycle Result
- Tracking covered-call income by symbol
- Cost basis and tax lots: tracking what each block of shares actually cost
- Shares Moved From Another Broker: Fixing Missing Cost Basis
- Seeing your stock holdings in one place: value, sector, account and income