Seeing your stock holdings in one place: value, sector, account and income
Learn to build a single view of every stock you own — shares, value, unrealized gain, sector and account spread, and the dividends they pay — first by hand in a spreadsheet, then on the MetisTrades Stocks Overview page.
What it is and why it matters
A holdings view answers four questions at once: what do I own, what is it worth today, where is it concentrated, and what does it pay me while I hold it.
Most traders can answer the first question from memory. The other three are harder, because the information is scattered. Shares bought in a taxable account sit in one broker screen, the IRA sits in another, dividends arrive as separate cash lines, and nothing adds the pieces up by sector. The result is a familiar surprise: you believe you are diversified, and then you total it up and discover one technology name is more than half your stock money.
Four terms do most of the work in this guide.
- Cost basis — the amount assigned to an investment for gain or loss tracking, generally built from purchase cost and applicable adjustments. In the sheet below it is simply what you paid in total, including fees.
- Market value — the latest available price multiplied by the shares you own.
- Unrealized P/L — the estimated gain or loss on shares you still hold, measured as market value minus cost basis. It becomes realized only when you sell.
- Forward yield — the annual dividend rate per share divided by the latest price. It describes the rate a holding has been paying, scaled to its current price.
Why bother building this view when your broker shows positions already? Because allocation is a property of the whole portfolio, not of any one account. A 55% technology weight only exists once you add the accounts together. And because dividend income is easy to overestimate: three holdings that each "pay a decent dividend" can still produce a modest total when you multiply the per-share rate by the shares you actually own.
This guide is about record keeping and measurement. It does not tell you what mix to hold or whether a holding is a good one — only how to see clearly what you have.
How to track it by hand
The unit of the sheet is one row per symbol per account. Keeping the account on the row matters: the same symbol held in a taxable account and an IRA has different tax consequences and may have a different basis, so you want to be able to split or combine them later rather than merging them at entry.
Step 1 — Record what you cannot calculate
Seven columns are things you look up or already know:
- Symbol and Account — the identity of the row.
- Sector — the company's business grouping. Keep your labels consistent; "Health care" and "Healthcare" become two sectors in a pivot.
- Shares — owned shares, not contracts.
- Cost basis — total paid for those shares including commissions and fees.
- Price — the latest close or delayed quote you looked up. Write the date you looked it up somewhere on the sheet, because every value below it is only as fresh as that date.
- Annual dividend / share — the yearly rate per share, from the company's recent payment history. A stock paying $0.24 a quarter has an annual rate of $0.96.
Step 2 — Let four columns compute themselves
The computed columns are deliberately simple so you can check them in your head:
- Value = Shares × Price
- Unrealized P/L = Value − Cost basis
- % of stock value = Value ÷ total of the Value column
- Yearly dividends = Shares × Annual dividend / share
The spreadsheet below already contains this worked example and these formulas, so you can replace the three rows with your own.
Download the template: Stock holdings sheet (.xlsx). It opens in Excel, and in Google Sheets via File → Import. The worked example from this guide is already filled in, and the formulas carry down into the blank rows.
Step 3 — The worked example
| Symbol | Account | Sector | Shares | Cost basis | Price | Annual div / share | Value | Unrealized P/L | % of stock value | Yearly dividends |
|---|---|---|---|---|---|---|---|---|---|---|
| XYZ | Taxable | Technology | 200 | 9,600 | 52 | 0.96 | 10,400 | 800 | 54.8813% | 192 |
| ABC | IRA | Consumer | 150 | 4,650 | 29 | 1.20 | 4,350 | −300 | 22.9551% | 180 |
| DEF | Taxable | Health care | 50 | 3,900 | 84 | 2.40 | 4,200 | 300 | 22.1636% | 120 |
| Total | 18,150 | 18,950 | 800 | 100% | 492 |
XYZ. 200 shares at $52 is $10,400 of value. You paid $9,600 in total, which is $48 a share, so the unrealized gain is $10,400 − $9,600 = $800, or 8.33% of what you put in. The dividend rate is $0.96 a share, so 200 × $0.96 = $192 a year. At the current price that rate is a forward yield of $0.96 ÷ $52 = 1.85%.
ABC. 150 shares at $29 is $4,350. The cost basis of $4,650 works out to $31 a share, so this row is down: $4,350 − $4,650 = −$300, a 6.45% unrealized loss. It is also the biggest payer by rate: 150 × $1.20 = $180 a year, a forward yield of $1.20 ÷ $29 = 4.14%. A high yield and a loss often travel together, because the yield rises as the price falls.
DEF. 50 shares at $84 is $4,200 against a $3,900 basis ($78 a share), so $300 unrealized, up 7.69%. Dividends are 50 × $2.40 = $120 a year, a forward yield of 2.86%.
The totals. Value adds to $10,400 + $4,350 + $4,200 = $18,950. Cost basis adds to $18,150. The two differ by exactly the unrealized P/L total: $800 + (−$300) + $300 = $800, which is 4.41% of what you invested. Yearly dividends add to $192 + $180 + $120 = $492 — about 2.60% of the $18,950 you hold, even though one of the three holdings yields over 4%.
Step 4 — Read the spread
The % of stock value column is where the sheet earns its keep. XYZ is 54.8813% of your stock money. Because XYZ is also your only technology holding and your largest row, the sector table and the position table say the same thing here: Technology 54.88%, Consumer 22.96%, Health care 22.16%.
Group the same rows by account instead and the picture changes. Taxable holds XYZ ($10,400) plus DEF ($4,200) = $14,600, or 77.04% of stock value; the IRA holds $4,350, or 22.96%. That matters for the dividends: $312 of the $492 is paid into the taxable account, where it is likely to be taxable in the year received, and $180 into the IRA.
One caution about the percentages: this sheet divides by the stock total only. It ignores cash and any open option positions, so it tells you how your stock money is split, not how your whole portfolio is split.
Where manual tracking breaks down
The sheet above is honest for exactly as long as you keep feeding it. The failure modes are specific.
- Prices go stale silently. Nothing in a spreadsheet tells you the $52 is three weeks old. The value, the percentages and the yields all inherit that staleness, and nothing looks wrong.
- Partial fills and partial sells. Buy 200 shares in three fills at three prices and you have to recompute average cost by hand. Sell 60 of them and you must split the row into a realized piece and a remaining piece, or the unrealized number quietly double-counts.
- Dividend reinvestment. Every DRIP purchase changes both share count and cost basis, often in fractional amounts. Miss two quarters and your share count — and therefore every figure on the row — is wrong.
- Assignment. A short put assigned at $45 puts 100 shares into the account at a basis you have to construct yourself. The broker reports the share purchase; whether you remember to fold the premium into your tracking view is up to you.
- Transferred shares. Shares moved in from another broker often arrive without a cost basis. They are genuinely yours and genuinely worth something, but you have no gain to measure, and a spreadsheet will happily show a huge fake profit against a basis of zero.
- Multiple accounts. Two accounts is manageable. Four, with the same symbol in three of them, means every allocation question becomes a pivot table you rebuild each time.
- Corrections. A fee adjustment or a re-booked trade from a month ago means editing a row you have already used in last month's numbers, and nothing reconciles the two.
- Sector labels drift. You classify by hand, so an ETF holding forty companies ends up filed under whatever sector you guessed, and your diversification reading is built on that guess.
How MetisTrades does it
MetisTrades builds the same view from your imported stock transactions. Go to Stocks → Overview (route /stocks/overview). Opening /stocks without a valid sub-tab sends you there, and the older /stocks/holdings and /stocks/allocation addresses both open Overview.
The summary strip
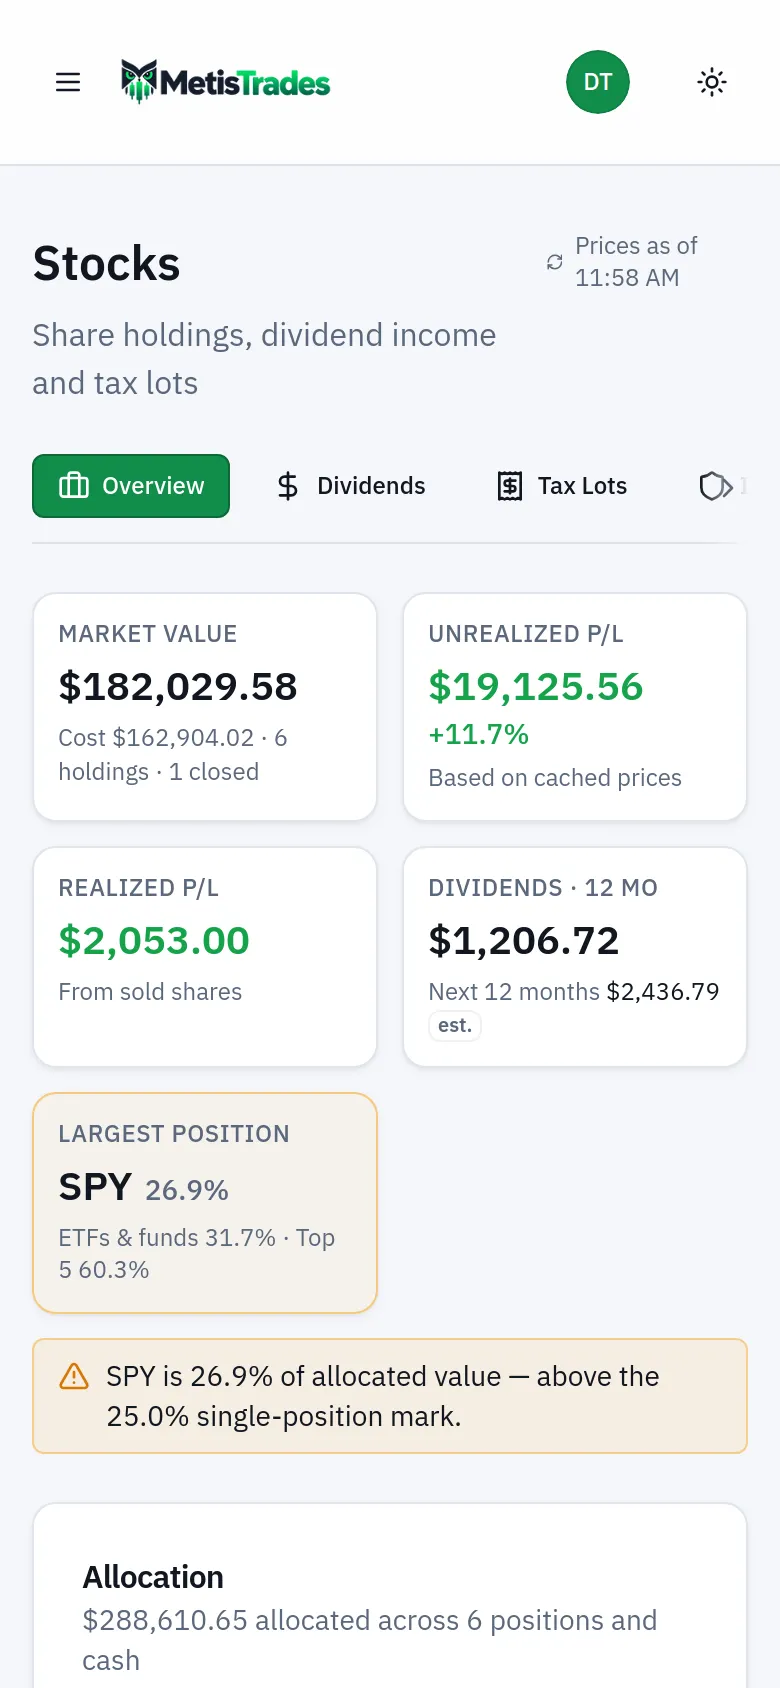
The page opens with one row of five tiles — two per row on phones:
- Market value, with Cost and the holdings count (N holdings · M closed) underneath. If no holding has a price, the tile is labelled Cost basis instead and points you to Open Positions to fetch prices. If some holdings are priced and others are not, an amber line counts how many are still at cost — no quote.
- Unrealized P/L, with its percentage of the priced cost basis beside it. In the worked example this would be the $800 and the 4.41%.
- Realized P/L, totalling results from sold shares — something the hand sheet does not track at all.
- Dividends · 12 mo, the dividend cash actually received in the trailing twelve months. In the owner view the supporting line adds Next 12 months, a forward estimate carrying an est. badge.
- Largest position and its share of allocated value, with Largest sector and Top 5 underneath. The tile turns amber when a concentration threshold is crossed, and the concentration warnings appear beneath the strip.
The strip counts every holding in the current account scope; the table filters below do not change it.
The Allocation card
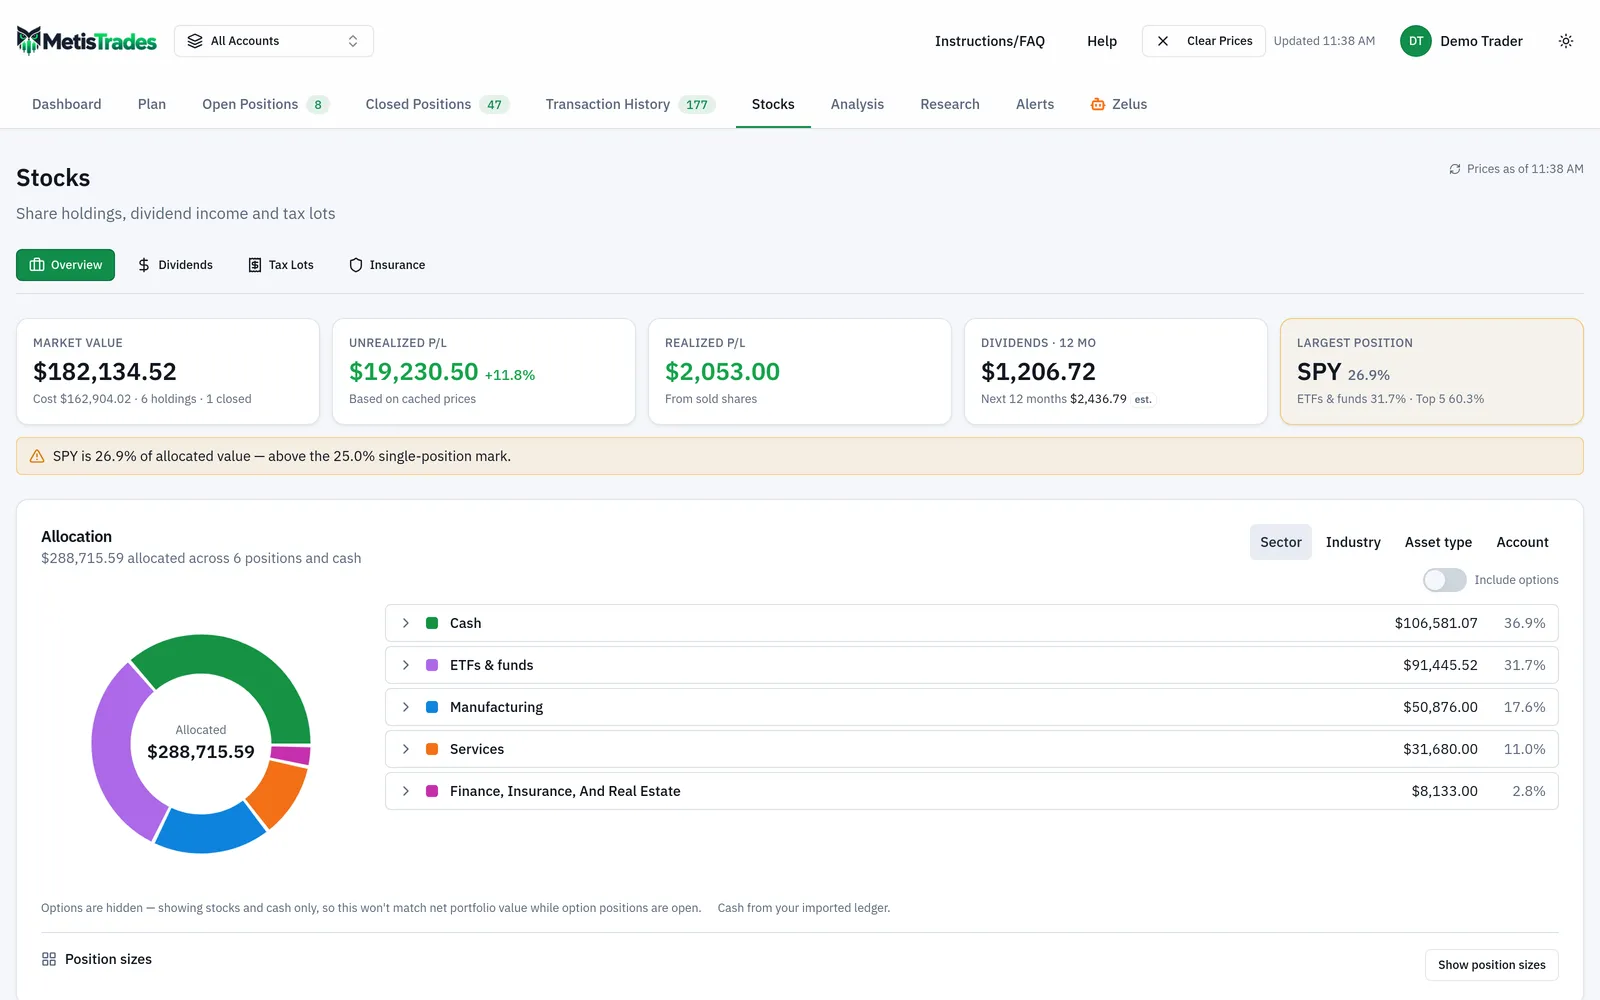
Below the strip, the Allocation card starts with the allocated dollar total and the number of positions, then lets you group by Sector, Industry, Asset type or Account — the two cuts you built by hand, plus two more.
If the portfolio has open option legs, an Include options switch appears. It is off by default, so the page opens in the stocks-and-cash-only scope: every % of portfolio, grouping and concentration figure counts shares and cash only, and a note says options are hidden. Turn it on and open option legs enter all of those figures for the rest of the visit; the choice is not remembered across reloads.
The donut charts only positive allocated value. Hover a slice for its name, dollar value, percentage and holding count; select a slice or a legend row to expand the holdings behind it. Entries valued without a market price carry at cost or at entry badges. Recognized funds go into an ETFs & funds bucket rather than a single company sector, with Unclassified for symbols with no sector on file and Cash when cash data is available.
Open short options are not charted as positive investments. They appear under Not shown in the chart as negative buy-back liabilities, ending with Net portfolio value — the positive allocated total plus those negative amounts.
Behind Show position sizes, a treemap draws every holding sized by value and coloured by the active grouping, with very small holdings optionally combined into one grey tile and a note saying how many were combined. Hide position sizes folds it away.
The screenshot below is the Overview page end to end. Look at how the summary strip, the allocation donut and the holdings table state the same allocation: a holding's % of portfolio in the table is exactly the slice the donut draws.
The holdings table
This is your sheet, rebuilt. Each row shows the company logo, symbol, company name and sector (or ETF / Fund), and a chart button that opens the symbol's price history without leaving the page. The columns include Account (when viewing all accounts), Status, Shares, % of portfolio with a small bar in the colour of its allocation slice, the basis column, Price, Market value, Unrealized P/L with its percentage, Realized P/L, and Div. yield — forward yield over the cached price with the annual rate per share underneath. The yield column is owner view only, shows — for a holding that pays nothing, and says paused when a payer has gone longer than its usual interval without paying.
Price, market value, unrealized P/L and yield say No quote for a held position with no cached price rather than leaving the cell blank. Show basis as switches the basis column between Plain, Adj: CC + Puts and Adj: All Income; the income-adjusted views are tracking figures, not tax cost basis. That choice is remembered; sort, funnel and search choices are not.
Every column header sorts, and the funnel icon in a header filters by Account, Symbol, Status, Unrealized P/L or Realized P/L. Search symbols… narrows by symbol or company name. A badge says how many holdings are shown of the total, and Clear filters resets everything at once. Filters change the table, its account subtotals and its Total row only — not the strip or the allocation card.
In the all-accounts view, holdings are grouped by account, ordered by account name, with unattributable holdings under Unknown account at the end. Each account header carries its active-symbol count and its cost basis, market value, unrealized and realized subtotals under the matching column headers, so they stay visible when a section is collapsed. On narrow screens the table scrolls sideways with the symbol column pinned.
Underneath, Account value over time can show dollar value — including Value today, Net contributions, Gain and Max drawdown — or percentage return, which compares the time-weighted return of the stock holdings without treating deposits as performance. A Stock Trade History table lists up to 25 stock transactions with date, symbol, type, shares, price and amount, with incoming transfers shown as Transfer.
How to read the results
Here is the same page on a phone.
Once you have the numbers, read them for what they actually measure.
Market value is a snapshot at a delayed price. Quotes in MetisTrades are delayed, and option marks come from the prior session's close or on-demand delayed quotes. A holding with no usable price is valued at cost and labelled at cost, both in the row and in the donut, so the total can mix fresh prices with booked cost. The data-status note says how many stock rows are without a quote and how many option legs are without a mark.
Unrealized P/L is an estimate of a gain you have not taken. The $800 in the worked example is not money until the shares are sold, and it moves with every price update. Realized P/L is the separate figure for shares already sold.
% of portfolio does not have to add to 100%. The percentages use positive allocated value, which includes cash and long options, not just the stock rows. Closed rows have no share at all. The Total row shows what the visible stock rows add up to, and reads Filtered total when a search or funnel is active. Short options are excluded from those percentages by design and disclosed separately as buy-back liabilities.
A Basis pending row is a holding, not a closed one. If a position's only shares arrived by transfer with no cost basis on file, it is still priced, valued and counted in the strip and the allocation, but its Unrealized P/L stays — until you enter a basis on its stock page, because there is no cost to measure against. That is the right answer to the transferred-shares problem the spreadsheet gets wrong.
Dividend figures split into two kinds. Dividends · 12 mo is cash actually received. Next 12 months is a projection from each symbol's own payment history, not declared dividends — which is why it carries an est. badge and why a payer can be marked paused.
Concentration is description, not advice. Overview describes exposure. The amber Largest position tile tells you a threshold was crossed; it does not say what your mix should be or whether a portfolio suits you.
Everything derived from imported transactions is an estimate. Tax-related figures in particular are estimates from your imported transactions, not tax advice, and not a substitute for your broker's 1099-B.
Common mistakes
- Reading allocation percentages as whole-portfolio percentages. Include options starts off, so the page opens in the stocks-and-cash-only scope. Turn it on when you want open option legs inside every grouping and % of portfolio figure.
- Treating forward yield as a fixed payout. Forward yield is the annual rate per share over the latest cached price, projected from the symbol's own payment history — not a declared dividend. Compare it with the Dividends · 12 mo cash actually received.
- Comparing a total that mixes priced and unpriced rows. Check the amber at cost — no quote line and the data-status note, and fetch prices on Open Positions before trusting the market value total.
- Assuming a filtered total is the portfolio total. Funnels and search change the table and its subtotals only; the strip and allocation card keep the full account scope. Watch for the Filtered total label and use Clear filters.
- Thinking a transferred position is closed because it shows no gain. A Basis pending row owns shares. Enter the transfer's cost basis on the symbol's stock page and the badge goes away.
- Using an income-adjusted basis as your tax number. Adj: CC + Puts and Adj: All Income are tracking views; keep Plain selected when you are reasoning about tax and rely on your broker's forms.
- Expecting an ETF under a company sector. Recognized funds sit in ETFs & funds, because one sector would misrepresent a diversified fund. Expand that legend row to see what is inside it.
Related guides and help pages
Related guides
- Cost basis and tax lots: tracking what each block of shares actually cost
- Plan, Track, Optimize: a complete tour of MetisTrades
- Tracking dividend income: received payments vs projected ones
- Shares Moved From Another Broker: Fixing Missing Cost Basis
- Premium-Adjusted Cost Basis for Covered-Call Holders
- Protecting a Stock Position With Options: Puts, Spreads and Collars