Protecting a Stock Position With Options: Puts, Spreads and Collars
Work out the real cost and the real floor of a protective put, a put spread and a collar on the same 400-share position, then see where MetisTrades designs and compares those hedges for you.

What it is and why it matters
Hedging a stock position means buying or selling options alongside shares you already own so that a decline in the share price costs you less than it otherwise would. You keep the shares. You add a contract that gains value when the stock falls, and you pay for that contract with cash, with upside, or with both.
Three terms do most of the work here.
- Put — an option giving its holder the right, but not the obligation, to sell the underlying at the strike (a fixed price) by expiration (the date the contract ceases to exist). If you own shares and own a put, you have a price you can sell at no matter how far the stock falls.
- Call — the mirror image: the right to buy at the strike. If you sell a call against shares you own, you collect premium now and accept the obligation to deliver shares at the strike if you are assigned.
- Premium — the price of the contract, quoted per share. One standard equity option contract covers 100 shares, so a premium of $1.80 costs $180 for one contract.
From those pieces come the three structures compared in this guide. A protective put is owned shares plus a long put: a floor under the position, paid for in cash. A put spread buys one put and sells a lower-strike put against it: cheaper, but the protection stops at the lower strike. A collar buys a put and sells a call: the call premium pays part or all of the put, and in exchange gains above the call strike are capped.
Two more ideas matter when you compare them. The protection window is the range of decline over which a structure actually adds protection. The hedge ratio is the portion of your shares that the contracts cover — hedge half your shares and you have half the protection.
Why care? Because the headline number traders quote — "the put cost 3.75%" — is not the number that matters. What matters is the worst outcome you are left holding, and that is the premium plus the distance between today's price and the strike. A hedge is insurance with a deductible, and both halves need pricing. Options involve risk, and a hedge changes the shape of that risk rather than removing it.
Work it out by hand
You own 400 shares of XYZ. The stock trades at $48.00, so the position is worth $48.00 × 400 = $19,200. You want cover for the next 90 days and you are looking at one expiration. The option quotes you are working from:
- $45 put, 90 days out: $1.80
- $38 put, same expiration: $0.55
- $55 call, same expiration: $1.05
400 shares at 100 shares per contract is four contracts, so every premium below is multiplied by 400.
Step 1: the protective put
Buy four $45 puts at $1.80. Cost: $1.80 × 400 = $720, which is $720 ÷ $19,200 = 3.75% of position value.
The deductible is the gap between today's price and the strike: $48.00 − $45.00 = $3.00 per share, or $1,200 across 400 shares. Your floor is the strike value minus the premium: ($45.00 × 400) − $720 = $18,000 − $720 = $17,280. The worst case is therefore $19,200 − $17,280 = $1,920, a loss of 10.00% — not 3.75%.
Check it at a 30% decline. XYZ at $48.00 × 0.70 = $33.60. Shares are worth $33.60 × 400 = $13,440. The put is in the money by $45.00 − $33.60 = $11.40, worth $11.40 × 400 = $4,560. Together: $13,440 + $4,560 − $720 = $17,280. The same floor, as expected.
On the upside the put expires worthless, so you break even at $48.00 + $1.80 = $49.80 and keep everything above that.
Step 2: the put spread
Buy four $45 puts at $1.80 and sell four $38 puts at $0.55. Net debit per share: $1.80 − $0.55 = $1.25. Cost: $1.25 × 400 = $500, or 2.60% of position value.
The protection window is $45 down to $38 — seven dollars wide, worth at most $7.00 × 400 = $2,800. Below $38 the short put offsets further gains in the long put, and the shares fall unprotected.
At $33.60 the spread is at its maximum: $13,440 + $2,800 − $500 = $15,740, a loss of $3,460, or 18.02%. If XYZ went to zero, you would hold $0 + $2,800 − $500 = $2,300, a loss of $16,900 (88.02%). The spread costs a third less than the plain put and protects over a defined band, not all the way down.
Step 3: the collar
Buy four $45 puts at $1.80 and sell four $55 calls at $1.05. Net debit: $1.80 − $1.05 = $0.75 per share, or $0.75 × 400 = $300 — 1.56% of position value.
The floor is the same strike as the protective put, but you paid less for it: $18,000 − $300 = $17,700, a worst case of $1,500 (7.81%). The price of that is the cap. If XYZ finishes above $55, the shares go at $55: ($55.00 × 400) − $300 = $22,000 − $300 = $21,700, a maximum gain of $2,500 (13.02%).
Step 4: the expected case
Suppose you think XYZ finishes 4% higher, at $48.00 × 1.04 = $49.92. Shares alone: $49.92 × 400 = $19,968, a gain of $768. Every hedge below that strike expires worthless, so each structure simply gives back its premium: the protective put leaves $19,248 (+$48), the spread $19,468 (+$268), the collar $19,668 (+$468). This is the honest cost of protection — in the case you consider most likely, the hedge is pure expense.
| Structure | Net cost | Cost as % of value | Protection window | Worst case at expiration | At −30% ($33.60) | Expected case (+4%, $49.92) | Upside |
|---|---|---|---|---|---|---|---|
| No hedge | $0 | 0.00% | None | Shares to zero | $13,440 (−$5,760) | $19,968 (+$768) | Unlimited |
| Protective put, 4 × $45 | $720 | 3.75% | $45 and below | −$1,920 (−10.00%) | $17,280 (−$1,920) | $19,248 (+$48) | Unlimited above $49.80 |
| Put spread, 4 × $45/$38 | $500 | 2.60% | $45 down to $38 | −$16,900 (−88.02%) if XYZ → $0 | $15,740 (−$3,460) | $19,468 (+$268) | Unlimited above $49.25 |
| Collar, 4 × $45 put / $55 call | $300 | 1.56% | $45 and below | −$1,500 (−7.81%) | $17,700 (−$1,500) | $19,668 (+$468) | Capped at $21,700 (+$2,500) |
Read the table across, not down. The cheapest hedge by cash is the collar, but it is the only one that gives up upside. The put spread is cheap and performs well at a −30% shock, but it is the weakest in a genuine collapse. The protective put is the most expensive and the only one with an unlimited upside and an unconditional floor.
What changes the outcome
Each item below changes exactly one number in the example above.
The strike you choose (your deductible)
Raise the put from $45 to $47 and say it quotes at $2.90. Cost becomes $2.90 × 400 = $1,160 (6.04%). The floor rises to ($47 × 400) − $1,160 = $17,640, a worst case of $1,560. You paid $440 more to cut the worst case by $360. Strikes closer to the money protect more and cost more, and the swap is rarely one-for-one.
Time to expiration
Take the same $45 strike 180 days out at $2.70. Total cost is $1,080 — more cash than the 90-day put — but $1,080 ÷ 6 = $180 per month against $720 ÷ 3 = $240 per month. Longer cover is usually cheaper per month and larger per cheque, and it locks your strike in place for longer.
Implied volatility
Implied volatility (IV) is the level of future movement implied by an option's market price. Protection is priced from it. If IV rises and the $45 put quotes $2.30 instead of $1.80, cost becomes $920 (4.79%) and the worst case widens to $2,120 (11.04%) for exactly the same strike. Buying protection after a scare is more expensive than buying it before one.
How much of the position you cover
Hedge 200 of the 400 shares with two $45 puts: $360 (1.88%). At $33.60 you hold $13,440 in shares plus $11.40 × 200 = $2,280 of put value, minus $360, for $15,360 — a loss of $3,840, or 20.00%. That is halfway between the fully hedged −10.00% and the unhedged −30.00%, because the uncovered shares fall one-for-one.
Where the cap sits on a collar
Move the short call from $55 to $52 at $2.05. Now the structure is a net credit of $2.05 − $1.80 = $0.25 per share, $100 received. The floor improves to $18,000 + $100 = $18,100 (worst case $1,100, or 5.73%), but the maximum gain drops to ($52 × 400) + $100 = $20,900, or +$1,700 against +$2,500. A collar that costs nothing is not free; it is paid for in upside.
How fills are priced
Quotes have a bid and an ask. Pricing conservatively means buying at the ask and selling at the bid. If the $45 put's ask is $1.90 and the $55 call's bid is $0.95, the collar costs $0.95 × 400 = $380 rather than $300 at the midpoint — about 27% more for the same structure. On wide or thin markets the difference is larger still.
Whether you hold or sell early
All the figures above value the options at expiration payoff. If you sell the put after 45 days instead, it will usually still carry some extrinsic value, which a hold-to-expiration calculation does not credit you with. Any estimate of that resale value is a model output, not a tradable price.
What is left out
Commissions, assignment mechanics, dividends, interest on cash and taxes are not in any of the arithmetic above. For a $300 collar, a few dollars of commission is a real share of the cost.
Where you see it in MetisTrades
The same comparison lives under Stocks → Insurance. The page designs and compares protective puts, put spreads, collars, fences and other candidate responses to a stock decline, using delayed market data. The Insurance sub-tab is visible in the normal Stocks page, but the analysis itself is Pro-only: an anonymous visitor sees Sign In Required with a Sign In button and a Start Free Trial link, and a signed-in non-Pro visitor sees Pro Feature with the trial call to action. Insurance is hidden on public share links.
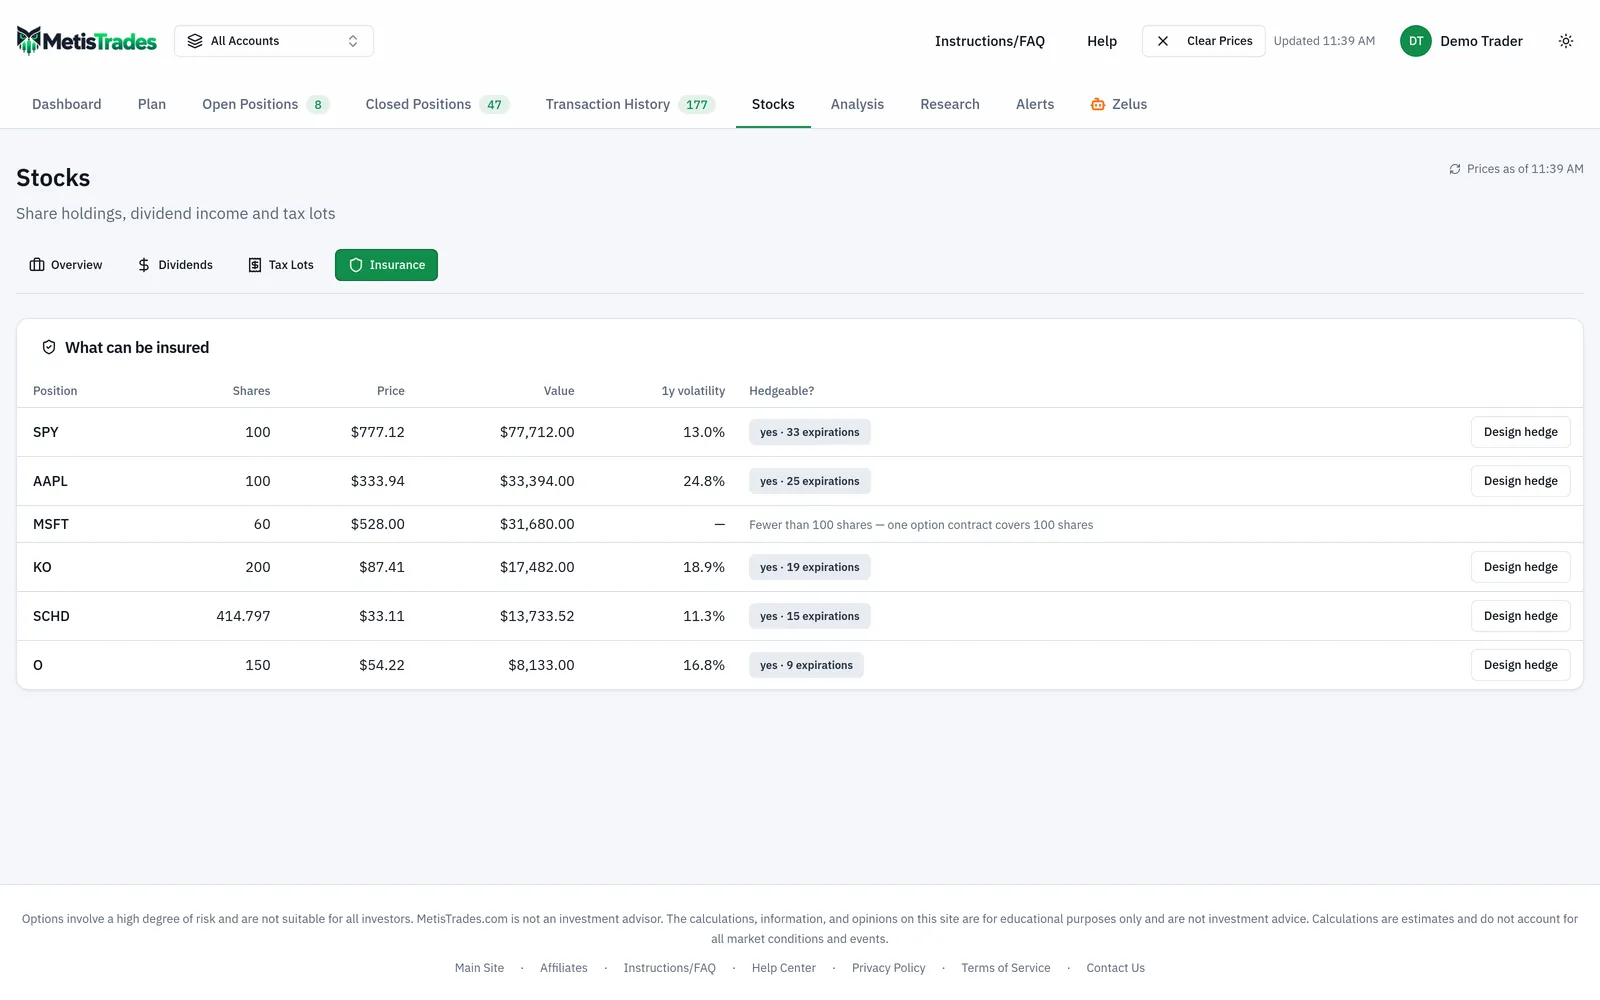
You start in What can be insured, a holdings overview with columns for Position, Shares, Price, Value, 1y volatility and Hedgeable?. The Shares and Value columns are the $19,200 figure from Step 1 of the hand calculation, taken from your imported stock activity. Eligible rows show yes · [count] expirations and a Design hedge button; ineligible rows give the reason instead. Look at how a holding's brief, candidates and expiration comparison sit together on the one page.
Selecting a row opens Hedge brief — [symbol], where you describe the protection in the same terms the arithmetic used. What you want protected asks for Protect until, How much of the position (25%, 50%, 75% or 100% — the whole position, which is the hedge ratio from the previous section), whether to Also plan for a crash?, I absorb the first drop of (your $3.00 deductible) and …and want cover down to (the $38 floor of the put spread). What you will pay for it asks for a Premium budget, an optional Never lose more than that starts blank with no hard limit, and Can gains be capped? — answering yes, with a …but no lower than figure, is what lets collars into the results.
Which expirations to price splits dates into Covers your full horizon and a folded list of Shorter expirations. The page selects the nearest listed expiration at or after your horizon by default; if none reaches it, the latest available expiration is selected and the page explains that shorter cover may require re-hedging. You can select up to four, which is how you reproduce the 90-day versus 180-day comparison from the section above.
Assumptions & modeling is folded by default and summarizes the active assumptions in its header. It holds My expected return by then — the +4% that produced the expected-case column — plus Pricing model (Conservative (buy ask / sell bid) or Midpoint of the spread), Extra scenarios to show (up to six percentage moves, each between −95 and 300, which is where a −30% scenario goes), and What happens to the hedge: Hold it to expiration or Sell it on a planned date.
Run analysis fetches option-chain data for the selected expirations and evaluates candidates; Save brief keeps the answers for that symbol. After brief changes, the current candidates are re-ranked without another fetch. Changing the expiration selection leaves the prior result visible with a warning until you run the analysis again.
Results open with Best candidates by goal, which highlights candidates that pass the brief and the liquidity screen. The candidate table's columns map directly onto the hand-built table: Structure, Cost (net premium as a percentage of position value — the 3.75% and 1.56% figures), Protection window (the $45-to-$38 band), Max loss (the $1,920 and $1,500 worst cases), Expected case, At −30%, Upside, Liq. and Status. The Liq. score runs 0–100 from the weakest leg's spread, open interest and volume. Expand a row for scenario outcomes, payoff detail and fuller metrics; chips plus Show constraint-failing and Show thin markets control what is listed.
Below that, Same protection, different expirations compares by Same strike or Equivalent delta, with columns for Expiration, Strike, Delta, IV, Theta/day, Premium, % of position, Est. value at exit, Net cost, Net cost / month and Rank. Net cost / month is the $240-versus-$180 comparison done for you. The page does not place orders: it designs and compares candidates, and the quotes behind them are delayed.
Common mistakes
- Quoting the premium as the worst case. The $45 put cost 3.75% but left a 10.00% worst case. Fix: add the premium to the gap between today's price and the strike before you call a hedge affordable.
- Treating a put spread as full protection. Below $38 the losses resume one-for-one. Fix: read the Protection window column and ask what happens to the shares past its lower edge.
- Forgetting the cap you sold on a collar. The $55 call turned an unlimited upside into a $2,500 maximum gain. Fix: compare the capped maximum with your own expected return before accepting the cheaper cost.
- Pricing at the midpoint and planning on it. The collar went from $300 to $380 when priced at ask and bid. Fix: re-run with Conservative (buy ask / sell bid) and see whether the ranking survives.
- Ignoring the liquidity score. A structure that wins on cost can be built from a leg almost nobody trades. Fix: check the Liq. score and treat results shown under Show thin markets with extra suspicion.
- Reading hold-to-expiration numbers when you intend to exit early. Expiration payoff values ignore remaining time value. Fix: set What happens to the hedge to Sell it on a planned date, and remember the resale figure is a model estimate with implied volatility held unchanged.
- Hedging part of the position but reading whole-position numbers. Two contracts against 400 shares gave −20.00% at the shock, not −10.00%. Fix: set How much of the position to match what you really intend to cover, and recompute the worst case for the shares actually covered.
Related guides and help pages
Related guides
- Plan, Track, Optimize: a complete tour of MetisTrades
- Cost basis and tax lots: tracking what each block of shares actually cost
- Seeing your stock holdings in one place: value, sector, account and income
- Tracking dividend income: received payments vs projected ones
- Shares Moved From Another Broker: Fixing Missing Cost Basis
- Premium-Adjusted Cost Basis for Covered-Call Holders