Cost basis and tax lots: tracking what each block of shares actually cost
A tax lot is one block of shares with its own purchase date and cost. Learn how to track lots by hand, match a sale to them with FIFO, split the result into short- and long-term gains, and what to do about transferred shares with no basis.
What it is and why it matters
A tax lot is a block of shares you acquired in one transaction. It keeps three things attached to it for as long as you own it: how many shares, the date you got them, and what they cost you. That cost is the cost basis of the lot.
Shares of the same ticker are interchangeable when you sell them, but their tax treatment is not. One hundred shares of XYZ bought in March 2024 and one hundred bought in June 2025 are the same asset in your account and two very different records on a tax return. The older block may have a bigger gain and may qualify as long-term — held more than one year. The newer block may have a smaller gain and be short-term — held one year or less. If you only track an average cost across all your shares, you throw away the information that decides which is which.
When you sell, something has to decide which lot the sale came out of. The usual default is FIFO, first in, first out: the oldest available lot is used first, then the next oldest, until the sale quantity is covered. A single sale can therefore produce several records, each with its own acquisition date, basis, gain and term.
This matters for three practical reasons. First, your realized gain for a year is the sum of those matched pieces, not one number you can eyeball from a running balance. Second, holding period changes how a gain is taxed, so knowing that a lot crosses into long-term territory next month is useful before you sell it, not after. Third, shares that arrive by transfer from another broker usually arrive without their purchase history, and until you supply the original cost there is no honest way to calculate a gain on them.
None of this is tax advice, and nothing here replaces the official forms your broker files. The point of tracking lots yourself is to understand the shape of your own records well enough to read a broker statement critically and to see what is coming.
How to track it by hand
Two sheets are enough: one listing every purchase, and one listing every piece of a sale. The second refers back to the first by a lot ID, so each matched piece keeps the date and cost of the shares it actually consumed.
Sheet 1: Lots
One row per purchase. Give each lot a unique ID — L1, L2, L3 — because the sales sheet will look it up. Record the symbol, the buy date, the number of shares, the price per share and any fees. Everything else is computed.
| Lot ID | Symbol | Buy date | Shares | Price / share | Fees | Cost basis | Basis / share | Shares sold | Shares left |
|---|---|---|---|---|---|---|---|---|---|
| L1 | XYZ | 2024-03-04 | 100 | 40 | 0 | 4000 | 40 | 100 | 0 |
| L2 | XYZ | 2025-06-10 | 100 | 48 | 0 | 4800 | 48 | 50 | 50 |
| L3 | XYZ | 2026-02-02 | 50 | 52 | 0 | 2600 | 52 | 0 | 50 |
The arithmetic is deliberately dull. Cost basis is shares times price plus fees: 100 × 40 + 0 = 4000 for L1, 100 × 48 = 4800 for L2, 50 × 52 = 2600 for L3. Basis per share is the lot's cost basis divided by its share count, so 4000 ÷ 100 = 40, 4800 ÷ 100 = 48, 2600 ÷ 50 = 52. Fees belong in the lot, not in a separate expense column, because they are part of what the shares cost you.
The last two columns are where the two sheets connect. "Shares sold" sums every row in the Sales sheet that points at this lot ID; "Shares left" is the original quantity minus that. L1 shows 100 sold and 0 left, L2 shows 50 sold and 50 left, L3 has not been touched. Total cost basis across all three lots is 11400, and shares still held is 50 + 50 = 100.
Sheet 2: Sales
One row per lot a sale draws from, not one row per sale. This is the single most important habit in the whole exercise. On 2026-03-16 you sell 150 shares of XYZ at 55. FIFO takes the oldest lot first: all 100 shares of L1, then 50 of the 100 in L2. That is one broker confirmation and two rows here.
| Sale date | Lot ID | Shares sold | Sale price | Fees | Buy date | Basis / share | Proceeds | Cost basis | Gain / loss | Days held | Term |
|---|---|---|---|---|---|---|---|---|---|---|---|
| 2026-03-16 | L1 | 100 | 55 | 0 | 2024-03-04 | 40 | 5500 | 4000 | 1500 | 742 | Long |
| 2026-03-16 | L2 | 50 | 55 | 0 | 2025-06-10 | 48 | 2750 | 2400 | 350 | 279 | Short |
Only four cells per row are typed: the sale date, the lot ID, the shares taken from that lot, and the sale price. The buy date and basis per share are looked up from the Lots sheet using the lot ID, which is why the IDs have to be unique.
Row one: proceeds are 100 × 55 − 0 = 5500. Cost basis is 100 shares at L1's basis of 40 per share = 4000. Gain is 5500 − 4000 = 1500. Days held is 2026-03-16 minus 2024-03-04 = 742 days, comfortably more than a year, so the term is Long.
Row two: proceeds are 50 × 55 = 2750. Cost basis is 50 shares at L2's basis of 48 per share = 2400. Gain is 2750 − 2400 = 350. Days held is 2026-03-16 minus 2025-06-10 = 279 days, so the term is Short.
Both rows sold at the same price on the same day, and the gains are 1500 and 350 — different sizes, different tax treatment — purely because they came from different lots. Totalling by term gives a short-term gain of 350, a long-term gain of 1500, and total realized of 1850.
The template below already contains these three lots, both sale rows and every formula described here, so you can replace the example data with your own.
Download the template: Tax lot tracker spreadsheet (.xlsx). It opens in Excel, and in Google Sheets via File → Import. The worked example from this guide is already filled in, and the formulas carry down into the blank rows.
Two notes on the holding-period test. The sheet approximates long-term as more than 365 days, which is close enough to read a position but not the legal rule: the first day a sale counts as long-term is the day after the one-year anniversary of acquisition, and leap years shift the day count. If a sale lands within a few days of that boundary, check the dates rather than the day count. Second, the sheet does not make wash sale adjustments — the rule that can defer a loss when you buy back a substantially identical security inside the relevant window. If you sell at a loss and re-buy soon after, the gain or loss figure in the sheet is not the final answer.
Where manual tracking breaks down
The three-lot example is easy because every row is clean. Real brokerage history is not, and the failure modes are specific.
- Partial fills. An order for 300 shares can fill in four pieces at four prices. That is four lots, not one, and if you record a single averaged row you have already lost the per-lot basis you were trying to keep.
- Dividend reinvestment. A DRIP creates a new lot every payment, often for fractional shares, each with its own acquisition date. A quarterly payer on a five-year holding is twenty extra lots nobody enters by hand.
- Assignments. A short put assigned at the strike buys shares — that is a new lot with an acquisition date you did not choose. A covered call assigned sells shares — a disposal, matched to lots, except the matching is not always plain FIFO. When a call-assignment sale can be linked to the shares a put assignment delivered, those two belong together, and a strict oldest-first sheet will pair the sale with the wrong block.
- Stock splits. A split restates the lot, not the money. The quantity is multiplied by the ratio and the cost per share divided by it, so the lot's total cost and its acquisition date are unchanged. A 1-for-50 reverse split turns 1,000 shares at $0.1905 into 20 shares at $9.525 — the same $190.50. Done wrong in a spreadsheet, a split silently rewrites both the basis and the holding period. To make matters harder, some brokers report a split as a transfer out and a transfer back in.
- Transferred shares. An ACAT transfer in proves you own the shares and tells you nothing about what they cost at the previous broker. Until you supply the original cost per share, there is no basis and no gain to calculate — and treating them as zero-cost is worse than leaving the cell blank.
- Multiple accounts. Lots do not cross account boundaries. A sale in one account cannot consume a lot held in another. One combined sheet per ticker quietly breaks this and produces gains that match nothing your broker reports.
- Corrections and missed rows. Every late edit — a lot ID typed wrong, a sale row never added, a buy pasted twice — propagates through every subsequent FIFO match for that symbol, because lot consumption is sequential. One missing purchase in 2023 can change the term on a sale in 2026.
None of this is impossible by hand. It is just unforgiving: the work is cumulative, the errors are quiet, and you usually discover them in the week you are trying to reconcile a tax year.
How MetisTrades does it
MetisTrades builds the same two sheets from your imported transactions, with the same per-lot logic and the same honesty about what it does not know. Everything it produces here is an estimate from the transactions in your account, not your broker's records.
Start on Stocks → Overview
Top nav → Stocks → Overview is the position-level view. Each holding row shows its Shares, the basis column (per share, with total cost basis underneath), Price, Market value, Unrealized P/L and Realized P/L. The Shares column identifies transferred shares separately, and can say basis set when a cost basis has been entered or indicate that cost basis is pending.
A row whose only shares arrived by transfer with no cost basis on file is marked Basis pending. It is still a held position — it shows shares, price, market value and % of portfolio like any other row — but its Unrealized P/L stays —, because there is no cost to measure a gain against.
Fill in the missing basis for transferred shares
Open the symbol's row from Stocks — Overview and find the Transfers in section. Each stock transfer shows its date, share quantity, and either the saved basis per share or basis missing. Choose Enter cost basis to open the dialog titled Enter transfer cost basis. The Shares field starts with that transfer's quantity; enter the number of shares the basis applies to and the original Cost/share from your previous broker — not the market price on the transfer date. The dialog shows Total cost basis as cost per share times shares. Save cost basis records it; an existing entry can be changed with Edit cost basis or removed with Clear.
The entry is tied to that specific transfer and scoped to that transfer's trading account, so basis entered in one account does not fund transferred shares of the same symbol in another. Only the signed-in owner can enter or edit it; a public share viewer cannot. Saving or clearing refreshes stock research, holdings, tax lots and account data.
Read the lots on Stocks → Tax Lots
Top nav → Stocks → Tax Lots (route /stocks/taxlots) is the full report. It replays your imported stock buys, sells, transfers in and transfers out in date order. Ordinary sales consume purchased lots first in, first out, oldest first; if purchased lots do not cover the sale, transferred-share lots are consumed next in FIFO order. There is a targeted exception: when a call-assignment sale can be linked to shares acquired by a put assignment, the sale consumes the paired put-assignment lot first, which keeps the stock in-and-out portion of a wheel round trip together. A legacy rule also lets an ordinary sale zero to three days after a put assignment consume that assignment lot first. After those exceptions, matching returns to strict FIFO. Lot replay is isolated by account.
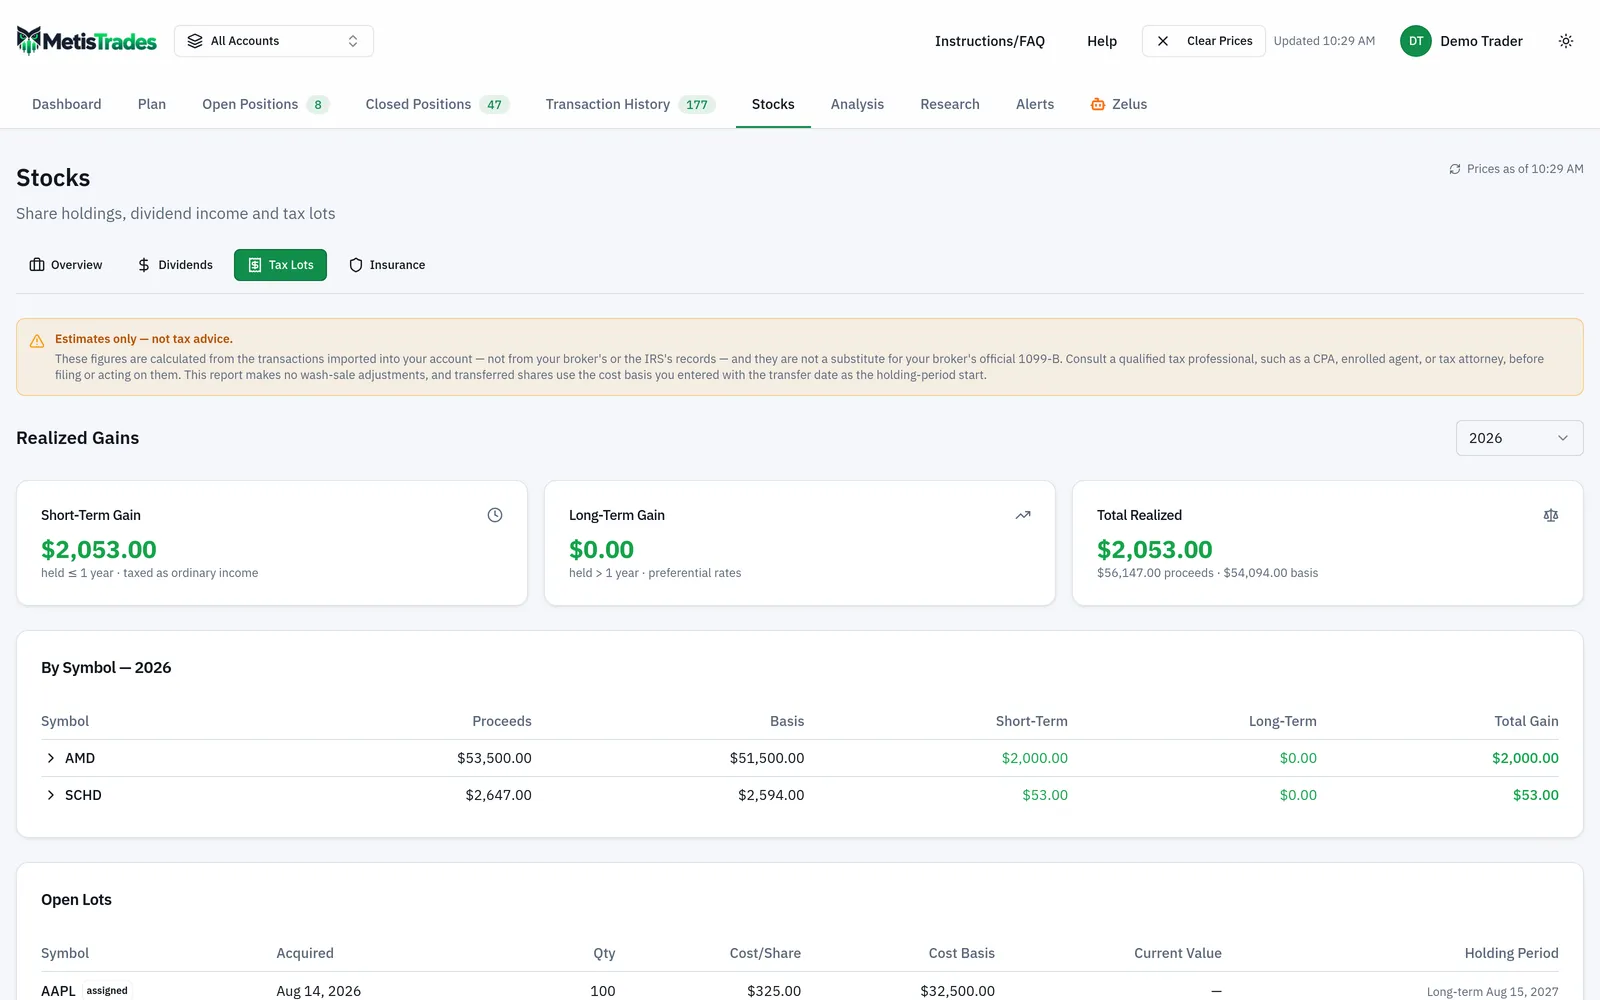
The page opens with a standing notice — Estimates only — not tax advice — followed by Realized Gains with a Tax year selector and three summary cards: Short-Term Gain, Long-Term Gain and Total Realized. Below that, By Symbol — [year] lists Symbol, Proceeds, Basis, Short-Term, Long-Term and Total Gain, and expands to show each disposed lot's Acquired, Sold, Qty, Proceeds, Basis, Gain and Term. Lot badges can identify assigned, exercised, transfer or called away activity. The Open Lots table underneath shows Symbol, Acquired, Qty, Cost/Share, Cost Basis, Current Value and Holding Period.
In the demo portfolio below, note how the year selector drives the three realized cards and how each open lot carries its own acquisition date and holding-period status.
Tax Lots is built from stored transactions, so it requires a signed-in account or a public share link; the sub-tab is hidden in the anonymous CSV-only flow. Pro users can use it with their saved data, and someone holding a public share link can see the read-only Tax Lots view for the shared account.
How to read the results
The three realized cards are the same split you produced by hand. Short-Term Gain covers disposed lots held no more than one year, Long-Term Gain covers lots held more than one year, and Total Realized is the two added together, shown with proceeds, basis and any count of lots missing basis. In the worked example those would read 350, 1500 and 1850. The tax year comes from the normalized sale date, and the selector lists only years that contain at least one disposed lot, defaulting to the most recent.
Expanding a symbol shows why a total looks the way it does. One sale producing several rows is normal, not a duplicate: each matched portion keeps its own acquired date, basis, gain and term, exactly as L1 and L2 did above. Term is shown as Short or Long.
A blank Gain means the matched lot has no usable basis. The report does not invent one. If a sale exceeds every known purchased and transferred lot, the unmatched quantity still appears as a disposed row with missing basis rather than silently dropping the proceeds — which is a signal that an opening transaction is absent from your import, not that the shares were free.
In Open Lots, Holding Period appears as Long-term, Long-term in [days]d, or the date on which long-term status begins. The first long-term sale date is the day after the lot's one-year acquisition anniversary. A lot reaching that date within the next 60 days is treated as approaching long term. Current Value is open-lot quantity times the latest available price and is blank when no price is available; it uses delayed quotes and is not disposal proceeds.
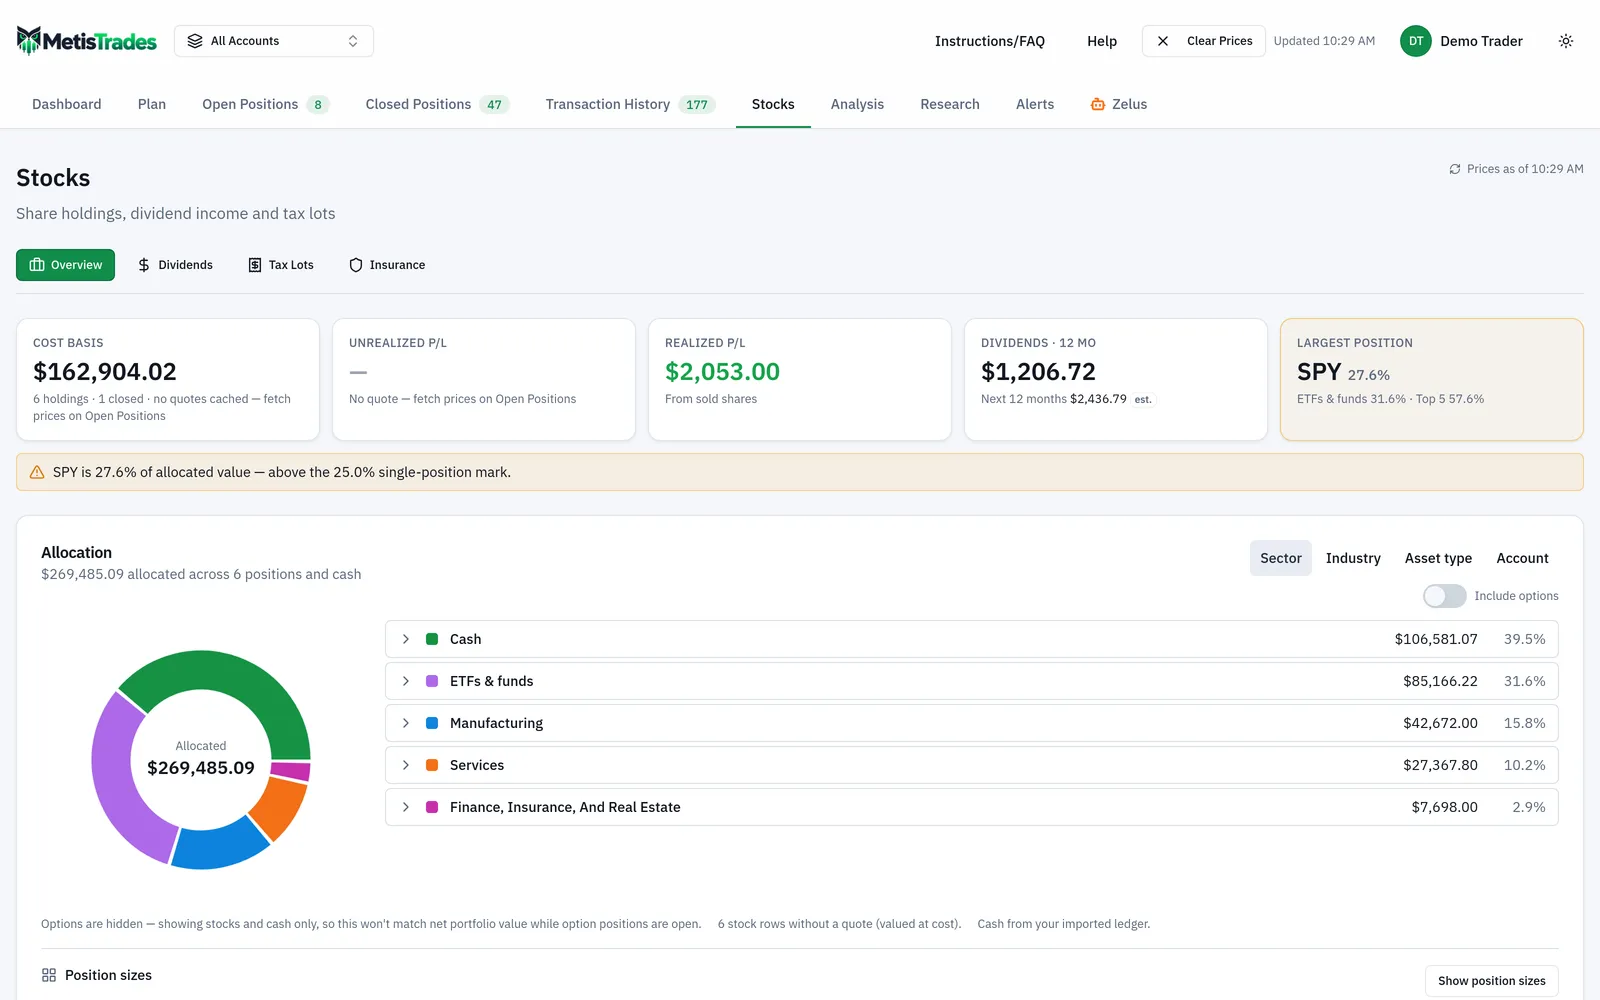
Cost and value sit side by side on the Overview holdings table, which is a quick way to sanity-check a lot report against what you think you own.
Now what these numbers do not mean. They are estimates calculated from the transactions imported into your account, not from your broker's or the IRS's records, and they are not a substitute for your broker's 1099-B. There are no wash-sale adjustments anywhere in the report. For transferred shares the holding-period clock starts on the transfer date, because the earlier purchase history is not in the imported ledger — so a transferred lot can be labelled short-term even though you bought the shares years ago at the old broker. Unparseable or missing acquisition dates are treated conservatively as short term for disposed lots. Assignment matching needs a same-day stock row for the expected share quantity; split fills or several identical same-day assignments may not link cleanly and can fall back to ordinary FIFO. And the Adj. basis option behind Show basis as on Overview is a tracking view that reduces plain basis by selected option-income buckets — useful for seeing what a position has really cost you after premium, but it is not tax cost basis. Consult a qualified tax professional before filing or acting on any of it.
Common mistakes
- Tracking one average cost per ticker instead of per lot. Averaging destroys the acquisition dates that decide short versus long term. Fix: keep one row per purchase, with its own ID, from the first buy.
- Recording one row per sale instead of one row per lot consumed. The 150-share sale above is two records with different terms. Fix: split the sale across lots at the moment you enter it.
- Treating 365 days as the long-term line. The first long-term sale date is the day after the one-year anniversary, not day 366 by arithmetic. Fix: check the calendar dates on any sale near the boundary.
- Entering the transfer-date market price as a transferred lot's basis. That invents a gain or loss that never happened. Fix: use the original Cost/share from the previous broker's records in the Enter transfer cost basis dialog.
- Leaving transferred shares as basis missing and wondering why there is no gain. The shares are counted and valued, but Unrealized P/L stays blank with nothing to compare against. Fix: enter the basis on that symbol's page, in the account the transfer belongs to.
- Merging accounts into one lot ledger. A sale in one account cannot consume a lot from another, and basis entered for one account's transfer does not cover the same ticker elsewhere. Fix: track and read lots per trading account.
- Expecting wash-sale handling or treating the report as a 1099-B. Neither the spreadsheet nor the Tax Lots report makes wash-sale adjustments. Fix: reconcile against your broker's official forms and get professional advice before filing.
Related guides and help pages
Related guides
- Plan, Track, Optimize: a complete tour of MetisTrades
- Seeing your stock holdings in one place: value, sector, account and income
- Shares Moved From Another Broker: Fixing Missing Cost Basis
- Premium-Adjusted Cost Basis for Covered-Call Holders
- Your covered call is in the money: let it go, roll up and out, or buy it back?
- Why your broker's realized P/L disagrees with your journal