Tracking dividend income: received payments vs projected ones
How to keep a dividend log that separates cash you actually received from estimates of what is coming, with a worked example, the arithmetic behind each column, and how MetisTrades shows the same two views.

What it is and why it matters
A dividend is a payment a company makes to its shareholders. If you own 200 shares of a stock that pays 24 cents per share, you receive $48 on the pay date. That is the whole mechanic. The difficulty is not the arithmetic; it is keeping an honest record of it over years, across symbols, and across accounts.
Two dates matter. The ex-dividend date is the date on which buying the stock no longer qualifies you for the next declared payment — you generally need to own the shares before it. The pay date is when the cash actually arrives. Your broker statement records the pay date, so that is the date your log should use. A payment can be declared in one month, go ex in another and pay in a third; if you log declaration dates you will never reconcile your log with your statement.
There is a second, bigger split that most spreadsheets get wrong: the difference between dividends you have received and dividends you expect to receive. Received dividends are facts. They appear in your transaction ledger with a date and an amount. Projected dividends are estimates built from a symbol's past payment behaviour — a company can raise, cut, suspend or skip a dividend at any time, and nothing obliges it to repeat what it did last quarter.
If you mix the two in one column, you lose the ability to answer the only two questions worth asking. "How much dividend income have I actually collected?" is a bookkeeping question with a single correct answer. "Roughly how much might I collect over the next year if nothing changes?" is a planning question with a range of possible answers. Blend them and you have a number that answers neither.
Two more details shape the record. Withholding — tax taken at source, common on foreign payers — means the gross dividend and the cash in your account differ, and you want both figures. And DRIP (a dividend reinvestment plan) means the cash never sits in your account at all; it buys more shares. DRIP income is still income, and the extra shares change the share count used for the next payment.
How to track it by hand
Keep received dividends on one sheet, one row per payment, exactly as the payment appears on your statement. Keep any forward estimate on a separate sheet so the two can never be summed together by accident.
The received-dividends sheet
Seven columns do the job. You type four of them — pay date, symbol, shares held for that payment, and dividend per share — plus any tax withheld. The sheet computes the rest.
| Pay date | Symbol | Shares | Dividend / share | Withheld | Gross | Net received | Symbol total to date |
|---|---|---|---|---|---|---|---|
| 2026-01-15 | XYZ | 200 | 0.24 | 0 | 48 | 48 | 48 |
| 2026-02-10 | ABC | 100 | 0.51 | 0 | 51 | 51 | 51 |
| 2026-03-12 | DEF | 50 | 0.80 | 6 | 40 | 34 | 34 |
| 2026-04-15 | XYZ | 200 | 0.25 | 0 | 50 | 50 | 98 |
| Totals | 6 | 189 | 183 |
Walk the rows. On 15 January, XYZ paid 0.24 per share on 200 shares, so Gross is 200 × 0.24 = 48. Nothing was withheld, so Net received is 48 − 0 = 48. That is the first XYZ payment, so the running symbol total is 48.
On 10 February, ABC paid 0.51 on 100 shares: 100 × 0.51 = 51 gross, nothing withheld, 51 net, and 51 as its own first symbol total.
On 12 March, DEF paid 0.80 on 50 shares: 50 × 0.80 = 40 gross. Six dollars was withheld at source, so the cash that landed in the account was 40 − 6 = 34. This is the row that shows why you need both columns. The company paid you 40; you banked 34. Logging only the 34 understates the dividend the company declared, and logging only the 40 overstates your cash.
On 15 April, XYZ paid again, this time at 0.25 — a small raise. 200 × 0.25 = 50 gross, 50 net. The running total for XYZ now reads 98, which is the 48 from January plus the 50 from April. That column is a SUMIF that adds every earlier net amount for the same symbol, so each row tells you what that holding has paid you to date without a pivot table.
The three computed formulas, where {r} is the row number:
- Gross:
=IF(A{r}="","",N(C{r})*N(D{r})) - Net received:
=IF(A{r}="","",F{r}-N(E{r})) - Symbol total to date:
=IF(A{r}="","",SUMIF($B${first}:B{r},B{r},$G${first}:G{r}))
At the bottom, the totals read: gross dividends 189, withheld 6, net received 183. Those three numbers are the entire received side of your dividend record for the period. The template below already contains these rows and formulas, so you can delete the sample data and start logging your own.
Download the template: Dividend income log (.xlsx). It opens in Excel, and in Google Sheets via File → Import. The worked example from this guide is already filled in, and the formulas carry down into the blank rows.
The estimate sheet
On the second sheet, build a forward figure per holding rather than per payment. XYZ last paid 0.25 per share and pays quarterly, so its estimated annual rate is 0.25 × 4 = 1.00 per share. On 200 shares that is an estimated $200 over the next twelve months. Write it down as an estimate, dated, with the per-share figure and the assumed number of payments per year beside it, so that when the company changes its dividend you can see exactly which assumption broke.
Two sanity rules keep the estimate sheet honest. Exclude one-off special dividends from the annual rate, or every future quarter inherits a payment that was never going to repeat. And if a payer misses its usual interval, stop projecting for it until it pays again — a paused dividend that you keep forecasting is the most expensive kind of spreadsheet error, because it inflates every planning number downstream.
Reinvestment and yield on cost
If a payment was reinvested, log the income exactly as above and record the shares purchased in a note column, then update the share count used for the next payment. For yield on cost, divide the trailing twelve months of income for a symbol by the cost basis of the shares you currently hold. It is a useful sense of what your original purchase is yielding now, and it is not comparable to the quoted yield on the stock today.
Where manual tracking breaks down
The sheet above works. It stops working for specific, predictable reasons.
- Missed rows. A dividend is a small line buried among trades, fees and interest on a monthly statement. Miss one quarter on one holding and every total from that point is wrong, with nothing to flag it.
- Reinvestment. With DRIP on, no cash appears to count. The income shows up as a purchase, and the share count drifts upward every quarter. Keeping the Shares column accurate becomes a second bookkeeping job.
- Share counts that changed mid-quarter. You added 50 shares after the ex-date, so the payment covers the old share count, not the new one. Reconstructing which count applied to which payment, months later, is guesswork.
- Withholding and fees. Foreign payers, ADR fees and corrections all break the clean "shares × rate" identity, so your computed gross stops matching the statement and you cannot tell which figure is wrong.
- Multiple accounts. The same symbol pays into a taxable account and a retirement account on the same day at different share counts. Two sheets means two sets of totals and no combined view; one sheet means you have to tag every row by account.
- Corrections and reclassifications. Brokers restate payments — a dividend reclassified as return of capital, or an amount adjusted after the fact. A hand-typed row does not update itself.
- Payments that cannot be tied to a ticker. Cash interest, fund distributions and miscellaneous credits land in the same place and quietly inflate "dividend income" if you are not careful about what you log.
- Estimates going stale. The forward sheet is only as good as the day you last touched it. Dividend cuts and suspensions do not announce themselves in your spreadsheet.
How MetisTrades does it
MetisTrades builds the same two views from your imported broker transactions, and keeps them apart by design: received amounts are never blended into projected amounts.
Getting to the page
Go to Stocks → Dividends in the top nav (route /stocks/dividends). The Stock Research page can also link you to the dividend calendar. Anonymous visitors can use Dividends after uploading transactions into their browser session, where nothing is saved. Pro users and admins see both payment history and the owner-scoped forecast; a signed-in member without active access is sent to Account Settings instead.
The summary cards
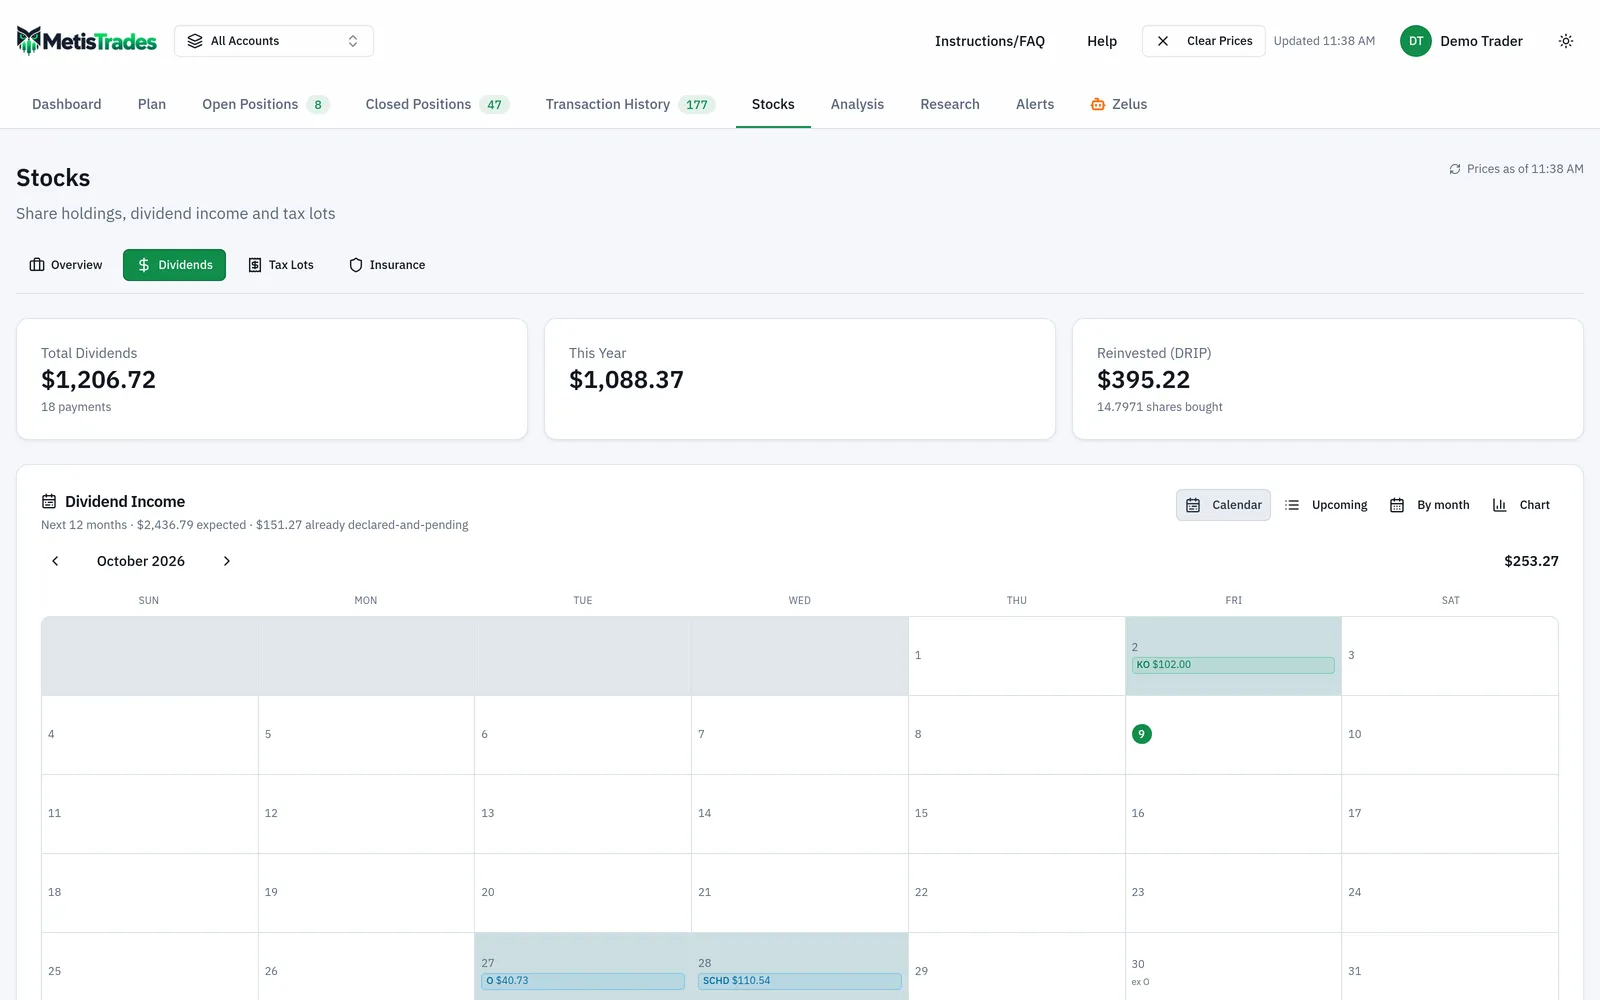
At the top, Total Dividends shows all-time dividend income and the payment count — the equivalent of the 183 net total on your sheet, plus the number of rows behind it. This Year shows year-to-date income. Reinvested (DRIP) shows dividend money paired with reinvestment activity and, when available, the shares bought, which is the column you would otherwise maintain by hand.
Trailing twelve-month income is not repeated on this page. It sits in the Dividends · 12 mo tile of the Stocks: Overview summary strip, where the owner view adds a Next 12 months figure carrying an est. badge.
Dividend Income
This card is where the history and the schedule live side by side. When a forecast is available it offers Calendar, Upcoming, By month and Chart views. In the chart, solid bars are received payments and lighter future bars are projected, so the boundary between fact and estimate is visible at a glance. The calendar can include received events alongside future ones, and forward events carry status labels that distinguish a confirmed pending payment from a projected one.
The chart starts with a 12-month history window; longer windows are offered only when they would otherwise hide some history, and All remains available. If the selected range has no activity, the page says No activity in the selected range — showing all history. If no schedule can be projected, the card says No upcoming dividends. Holdings need a payment history before a schedule can be projected.
The two cuts you built by hand — totals by month and totals by symbol — are the ones this page leads with.
Dividends by Symbol
Below the chart, the owner table lists Symbol, Cadence, Annual Rate, Fwd Yield, Total Received, Last 12 Mo, Next 12 Mo, Yield on Cost, Reinvested and Next Pay. Rows can be marked Held or Closed, and payments that cannot be tied to one ticker are grouped under Other / no symbol.
Expand a symbol to see its payment count, first and latest dates, the individual payments and reinvestment details — your per-row log, reconstructed from the ledger. In the owner view, expanded forecast detail can also show dividend growth over 1, 3 and 5 years, the last ex-date and latest amount per share, the approximate ex-date-to-pay-date lag, upcoming payment dates and amounts, and whether special dividends were excluded from the rate. A cadence can be marked paused when a payer has missed its usual interval, or unsure when the history is too limited or uneven.
If there are no recorded payments and no projected payer rows, the page shows No Dividends Recorded and explains that payments appear automatically when imported broker data contains them.
On a public share link, viewers see dividend history for the shared portfolio only. Forward-only columns are removed and the history table instead ends with Payments and Latest; the forecast is owner-scoped.
How to read the results
Total Dividends is the sum of dividend payment transactions in your imported history. It is bookkeeping, not performance: it says nothing about whether those holdings gained or lost value. This Year is the same measure restricted to the current calendar year, which is why it can look small in January and jump in a heavy payment month.
Annual Rate is the current per-share payment multiplied by the estimated number of payments per year — the 0.25 × 4 = 1.00 calculation from your estimate sheet. Fwd Yield is that annual rate divided by the current share price, and the quotes behind it are delayed, so treat it as approximate rather than a live market figure.
Yield on Cost is trailing twelve-month income divided by the FIFO cost basis of shares you currently hold. It is blank unless you hold shares, have positive trailing income, and have a known positive cost basis. It measures what your purchase price yields today; it is not a forecast and it is not comparable across holdings bought at different times.
Cadence is the inferred payment interval. When it reads paused or unsure, treat the forward figures for that symbol with extra caution — that is the page telling you the history is a poor guide. A confirmed pending payment is declared but not yet received; a projected one is an estimate based on prior payment behaviour, with no declaration behind it.
Reinvested (DRIP) is dividend income matched with a reinvestment purchase. It is a subset of your income, not an addition to it — do not add it to Total Dividends.
What none of these numbers are: guarantees. All received totals and reinvestment matches derived from imported transactions are estimates, and every forward amount, date, cadence, growth figure and yield is an estimate rather than an announced-dividend guarantee or investment advice. A changed, suspended, irregular or special dividend can make prior cadence a poor guide. Likewise, any tax-related figure here is an estimate produced from your imported transactions — it is not tax advice and not a substitute for your broker's official forms.
Common mistakes
- Adding projected income to received income. One is cash in hand, the other is a model of past behaviour. Fix: keep them on separate sheets by hand, and read received and Next 12 Mo figures as separate numbers in the app.
- Logging the net cash and calling it the dividend. With withholding, the DEF row pays 40 gross but banks 34. Fix: record gross, withheld and net as three columns so both figures survive.
- Using the declaration or ex-date as the log date. Your statement is organised by pay date, so a log keyed to any other date will never reconcile. Fix: log the pay date and track the ex-date separately if you need it.
- Letting DRIP drift the share count. Reinvested shares change the base for the next payment, and an out-of-date Shares column quietly corrupts every computed gross. Fix: update shares at every reinvestment, or let imported transactions carry the share count for you.
- Leaving special dividends in the annual rate. One extraordinary payment multiplied by four becomes a forecast that was never going to happen. Fix: exclude specials from the rate and check the expanded detail for whether they were excluded.
- Forecasting a payer that has stopped paying. A missed interval is a signal, not a rounding error. Fix: stop projecting when the cadence is marked paused, and re-check the symbol before relying on its forward figures.
- Treating cash interest and miscellaneous credits as dividends. They inflate your income total and distort yield on cost. Fix: only log payments you can tie to a shareholding, and review anything grouped as Other / no symbol.
Related guides and help pages
Related guides
- Plan, Track, Optimize: a complete tour of MetisTrades
- Dividends plus covered calls: one calendar, one income ledger
- Cost basis and tax lots: tracking what each block of shares actually cost
- Seeing your stock holdings in one place: value, sector, account and income
- Shares Moved From Another Broker: Fixing Missing Cost Basis
- Premium-Adjusted Cost Basis for Covered-Call Holders