Analyzing closed-trade performance: win rate, expectancy and profit factor
Turn a list of closed options trades into win rate, average win and loss, expectancy and profit factor, then break the results down by strategy and symbol. Includes a worked five-trade example and the fixes for rolls and fees.
What it is and why it matters
A closed trade is a position with no remaining exposure: every leg has been bought back, expired, assigned, exercised or otherwise ended. Once a trade is closed, its result is fixed. No quote can change it. That makes your closed trades the only part of your record that can be measured honestly.
Closed-trade analysis turns that list into a handful of numbers that describe how you actually trade:
- Win rate — the share of closed trades that made money. It tells you how often you are right, not how much being right is worth.
- Average win and average loss — the mean profit on winning trades and the mean loss on losing trades, in dollars.
- Expectancy — the average profit or loss per trade, combining how often you win with how much you win and lose. This is the number that tells you whether the approach has been paying.
- Profit factor — gross profit divided by gross loss. Above 1.0 means your winners outweighed your losers over the period measured. Below 1.0 means they did not.
These four numbers answer different questions, and reading only one of them is how traders fool themselves. A 60% win rate sounds comfortable until you notice that the 40% of trades that lost gave back more than the 60% brought in. Selling premium in particular produces high win rates with occasional large losses, so win rate on its own is close to meaningless for that style.
Two things distort naive versions of these numbers. The first is rolls. Rolling means closing an option leg and opening a replacement, usually at a different strike or expiration. If you count each segment of a roll as its own trade, a chain that ends profitably can show up as three "losses" and one "win", and your trade count inflates. The second is fees. Commissions and exchange fees are small per contract and large in aggregate; leave them out and every statistic drifts in your favour.
None of this predicts the next trade. Expectancy is a description of a past sample, and options involve the risk of losing more than the premium collected. The point of measuring is to see what you have been doing, not to forecast what you will earn.
How to track it by hand
Keep one row per closed trade. Record the cash as the broker records it, signed: money received is positive, money paid is negative. Keep fees in a separate column so you can see what they cost you. Then let three computed columns do the work.
The columns
Symbol, Strategy, Opened, Closed, Opening cash, Closing cash, Fees, then:
- P/L = Opening cash + Closing cash − Fees. In the spreadsheet this is
=IF(A{r}="","",N(E{r})+N(F{r})-N(G{r})), where{r}is the row number. - Win (1/0) =
=IF(A{r}="","",IF(H{r}>0,1,0)). One if P/L is above zero, otherwise zero. - Days held =
=IF(A{r}="","",D{r}-C{r}), the calendar days between the open and close dates.
The template below already contains the worked example and these formulas, so you can replace the rows with your own.
Download the template: Closed-trade journal spreadsheet (.xlsx). It opens in Excel, and in Google Sheets via File → Import. The worked example from this guide is already filled in, and the formulas carry down into the blank rows.
Five closed trades
| Symbol | Strategy | Opened | Closed | Opening cash | Closing cash | Fees | P/L | Win | Days held |
|---|---|---|---|---|---|---|---|---|---|
| XYZ | Cash Secured Put | 2026-01-05 | 2026-01-23 | 150 | -30 | 1.30 | 118.70 | 1 | 18 |
| ABC | Covered Call | 2026-01-07 | 2026-02-20 | 210 | 0 | 0.65 | 209.35 | 1 | 44 |
| XYZ | Put Credit Spread | 2026-01-12 | 2026-02-06 | 95 | -360 | 2.60 | -267.60 | 0 | 25 |
| DEF | Cash Secured Put | 2026-02-02 | 2026-02-27 | 120 | -15 | 1.30 | 103.70 | 1 | 25 |
| ABC | Covered Call | 2026-02-23 | 2026-03-13 | 180 | -260 | 1.30 | -81.30 | 0 | 18 |
Row by row: the XYZ cash-secured put collected 150, was bought back for 30, and cost 1.30 in fees, so 150 − 30 − 1.30 = 118.70. The ABC covered call collected 210 and expired with no closing cash, so 210 − 0.65 = 209.35. The XYZ put credit spread collected 95 and was closed for 360, so 95 − 360 − 2.60 = −267.60. The DEF put: 120 − 15 − 1.30 = 103.70. The second ABC covered call collected 180 and was closed for 260: 180 − 260 − 1.30 = −81.30.
The five statistics
Trades = 5. Count the rows.
Win rate = 0.6. Three of the five rows have P/L above zero: 3 ÷ 5 = 0.6, or 60%.
Total P/L = 82.85. Add the P/L column: 118.70 + 209.35 − 267.60 + 103.70 − 81.30 = 82.85.
Average win = 143.916667. The three winners total 118.70 + 209.35 + 103.70 = 431.75, divided by 3.
Average loss = −174.45. The two losers total −267.60 − 81.30 = −348.90, divided by 2.
Expectancy per trade = 16.57. Two ways to get there, and they agree. Weight the averages by frequency: (0.6 × 143.916667) + (0.4 × −174.45) = 86.35 − 69.78 = 16.57. Or divide total P/L by trade count: 82.85 ÷ 5 = 16.57.
Profit factor = 1.237461. Gross profit 431.75 divided by the absolute gross loss 348.90.
Breaking it down
Totals hide the story. Group the same five rows by strategy: the two Cash Secured Puts made 222.40 with two wins out of two; the two Covered Calls made 128.05 with one win out of two; the single Put Credit Spread lost 267.60. By symbol: ABC made 128.05 across two trades, DEF made 103.70 across one, and XYZ lost 148.90 across two trades despite one of them being a clean winner.
Both breakdowns point at the same row. One position is responsible for the entire difference between a decent period and a flat one. That is worth knowing, and it is invisible in the 60% win rate.
What the fees did
The fees column totals 7.15 across five trades. Without them, total P/L would be 90.00 instead of 82.85, and profit factor would read 435.00 ÷ 345.00 = 1.26 instead of 1.237461. Seven dollars moved profit factor by about two points. Over a hundred trades, the same habit of ignoring fees makes a marginal approach look workable.
Where manual tracking breaks down
The arithmetic above is easy. Keeping the input list correct is not. The specific failure modes:
- Missed rows. A trade that expires worthless produces no closing confirmation to prompt you, so it quietly never gets logged — and expirations are disproportionately winners for premium sellers, which biases win rate downward. A trade you closed on a busy day gets skipped entirely, usually a loser, which biases it upward.
- Partial fills and partial closes. You sell five contracts and buy back two. If you log the close as the whole position, the remaining three contracts vanish from your open exposure and the P/L is wrong. If you log it as a separate trade, your trade count and win rate are inflated by fragments that were never independent decisions.
- Rolls. A roll is one closing transaction and one opening transaction, often on the same ticket. Logged as separate trades, a chain rolled three times becomes four rows with three debit-driven "losses" and one final "win". Logged as one row, you have to carry the cumulative credits and debits across months and remember to add the fees from each leg of each roll.
- Assignments and exercises. When a short put is assigned, the option position closes and a stock position opens at the strike. The option's result and the subsequent stock result are two different things; blending them, or omitting one, distorts both the strategy breakdown and the symbol breakdown.
- Multiple accounts. Two brokers means two exports, two conventions for signing cash, and two chances to double-count a transfer.
- Corrections. You discover in March that a January row had the wrong closing cash. Every downstream number — win rate, expectancy, profit factor, the strategy table you pasted into your journal — is now stale, and only you know which copies to update.
None of these are difficult problems. They are bookkeeping problems that recur every week, and the error they introduce is systematic rather than random.
How MetisTrades does it
Start by importing transactions
Everything downstream is derived from imported transactions. On the Dashboard with no data loaded, the page shows Select Your Broker and Upload Your File, taking a CSV or XLSX file. The broker list covers Robinhood, Fidelity, Charles Schwab, thinkorswim, TastyTrade, TastyTrade (Desktop), Interactive Brokers, a Universal Template, and Other broker (AI-assisted). Uploads belong to a specific trading account, so in All Accounts the empty state asks you to switch accounts first. A signed-in user with an account selected can also choose Enter Transactions Manually.
After an import, Your last import stays visible. If the file was confidently detected as another supported broker's export, Imported as [broker] explains which importer was used. If rows could not be interpreted safely, the report says how many statement rows couldn't be imported, and each listed row can include details such as its reason, date, statement section, row type, amount and description. When the full list of skipped rows is longer than the list shown, the report states how many of the total are displayed. Read it: skipped rows are exactly the missed rows that corrupt a hand-kept journal.
Anonymous visitors can upload and use the Dashboard and Closed Positions with data held in their browser session; nothing is saved. A Pro account keeps the data between visits.
Closed Positions is the equivalent of your sheet
Closed Positions is the table of positions with no remaining open exposure, built by matching imported opening and closing transactions into legs. Closing trades, expiration, assignment or exercise can supply the ending event. The expandable performance summary above the table is the direct counterpart of your totals row. Look at the summary first, then the columns beneath it.
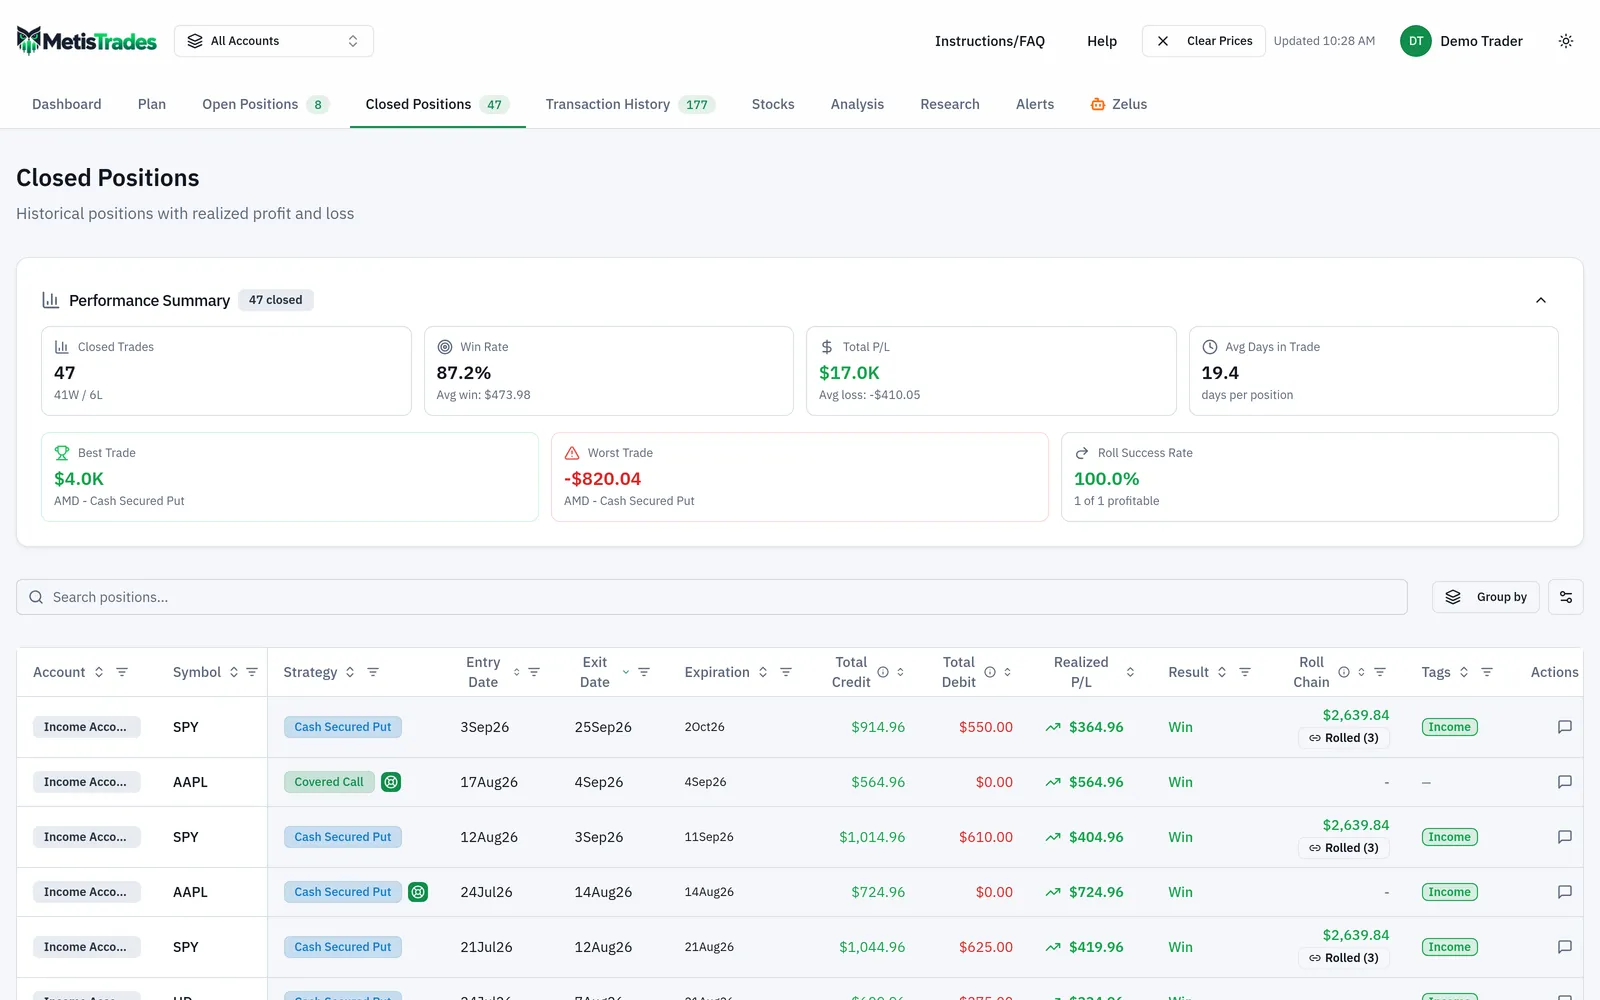
The summary shows Closed Trades, Win Rate, Total P/L, Avg Days in Trade, and Best Trade and Worst Trade where available. The table itself can display Symbol, Strategy, Entry Date, Exit Date, Expiration, Qty, Strike(s), Total Credit, Total Debit, Realized P/L, % Return, BP at Open, Return on BP, Credit/Debit, Result, Roll Chain and Tags. Days in Trade (DIT) is hidden until you turn it on from Customize columns. The totals line reads Totals · N positions and recalculates after search and column filters, so filtering the Strategy column to Cash Secured Put and reading that line gives you the strategy subtotal you would otherwise compute by hand.
Rolled trades are handled as chains rather than fragments. The Roll Chain column shows the final realized P/L across the entire chain and a Rolled (N) badge reports the roll count. Select the row to open Complete Roll Chain, then expand Roll Chain History for lifetime credits, debits, closed-segment P/L and the final chain outcome. If grouping is wrong, Actions can offer Ungroup this manually grouped position, Split this multi-leg position into separate legs, or Restore auto-grouping (undo ungroup), and eligible strategies can be manually reclassified. Badges mark the corrections: R for reclassified, S for split, M for manually grouped or a manual roll chain.
The Dashboard for period and strategy views
The Dashboard answers "how did this quarter go" rather than "how did this trade go". Set the Time Period control — All Time, Today, This Week, This Month, This Year, rolling windows, a year from By Year, or an exact interval through Select date range — then read the tiles and charts for that period.
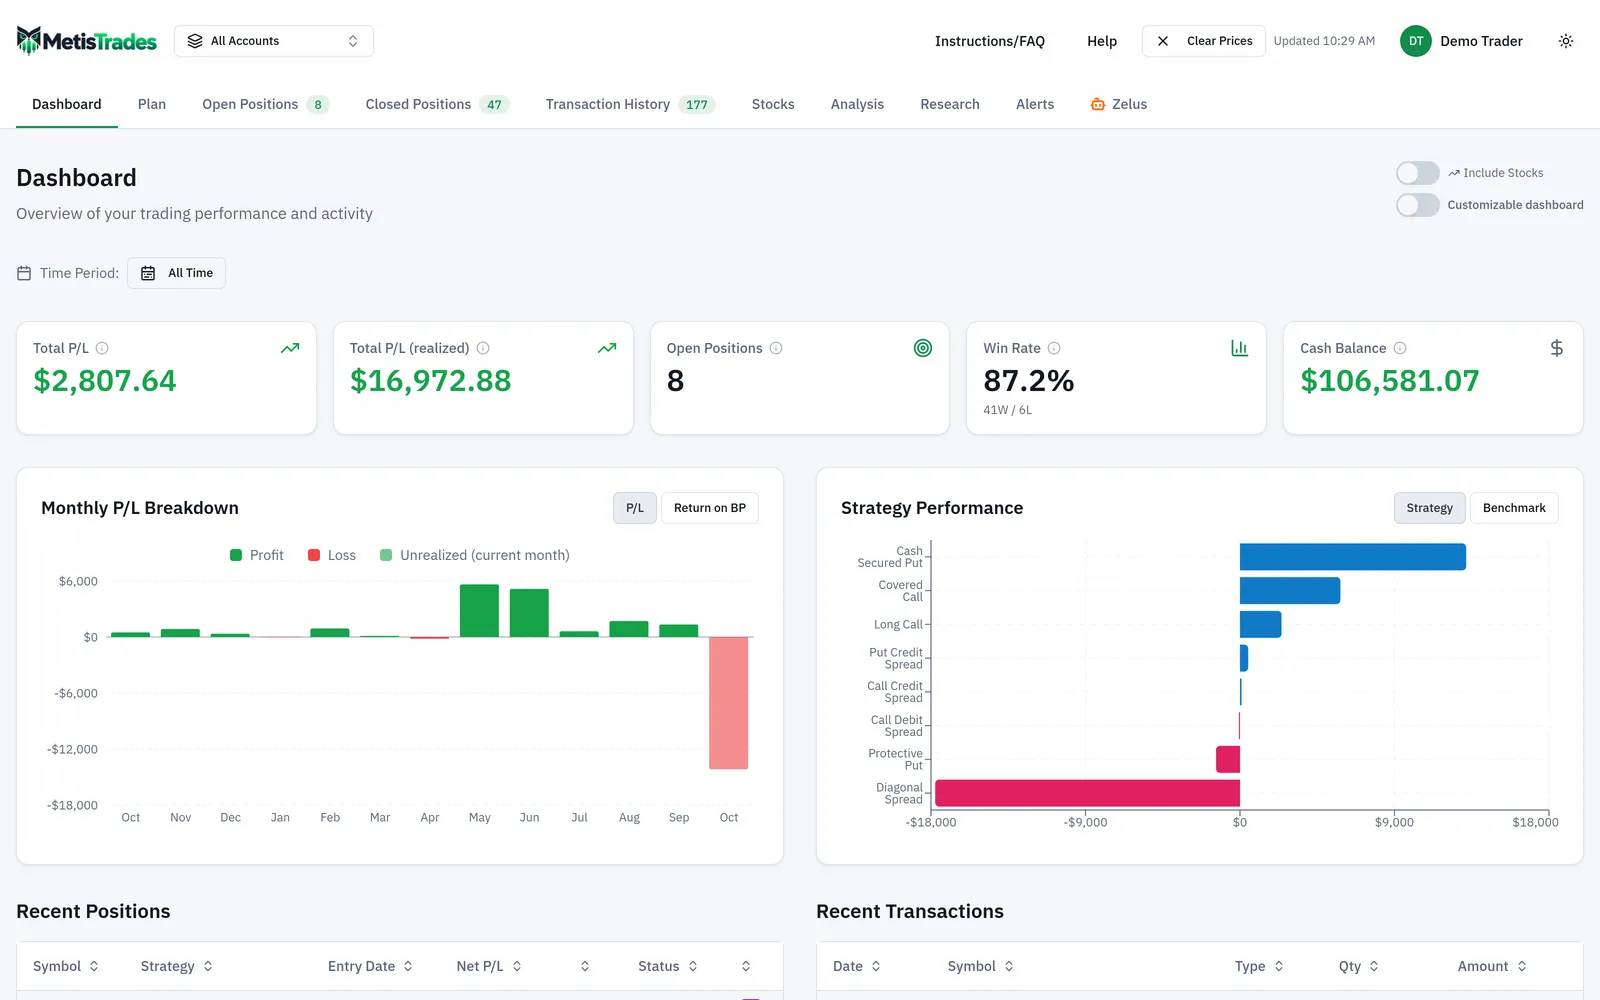
Four tiles always appear: Total P/L (or Total P/L (live) when fetched prices are available), Total P/L (realized), Open Positions and Win Rate, which also shows wins and losses as W / L. A fifth cash tile appears when cash activity or a broker-reported balance is available. The right-hand chart starts as Strategy Performance, grouping total and average P/L by the strategy shown on each position — your strategy breakdown, drawn for you. Pro users can switch that area to Benchmark, and can switch the left-hand chart between P/L and Return on BP. Include Stocks appears when the scope has stock holdings and adds stock results to the P/L calculations.
Tag Analysis for your own categories
Strategy labels describe the structure of a trade. Tags describe your reason for it — a setup name, an earnings theme, an experiment. You apply tags from Open Positions or Closed Positions, then compare them here. Tag Analysis is available to signed-in Pro users.
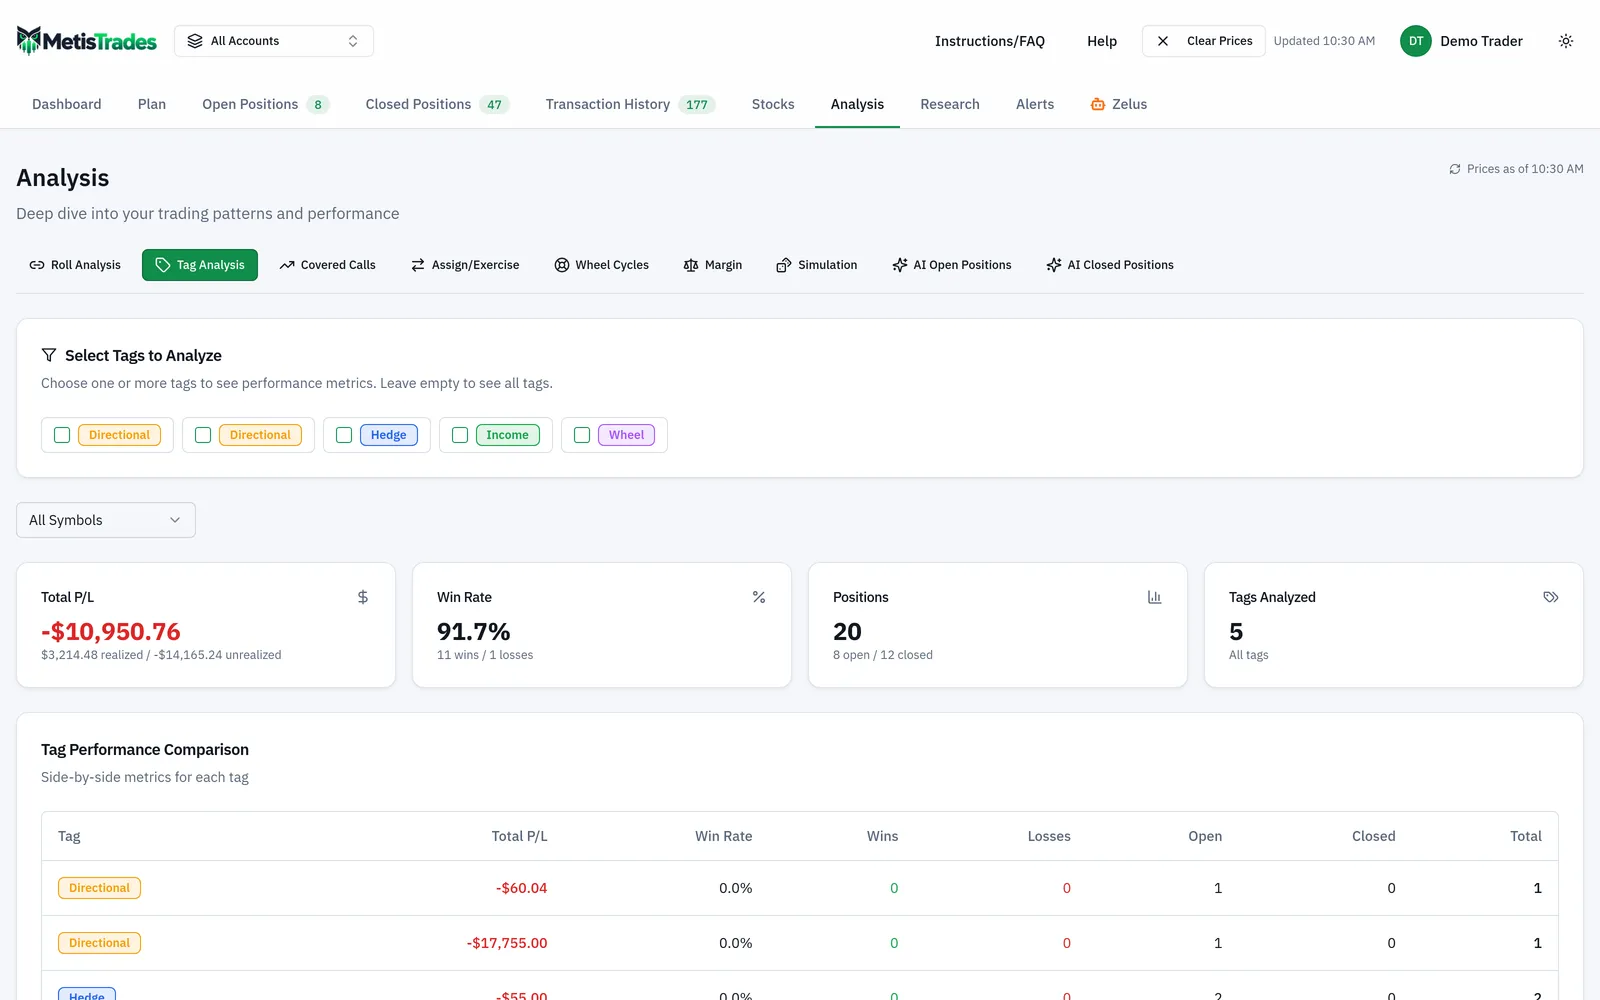
Use Select Tags to Analyze to pick tags, or leave it empty to analyze all of them, and narrow to one underlying with the symbol menu. Summary cards show Total P/L, Win Rate, Positions and Tags Analyzed. The Tag Performance Comparison table lists Tag, Total P/L, Win Rate, Wins, Losses, Open, Closed and Total side by side, and Strategy Distribution by Tag shows which strategies make up each tag, largest count first. Select at least one tag and a Positions with Selected Tags list appears with Symbol, Strategy, Tags, P/L and Status, showing up to 20 matches.
How to read the results
Win Rate on Closed Positions is winning closed positions divided by all closed positions. Note the convention: a zero result counts as a win in that displayed calculation, and the Result column reads Win when realized P/L is zero or positive. The Dashboard tile counts a result above zero as a win and below zero as a loss, and Tag Analysis counts a closed position as a win only when net P/L is greater than zero. Those conventions differ at exactly zero, so an even trade can be counted differently in different places. It does not change your dollars.
Total P/L in the Closed Positions summary is realized P/L summed across closed positions. On the Dashboard, Total P/L is realized P/L plus estimated P/L still sitting in open positions, while Total P/L (realized) is the locked-in part. Compare like with like: your hand-built 82.85 is a realized figure.
Realized P/L on a row is the transaction-derived result for that position segment. Roll Chain is the final result across all linked segments. When they differ, that is the point — the segment lost and the chain may not have, or the reverse.
% Return is realized P/L divided by the position's transaction-derived cost basis. Return on BP is realized P/L divided by the BP at Open value you entered manually for that position, so it exists only for rows where you entered one.
Avg Days in Trade averages calendar days between entry and exit for positions that have both dates; a position opened and closed the same day reads 0d. It is a holding-period measure, not an annualized return.
What these numbers do not mean: they are estimates derived from imported transactions. Missing opening trades, transfers, multipliers, assignments or fees change grouping, cost basis, P/L and roll chains. Quotes are delayed, so any figure that still depends on an open holding reflects the latest available price rather than an executable one. Projected Price on a closed row is a historical AI projection selected as of the exit date, not a quote and not an execution price. And in Tag Analysis, a position carrying two analyzed tags contributes to both groups, so the Positions total can exceed your number of unique positions.
Common mistakes
- Counting each leg of a roll as a separate trade. It triples your trade count and turns one outcome into several. Fix: treat the chain as one row in your sheet, and read the Roll Chain column and Roll Chain History rather than the individual segments.
- Leaving fees out of P/L. In the example, 7.15 of fees cut total P/L from 90.00 to 82.85 and profit factor from about 1.26 to 1.237461. Fix: keep a Fees column and subtract it inside the P/L formula.
- Judging the account on win rate alone. The example wins 60% of the time and still nets only 16.57 per trade because the average loss (−174.45) is larger than the average win (143.916667). Fix: always read win rate next to expectancy and profit factor.
- Drawing conclusions from one or two trades in a bucket. The Put Credit Spread row looks catastrophic as a strategy, but it is a single trade. Fix: record the trade count beside every strategy or symbol subtotal and treat small buckets as anecdotes.
- Treating a partial close as a closed trade. Remaining quantity is still open exposure, and the position moves to Closed Positions only when its status is closed. Fix: check Open Positions and Transaction History when a trade seems to be missing from the closed list.
- Comparing figures from different scopes. An All Accounts total against a single-account total, or a Dashboard period total against an all-time list, will never reconcile. Fix: fix the account scope and the period before you compare anything.
- Ignoring the import report. Rows that could not be interpreted safely are listed there, and skipped rows are the silent cause of wrong win rates. Fix: read Your last import after every upload and re-check whether more skipped rows exist than the list shows.
Related guides and help pages
Related guides
- Plan, Track, Optimize: a complete tour of MetisTrades
- Win Rate Is Not Enough: Expectancy and Profit Factor
- A 90% win rate and $100 to show for it: how rolls hide inside your stats
- Reading your dashboard statistics: what each headline number actually measures
- Comparing Results by Tag: Which of Your Setups Actually Pays
- Trade Path: how far each closed trade ran for and against you