Comparing Results by Tag: Which of Your Setups Actually Pays
Your broker sorts trades by strategy. Tags let you sort them by the reason you took them. This guide shows how to score your own tags by hand with a six-trade example, then how Tag Analysis in MetisTrades does the same comparison.
What it is and why it matters
Your broker files every trade by what it was: a cash-secured put, a covered call, a long call. That tells you the mechanics. It does not tell you why you put the trade on.
A tag is a short label you attach to a position to record the reason behind it. "Income". "Earnings". "Hedge". "Rule break". "High IV". A tag does not replace the strategy label — a position can be a long put and be tagged Earnings at the same time. The strategy is the instrument; the tag is the intent.
That second dimension is where most of the useful review lives. Two traders can both sell cash-secured puts and have completely different results, because one sells them on quiet names for premium and the other sells them into earnings hoping for a volatility collapse. Grouped under "Cash Secured Put" those trades look like one activity. Tagged, they separate into two habits you can score independently.
The number you are chasing when you compare tags is average profit or loss per trade — sometimes called expectancy. Take every closed trade carrying a tag, add the results, divide by the number of trades. That single figure answers the question that matters: if you keep doing this, what does one trade of this type tend to contribute?
It matters because win rate on its own lies. Win rate is the share of closed trades that finished above zero. A tag can win three times out of four and still cost you money, because the one loss was bigger than the three wins combined. That is not a hypothetical — it is exactly what happens in the worked example below. Read win rate and total P/L together, always.
None of this tells you which trade to place next. It tells you which of your own habits have been paying for themselves and which have been quietly funded by the others. Options involve risk, and a tag that looks good over six trades may look different over sixty.
How to track it by hand
You need two sheets: one row per closed position, and one row per tag.
Step 1: the trade log
Record each closed position on its own row. Enter the date it closed, the one tag that best describes why you took it, the symbol, the strategy, and the realized profit or loss after fees. Two helper columns do the counting for you: Count is 1 for any row with a close date, and Win is 1 when P/L is above zero and 0 otherwise.
The formulas are =IF(A{r}="","",1) for Count and =IF(A{r}="","",IF(N(E{r})>0,1,0)) for Win, where {r} is the row number. The IF(A{r}="","") wrapper keeps empty rows blank instead of counting them as zero-dollar losses.
Here is the log with six closed positions:
| Closed | Tag | Symbol | Strategy | P/L | Count | Win |
|---|---|---|---|---|---|---|
| 2026-01-16 | Income | XYZ | Cash Secured Put | 120 | 1 | 1 |
| 2026-01-23 | Income | ABC | Covered Call | 85 | 1 | 1 |
| 2026-02-06 | Earnings | DEF | Long Call | -240 | 1 | 0 |
| 2026-02-13 | Income | XYZ | Put Credit Spread | -310 | 1 | 0 |
| 2026-02-20 | Earnings | ABC | Long Put | 410 | 1 | 1 |
| 2026-02-27 | Income | DEF | Cash Secured Put | 95 | 1 | 1 |
Total P/L across all six rows is 120 + 85 − 240 − 310 + 410 + 95 = 160. Six trades, a small net gain. At portfolio level that is all you know.
Step 2: the tag summary
On the second sheet, list each tag once and let SUMIF pull the numbers across. Trades for a tag is =SUMIF(Trades!$B:$B,A{r},Trades!$F:$F) — sum the Count column wherever the tag matches. Wins swaps column F for column G. Total P/L sums column E. Win rate is wins divided by trades, and average P/L per trade is total P/L divided by trades, both guarded against division by zero.
| Tag | Trades | Wins | Win rate | Total P/L | Avg P/L per trade |
|---|---|---|---|---|---|
| Income | 4 | 3 | 0.75 | -10 | -2.5 |
| Earnings | 2 | 1 | 0.5 | 170 | 85 |
Work the Income row through by hand. Four rows carry the tag, so Trades is 4. Three of them finished above zero, so Wins is 3 and win rate is 3 ÷ 4 = 0.75, or 75%. Total P/L is 120 + 85 − 310 + 95 = −10. Average per trade is −10 ÷ 4 = −2.5.
That is the whole point of the exercise in one row. Income wins three times out of four and still finishes ten dollars underwater, because the single put credit spread that went wrong (−310) was larger than the three winners (120 + 85 + 95 = 300) put together. A 75% win rate reads like a working system. An average of −2.50 per trade says it is not yet one.
Now Earnings. Two trades, one winner, so win rate is 1 ÷ 2 = 0.5. Total P/L is −240 + 410 = 170, and the average is 170 ÷ 2 = 85. Half the trades lost money and it is still the tag carrying the account.
Check your arithmetic by reconciling the two sheets: 4 + 2 = 6 trades, and −10 + 170 = 160, which matches the trade log total. If those two tie out, no row has been missed or double-counted.
The spreadsheet below already contains these six rows and every formula above, so you can replace the sample data with your own closes and the tag summary recalculates.
Download the template: Results by tag spreadsheet (.xlsx). It opens in Excel, and in Google Sheets via File → Import. The worked example from this guide is already filled in, and the formulas carry down into the blank rows.
Two things to keep in mind as you extend it. First, the sheet allows exactly one tag per trade; that keeps the totals additive but forces you to pick the single best reason for each position. Second, it counts closed trades only. Open positions have no final number yet, so including them would mix settled results with moving estimates.
Where manual tracking breaks down
The spreadsheet works. It stops working at scale, and the failures are specific.
- Missed rows. One close you forget to log changes a tag's average and its win rate. With four trades under a tag, a single omission moves the average by a quarter of the missing amount. You rarely notice, because nothing looks wrong.
- Partial fills and scaling out. Close three of five contracts on Monday and two on Friday and you have two broker rows for one position. Log them as two trades and your trade count inflates, your win rate shifts, and the average per trade is computed over a denominator that no longer means "positions".
- Rolls. Rolling a short put out and down closes one contract and opens another. Is that one trade or two? If you log each leg separately, a tag that mostly gets rolled accumulates a string of small realized results and the lifecycle gets lost. If you log only the final close, the intermediate credits and debits go missing.
- Assignments. When a short put is assigned you no longer have an option result, you have shares with a cost basis. The option row closes at one number and the real outcome of the trade depends on what the shares do next. A flat trade log has nowhere to put that.
- Multiple accounts. The same "Income" idea run in a taxable account and an IRA produces two statements. Merging them by hand means reconciling two formats and two sets of fees before you can compare one tag against another.
- Corrections. When you decide a position was mis-labelled — it was really a hedge, not income — you have to find the row, change the tag and trust that no summary elsewhere still uses the old one.
- Tag drift. "Earnings", "earnings" and "Earnings play" are three tags to
SUMIFand one idea to you. Three months in, the summary sheet quietly splits your best habit across three rows.
How MetisTrades does it
MetisTrades keeps the tag attached to the position rather than to a spreadsheet row.
Create and apply tags
Tags are created and applied from the position itself. Open a position to show its details and choose Tag in the header when no tag is attached, or the add control beside existing tags. In Manage Tags, type a new tag name and create it — the new tag is applied to that position automatically. The same list lets you toggle existing tags on or off, and a position can carry more than one.
On Open Positions and Closed Positions a Tags column can be shown, filtered through its column filter or the Filter by Tags control, and used to group rows by Tag. A position with several tags appears in each applicable group, and positions with no tag appear under Untagged. That grouping is the quickest way to spot drift before it spreads: if you see "Earnings" and "Earnings play" side by side in the filter list, fix it now.
In All Accounts mode, tags with the same name are presented together by name in the tag filter, even though the saved tag records stay scoped to their trading accounts.
Compare the tags
Go to Analysis, then Tag Analysis. The page is available to signed-in Pro users; reached without authentication it shows Sign In Required with a Sign In button and a Start Free Trial link instead of results.
The Select Tags to Analyze card lists every tag you have created with its saved name and colour. Choose one or more to narrow the comparison, or leave the selection empty to analyze all of them; Clear Selection returns you to all tags. If you have not created any tags yet the card says No tags created yet. and points you back to Open Positions or Closed Positions.
Above the comparison sit four summary cards — Total P/L with realized and unrealized amounts underneath, Win Rate with wins and losses among closed positions, Positions split into open and closed, and Tags Analyzed showing how many tag groups are included and whether that means All tags or a selected count. These describe the analyzed set as a whole, not any one tag.
The per-tag detail is in the table below them. Look at the Tag Performance Comparison rows side by side, and at the strategy breakdown underneath that shows what each tag is actually made of.
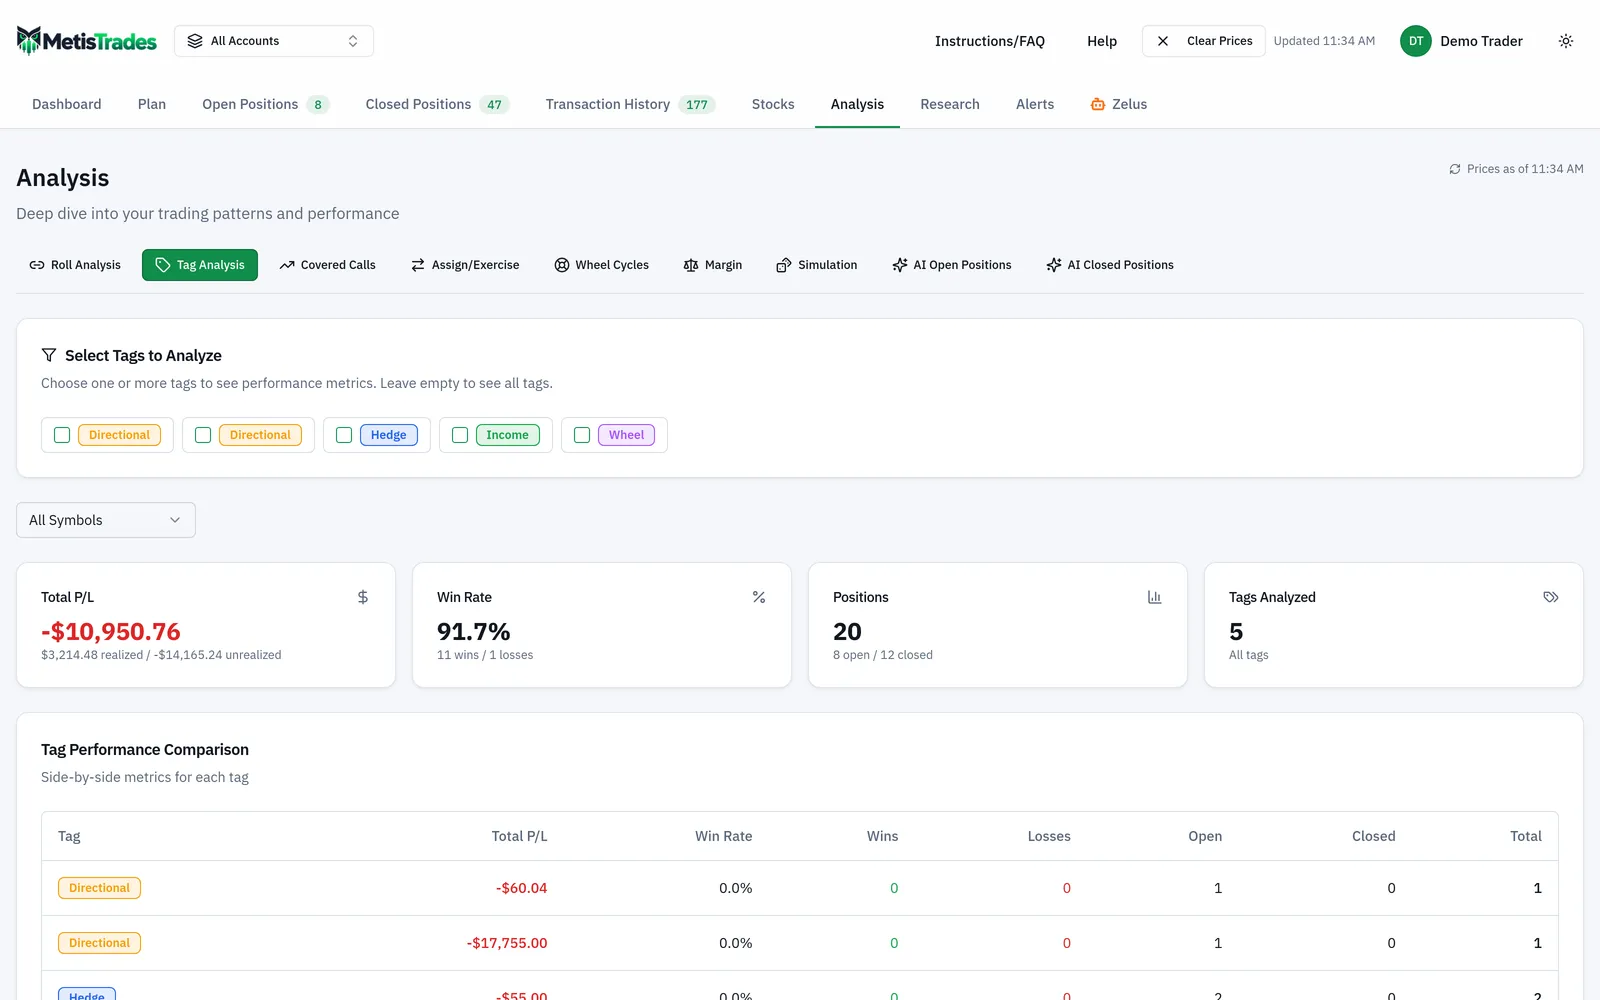
The comparison table's columns are Tag, Total P/L, Win Rate, Wins, Losses, Open, Closed and Total. That is the same shape as the by-tag sheet you built above, with open positions counted separately so you can see how much of a tag is still live.
Strategy Distribution by Tag then shows which option strategies appear within each tag. Each tag card gives its position count, then each strategy's count and its percentage of that tag's positions, listed from the largest count down. This is the view your spreadsheet cannot produce without a pivot table, and it is often the most revealing part: a tag you think of as one setup may turn out to be four.
Narrow the comparison
The symbol menu starts at All Symbols. Pick a symbol to restrict each tag's calculations to positions in that underlying, and the page confirms it with Filtering by followed by the symbol. Use it when you suspect one ticker is driving a tag's whole result.
Once you select at least one tag and matching positions exist, a Positions with Selected Tags section appears with columns Symbol, Strategy, Tags, P/L and Status. It matches positions carrying any selected tag rather than requiring all of them, displays up to 20 positions, and shows Showing 20 of followed by the full count when more match.
Tag Analysis is hidden on public share links, as are the Tags column and your notes, so tagged review stays private to your account.
How to read the results
Total P/L for a tag is realized P/L from its closed positions plus estimated unrealized P/L from its open ones. That is a wider measure than the −10 and 170 you calculated by hand, which counted closed trades only. The unrealized part uses the latest available option prices when they can be fetched, and otherwise the stored position result. Quotes in MetisTrades are delayed, so an open position's contribution is an estimate that can move when prices refresh. It is not a number to compare against a broker statement line for line.
Win Rate is wins divided by all closed positions in the tag. A win is a closed position with net P/L greater than zero; a loss is a closed position at zero or below, so a scratch counts as a loss. Open positions do not count either way, which is why a tag can show 6 Open, 2 Closed and a win rate based on just those two closes. Check the Closed column before you take any win rate seriously.
The table does not show an average per trade. Work it out the way the spreadsheet does: divide a tag's Total P/L by its Closed count for a settled expectancy, or by Total if you want the open estimates folded in. The Income row in the worked example is the reason to bother — 75% and −2.50 per trade are the same four trades described two ways, and only one of those descriptions would stop you repeating the trade.
Positions is the sum of position memberships across the analyzed tags, not a count of unique positions. A position carrying two analyzed tags is counted once in each group, so the aggregate cards can double-count it and the total can exceed your actual number of positions. For the same reason, do not add the per-tag Total P/L figures together and treat the sum as a portfolio total — that only works when every position carries exactly one tag, which is what the by-hand sheet enforces and the app does not.
Strategy percentage is one strategy's count divided by all positions associated with that tag. Read it as composition, not quality: knowing that a tag is 60% put credit spreads tells you where to look next, not that spreads are the problem.
Finally, everything here is derived from your imported transactions. Missing opening trades, transfers, assignments or fees change the inputs, and all P/L figures are estimates rather than a substitute for your broker's 1099-B.
Common mistakes
- Judging a tag on win rate alone. Income's 75% hides a −10 result. Fix: always read win rate next to Total P/L, and divide by the closed count to get the average per trade.
- Adding the per-tag totals together. A position with two tags lands in both groups, so the sum is not a deduplicated portfolio figure. Fix: use the portfolio-level pages for portfolio totals and Tag Analysis only for comparisons between groups.
- Drawing conclusions from a handful of closes. Two Earnings trades produced an 85 average, but one of them was a single 410 winner. Fix: check the Closed column and treat any tag with a low count as a note to yourself rather than evidence.
- Letting tag names multiply. "Earnings" and "Earnings play" split one habit into two weak samples. Fix: review the tag list in Select Tags to Analyze periodically and consolidate names from the position rows.
- Tagging the strategy instead of the reason. A tag called "Covered Call" duplicates information the strategy classification already carries. Fix: tag the intent — the setup, rule, or plan — and let strategy distribution show you the mechanics.
- Tagging only the trades you remember. If you tag winners more diligently than losers, every tag looks good. Fix: tag at entry, from Position Details, as part of placing the trade rather than reviewing it.
- Treating open-position P/L as settled. Open contributions come from delayed quotes and change as prices update. Fix: for an expectancy you can act on, compute it from the Closed column only.
Related guides and help pages
Related guides
- Analyzing closed-trade performance: win rate, expectancy and profit factor
- Tags and notes: adding your own context to positions
- Plan, Track, Optimize: a complete tour of MetisTrades
- Reading your dashboard statistics: what each headline number actually measures
- Building a custom dashboard in MetisTrades
- Simulating the range of results ahead from your own closed trades