Reading your dashboard statistics: what each headline number actually measures
Total P/L, realized P/L, open positions and win rate each cover a different slice of your trading. Work through a small XYZ example by hand, then see how the MetisTrades Dashboard recalculates the same figures for the period and account scope you choose.
What it is and why it matters
A dashboard statistic is a single number that summarises a pile of trades. The trouble is that each number summarises a different pile. Two figures on the same screen can both be correct and still disagree, because one counts only trades you have finished and the other includes guesses about trades still running.
Four statistics do most of the work:
- Realized P/L — profit or loss locked in by positions that closed in the period, plus any legs that have already been closed inside positions that are still open.
- Total P/L — realized P/L plus the estimated profit or loss still sitting in open positions.
- Open positions — how many positions you opened in the period that are still open.
- Win rate — winning positions divided by positions closed in the period, where a result above zero counts as a win and below zero as a loss.
Two more turn raw dollars into something comparable: capital deployed, which is the larger of total credit received and total debit paid for each position, added across the set; and portfolio return, which is realized P/L divided by capital deployed.
Why bother defining them this carefully? Because the period you choose changes every one of them. A quarter with one ugly closed trade and three healthy open ones can show a negative realized P/L and a positive total P/L at the same time. If you do not know which number you are looking at, you will draw the wrong conclusion about your own trading.
One more thing to fix in your head before the arithmetic: any figure that involves an open position is an estimate. It depends on a price for legs you have not closed, and option prices come from the prior session's close or on-demand delayed quotes. They are reference values, not fills.
How to track it by hand
Here is a small book of XYZ trades for one account over a single quarter: 1 April to 30 June. Six positions touch the period. Five were opened inside it; one was opened in March and closed in April, which still counts, because a position belongs to a period when its entry or its exit falls inside it.
Step 1: list every position that touches the period
For each one, record the credits you received, the debits you paid, and whether it is closed or still open. Credits are money collected; debits are money paid.
| Position | Opened | Closed | Credits received | Debits paid | Realized P/L | Unrealized P/L | Capital deployed |
|---|---|---|---|---|---|---|---|
| 1. XYZ cash-secured put | 5 Apr | 2 May | $210 | $60 | +$150 | — | $210 |
| 2. XYZ covered call | 10 Apr | 17 May | $130 | $185 | −$55 | — | $185 |
| 3. XYZ put credit spread | 20 May | 12 Jun (expired) | $95 | $0 | +$95 | — | $95 |
| 4. XYZ cash-secured put | 2 Jun | still open | $180 | $0 | — | +$110 | $180 |
| 5. XYZ covered call | 20 Jun | still open | $140 | $0 | — | −$25 | $140 |
| 6. XYZ call debit spread | 12 Mar | 25 Apr | $300 | $220 | +$80 | — | $300 |
| Totals | $1,055 | $465 | +$270 | +$85 | $1,110 |
Step 2: work out realized P/L
For each closed position, subtract debits from credits. Position 1 collected $210 and paid $60 to close: $210 − $60 = +$150. Position 2 collected $130 but cost $185 to buy back: $130 − $185 = −$55. Position 3 collected $95 and expired with nothing paid to close: +$95. Position 6 was a debit spread, paid for at $220 in March and sold for $300 in April: $300 − $220 = +$80.
Add them: $150 − $55 + $95 + $80 = +$270 realized. Note that position 6 contributes in full even though it was opened before the quarter. Realized P/L is attached to the exit date.
Step 3: estimate unrealized P/L
For the two positions still open, you need a current value for the legs. On 30 June, the short put in position 4 would cost about $70 to buy back, so $180 collected − $70 to close = +$110. The short call in position 5 has moved against you and would cost about $165 to buy back: $140 − $165 = −$25.
Unrealized total: $110 − $25 = +$85. Write down the date and the price source next to it. Without that, you cannot reproduce the figure next week.
Step 4: combine into the headline figures
- Total P/L = realized + unrealized = $270 + $85 = +$355.
- Total P/L (realized) = +$270.
- Open positions = positions opened in the period that are still open = positions 4 and 5 = 2.
- Win rate = wins ÷ positions closed in the period. Four closed: 1, 2, 3 and 6. Three finished above zero, one below. 3 ÷ 4 = 75%, written as 3 / 1 wins and losses.
Step 5: scale the result against the money it used
Capital deployed takes the larger of credits and debits for each position: $210, $185, $95, $180, $140 and $300. Added together that is $1,110. Portfolio return is realized P/L divided by capital deployed: $270 ÷ $1,110 = 0.2432, or 24.3%.
That percentage is not a return on your whole account, and it is not comparable to a benchmark's price return. It tells you what the realized dollars looked like next to the premium and cost that produced them.
Step 6: decide whether stock counts
Suppose you also hold 100 XYZ shares with a cost of $48.00 per share, marked at $51.20 on 30 June. That is an unrealized stock gain of ($51.20 − $48.00) × 100 = +$320. Including stock pushes Total P/L to $355 + $320 = +$675. It does not change the open-position count or the win rate, because those count option positions. Whichever way you choose, be consistent: a number that silently switches between "options only" and "options plus stock" is worse than no number.
Where manual tracking breaks down
The arithmetic above is easy. Keeping the inputs right is not.
- Missed rows. One unrecorded closing trade leaves a position looking open for ever, inflating the open count and leaving its profit out of realized P/L permanently.
- Partial fills. A three-contract put closed as a one-lot and a two-lot arrives as two rows at different prices. Average them wrongly and both realized P/L and capital deployed drift.
- Rolls. A roll closes one leg and opens a replacement. By hand it is tempting to treat the whole chain as one trade, which hides how many separate wins and losses the chain actually produced — and quietly distorts win rate.
- Assignments. A short put assignment buys shares at the strike. Now an option position has become a stock holding with a cost basis, and the P/L you were tracking has moved to a different ledger.
- Multiple accounts. Two brokers mean two spreadsheets, two period definitions and no combined view unless you merge them by hand every time.
- Corrections. Re-label a position as a covered call rather than a naked short call, and every strategy-level total you already wrote down is stale.
- Period boundaries. Change from "this quarter" to "last 12 months" and you have to re-sort, re-filter and re-add everything. That is where most hand-kept statistics go wrong: nobody redoes it, so the numbers only ever describe one arbitrary window.
How MetisTrades does it
The Dashboard is the first page of MetisTrades and the classic overview of your imported trading activity. Anonymous visitors can use it before signup with data held in their browser session; Pro users use it with their saved account data. A signed-in user without an active subscription is sent to Account Settings instead.
Start with the empty state
With no positions or transactions, the page title is Options Analysis Dashboard. For a specific account it asks you to upload your trading data or enter transactions manually, in two steps: Select Your Broker, then Upload Your File. Choose the broker first, then drag in or browse for a CSV or XLSX file. The broker list is Robinhood, Fidelity, Charles Schwab, thinkorswim, TastyTrade, TastyTrade (Desktop), Interactive Brokers, Universal Template, and Other broker (AI-assisted). A signed-in user with a selected account can instead choose Enter Transactions Manually. In All Accounts the empty state asks you to switch to a specific account, because an upload must attach to one account.
Check the import report
After an upload populates the Dashboard, Your last import keeps important disclosures visible. If the file was confidently detected as another supported broker's export, Imported as [broker] explains which importer was used, without changing the account's broker setting. If rows could not be interpreted safely, the report says how many statement rows couldn't be imported, and each listed row can include its reason, date, statement section, row type, amount and description. When the full list is longer than the displayed one, the report states how many of the total skipped rows are shown. Read it before you trust any statistic, then select Dismiss.
Set the scope and the period
Your account selector controls the book shown throughout the page: All Accounts combines positions, transactions, holdings, summary results and effective cash, while a specific account limits them. The page starts on All Time. Open the Time Period: control to choose Today, This Week, This Month, This Year, Last 7 days, Last 30 days, Last 90 days, Last 6 months or Last 12 months, or pick a year under By Year. For the exact 1 April to 30 June window from the worked example, use Select date range, choose both dates and select Apply. Future dates are disabled.
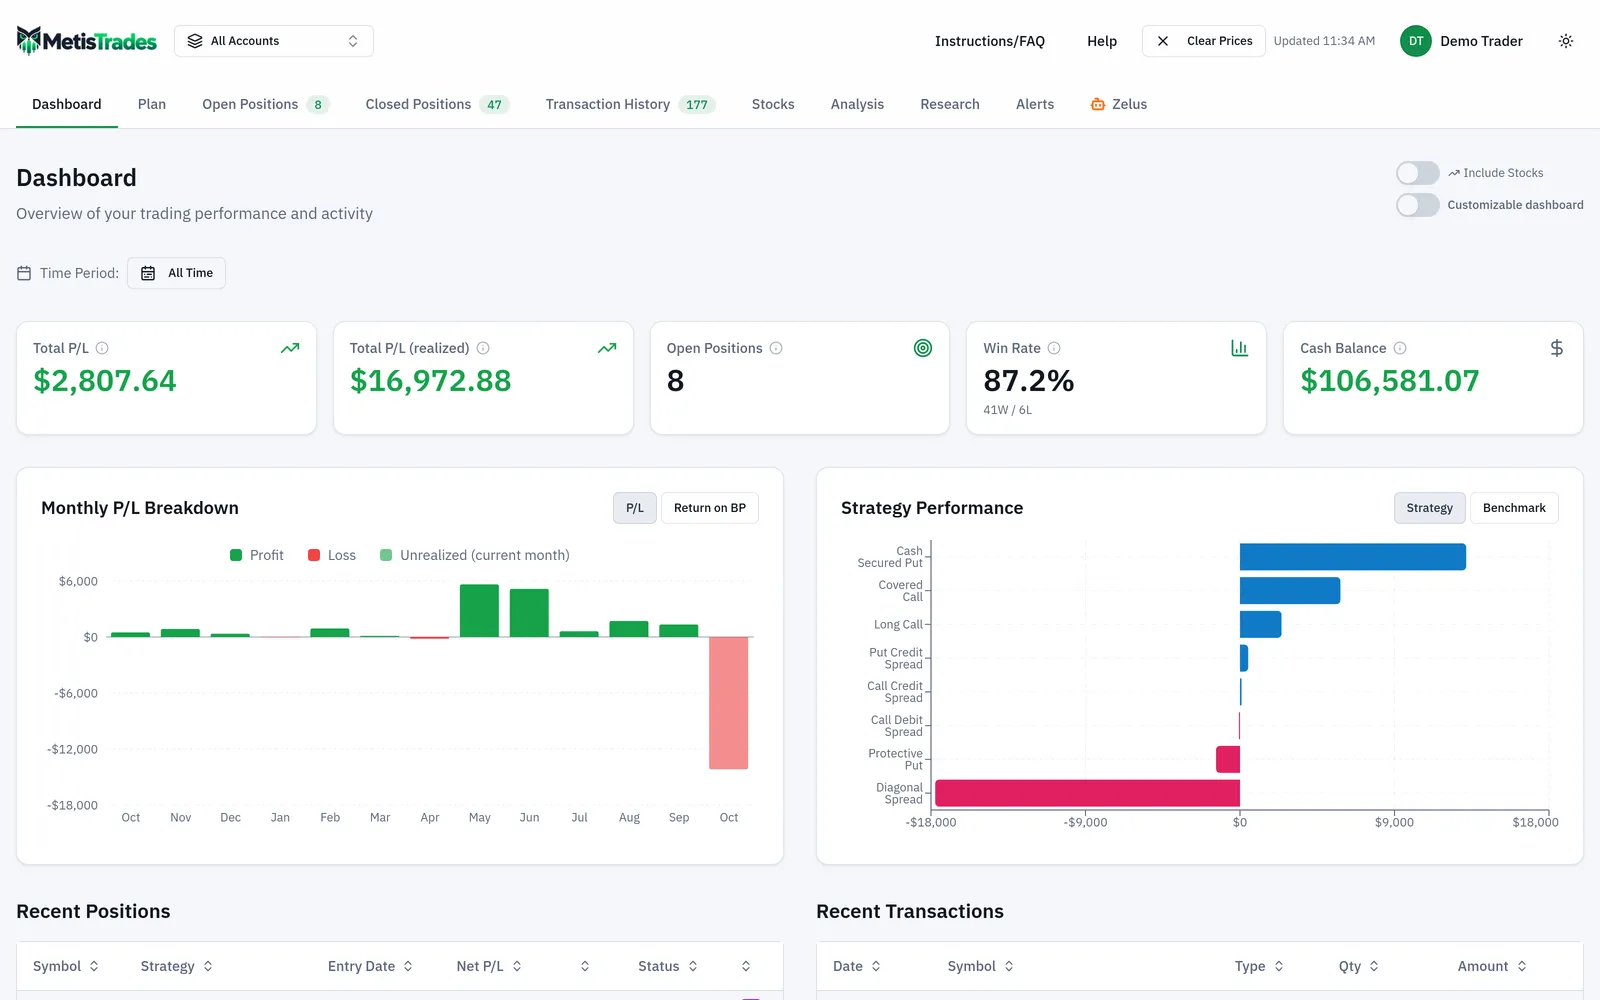
The screenshot below is the classic layout with a period selected. Look at the row of summary tiles first, then the two charts beneath them and the activity tables at the bottom.
Read the tiles
Four tiles always appear: Total P/L — shown as Total P/L (live) when fetched prices are available — Total P/L (realized), Open Positions and Win Rate. The Win Rate tile also shows wins and losses as W / L, which is the 3 / 1 from the example. A fifth tile appears when the scope has cash activity or a broker-reported balance: Cash Balance, or Cash + Stock Value when stock value is included. A cash tile can show Broker-reported or an On Margin warning.
In the header, Include Stocks appears when the selected scope has stock holdings and adds stock results to P/L calculations — the $320 decision from step 6. Prices as of appears when current option or included-stock prices are available, and identifies the latest available price data. Customizable dashboard switches from the classic layout to the widget board; that switch is available only to Pro users, and only when at least one position or transaction is present.
Charts and activity
The left chart starts as Daily P/L Breakdown for shorter periods or Monthly P/L Breakdown for longer ones, separating Realized P/L from Unrealized P/L where present. Pro users can switch this area between P/L and Return on BP, which shows monthly realized P/L against the buying-power history configured for an account.
The right chart starts as Strategy Performance, grouping total and average P/L by the strategy shown on each position, including any strategy override you set. Pro users can switch between Strategy and Benchmark. Benchmark Comparison compares Your Portfolio with up to three benchmarks, starting with S&P 500 (SPY); the choices are S&P 500, NASDAQ 100, Dow Jones, Russell 2000, Bitcoin and Gold. Use Add to select another, the remove control on a badge to drop one, and Compare to refresh. It shows Investment, Return and Gap, and expanding Your Portfolio shows Realized P/L, Capital Deployed and the resulting Return — the $270, $1,110 and 24.3% you calculated by hand.
On All Time, the lower area holds Recent Positions and Recent Transactions. For a selected period it holds Positions Opened [period], Positions Closed [period] when at least one position closed, and Transactions [period]. Open-position columns are Symbol, Strategy, Entry Date, Net P/L and Status; closed-position columns are Symbol, Strategy, Closed and Realized P/L; transaction columns are Date, Symbol, Type, Qty and Amount. Selecting a row opens that position's details without leaving the page.
How to read the results
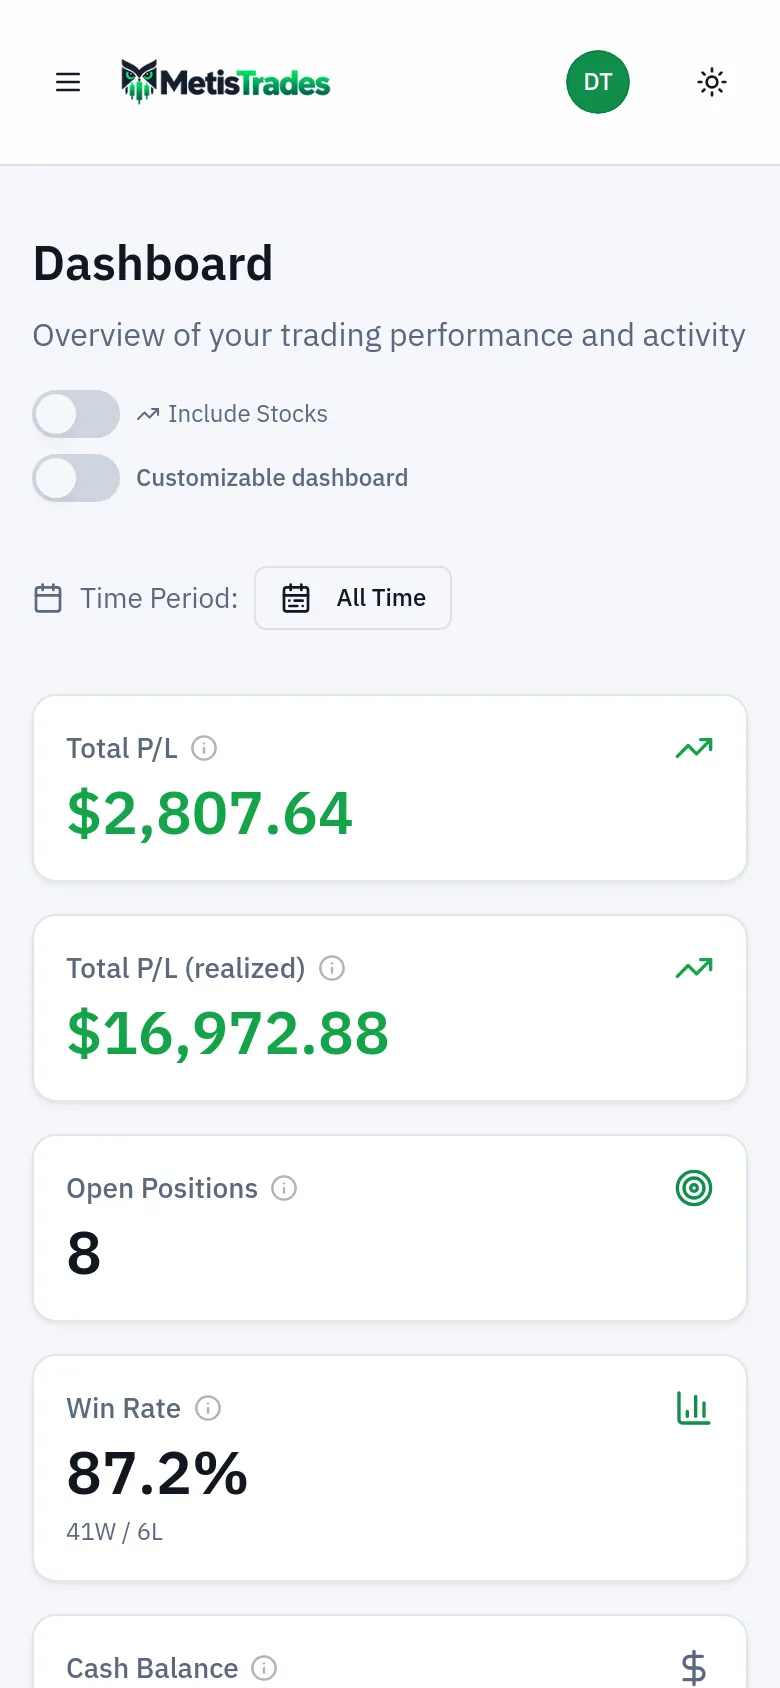
The next screenshot shows the same Dashboard on a narrow screen.
Total P/L mixes a settled fact with an estimate. With fetched prices, open option and included-stock values use the latest available price; otherwise the figure uses imported credits, debits and cash flows. That is why it can move when prices are fetched even though you placed no trades. It is not the amount you would receive if you closed everything today.
Total P/L (realized) is the harder number: positions closed in the period, plus closed legs inside still-open positions. It still comes from imported transactions, so it is an estimate, and it is not a tax figure.
Open Positions counts positions opened in the selected period that remain open — on All Time, the all-time open count. It is not your total current exposure unless the period covers everything. Stock holdings do not become option positions for this count.
Win Rate is a count, not a size. The example's 75% sits beside a single $55 loss; the same 75% could sit beside a $5,500 loss. Always read win rate next to realized P/L.
Portfolio Return is realized P/L divided by capital deployed. Benchmark return is a market-price comparison. The two are not like-for-like on cash flows, risk, dividends, taxes or fees, so treat the Gap as context rather than a verdict.
Cash Balance is effective cash for the account scope: broker-reported where an eligible linked balance is available, otherwise the imported ledger. An On Margin warning means borrowed money is in the picture.
Two scope limits are worth remembering. On All Time, the recent-position and recent-transaction tables are capped at the first 100 records supplied to them, so use the dedicated Open Positions, Closed Positions and Transaction History pages for focused review. And quotes are delayed throughout: a Prices as of time tells you how fresh the inputs are, not what you could trade at.
Common mistakes
- Comparing Total P/L from one period with realized P/L from another. Pick one statistic and one period, then compare like with like.
- Reading the Open Positions tile as total exposure. On a 30-day period it counts only what you opened in those 30 days and still hold; switch to All Time or open the Open Positions page for the full book.
- Judging a quarter by win rate alone. Check the W / L split and realized P/L together; a few large losses can sit comfortably behind a high percentage.
- Toggling Include Stocks between reviews. Decide whether your headline P/L includes stock and leave it set, or your month-to-month comparison measures the switch instead of your trading.
- Treating the benchmark Gap as performance. It compares a price return with realized P/L over estimated capital deployed; it is not a like-for-like measure.
- Ignoring Your last import. Skipped statement rows change grouping, P/L and the counts; read the report before you trust the tiles.
- Using the estimates as tax figures. Everything derived from imported transactions is an estimate, not tax advice, and not a substitute for your broker's 1099-B.
Related guides and help pages
Related guides
- Analyzing closed-trade performance: win rate, expectancy and profit factor
- Win Rate Is Not Enough: Expectancy and Profit Factor
- Plan, Track, Optimize: a complete tour of MetisTrades
- A 90% win rate and $100 to show for it: how rolls hide inside your stats
- Building a custom dashboard in MetisTrades
- Comparing Results by Tag: Which of Your Setups Actually Pays