Building a custom dashboard in MetisTrades
How to turn on My Dashboard, pick the statistics, charts, tables and exposure widgets you actually read, and understand what each figure covers. Follows one trader's XYZ-heavy year end to end.
What it does and when to use it
The classic Dashboard shows a fixed set of figures. The Customizable dashboard is an opt-in widget board that replaces it, so you decide which statistics appear, what form each one takes, and where it sits. Its on-page title is My Dashboard.
The question it answers is narrow and useful: which numbers do I want to see every time I open MetisTrades, on one screen, without clicking into reports? If you find yourself visiting the same three analysis pages each week to check the same four figures, those figures belong on a board.
The board uses the same imported positions, transactions, strategy overrides, delayed quotes, account scope and period calculations as the classic Dashboard. It is not a separate data set. A widget is one statistic rendered in one of three forms: a Tile for a single headline number, a Chart for a visual series or breakdown, or a Table for a ranked or detailed breakdown. The catalogue says which forms each statistic offers.
Three terms matter before you start, because they explain why two widgets can disagree:
- Period book — the positions and transactions narrowed by the board's Time Period. Most P/L, outcome, timing, cash-flow, strategy, symbol and activity widgets read this book.
- Current-exposure book — every position open now in the selected account scope, whenever it was opened. Expiration risk and the Portfolio heat map in Open now mode read this book.
- Current account state — today's balance and leverage snapshot. Cash balance, Current LTV, Margin debt, Safety cushion, If the market drops, Risk targets, Income goal and Retirement readiness do not turn into historical snapshots when you change the period.
The switch and the board are available to Pro users, and the switch appears only when the selected data contains at least one position or transaction. Anonymous visitors cannot opt into the board.
A worked scenario
Take a trader who sells cash-secured puts and covered calls, mostly on XYZ, with a handful of other underlyings. They want a board that answers one question each Monday: is the premium I collected actually surviving to the exit, and what is coming due?
Over the last 12 months their account closed 24 option positions. A closed trade here means one option position whose exit falls in the period, with its legs, rolls and partial closes combined into one result; stock holdings are not counted as trades.
| Figure | Value | How it is reached |
|---|---|---|
| Gross profit | $6,200 | Total P/L of the 19 winning closed trades |
| Gross loss | $1,550 | Absolute total of the 5 losing closed trades |
| Realized P/L | $4,650 | 6,200 − 1,550 |
| Total P/L | $5,120 | Realized plus current estimated P/L on still-open positions |
| Unrealized P/L | $470 | 5,120 − 4,650 |
| Win rate | 79.2% | 19 ÷ 24 = 0.7917 |
| Profit factor | 4.0 | 6,200 ÷ 1,550 |
| Average winner | $326.32 | 6,200 ÷ 19 |
| Average loser | $310.00 | 1,550 ÷ 5 |
| Win/loss size ratio | 1.05 | 326.32 ÷ 310.00 |
| Average P/L per trade | $193.75 | 4,650 ÷ 24 |
Expectancy lands on the same $193.75: (0.7917 × 326.32) − (0.2083 × 310.00) = 258.33 − 64.58 = 193.75. Two widgets, one arithmetic.
Their credit trades collected $6,000 of opening credit in the period and cost $1,500 to close, so the Premium capture rate is 4,500 ÷ 6,000 = 75%. That covers closed credit trades only, which is why it does not tie to the $4,650 realized figure that also includes debit trades.
On Performance by symbol, XYZ accounts for $2,980 of realized P/L across 11 trades with 10 winners, a 90.9% win rate. One of those trades — a put that collected $430 and closed for a $130 debit — shows a return on capital deployed of 300 ÷ 430 = 69.8%.
Separately, an XYZ covered call opened 40 days ago and expiring in two weeks is still open. Hold that one in mind; it is the trade that makes two widgets look like they disagree.
Step by step in MetisTrades
1. Turn the board on
Go to Top nav → Dashboard. On a populated classic Dashboard, turn on Customizable dashboard. The page title changes to My Dashboard. Look at the controls along the top of the board and at the first row of tiles — that first row is the starter layout, not something you chose.
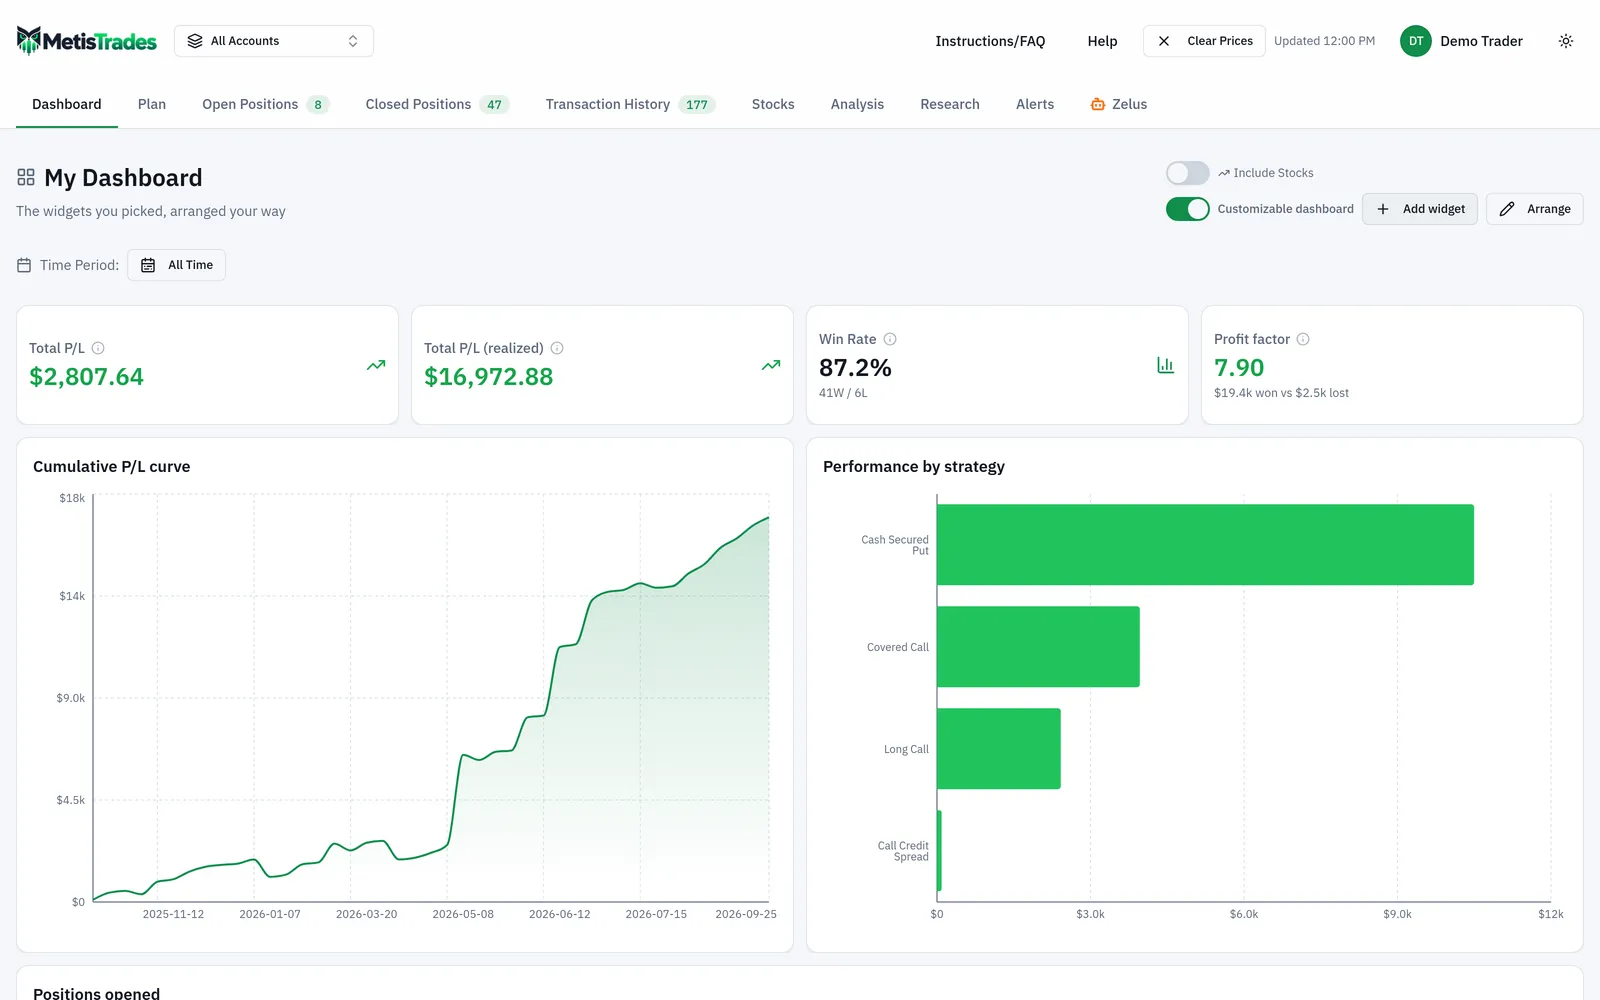
The first time you turn the board on with no saved widgets, MetisTrades creates a standard set: Total P/L, Realized P/L, Win rate, Profit factor, Cumulative P/L curve, Performance by strategy and Positions opened. Four headline tiles sit on the first row, two charts below them, then the positions table.
2. Set the period
The board starts at All Time. Use the Time Period: picker to choose Last 12 months for this scenario. The picker also offers Today, This Week, This Month, This Year, Last 7 days, Last 30 days, Last 90 days, Last 6 months, and the years found in your transaction history. On a larger screen, Select date range gives an inclusive custom interval with Apply or Cancel; future dates are disabled. On a small screen the custom calendar is hidden.
If stock holdings are available, Include Stocks appears, and it is the same preference the classic Dashboard uses — changing it here changes it there. Prices as of appears when current option or included-stock prices are available.
3. Add the widgets you actually read
Select Add widget to open Add a widget. Search using Search statistics — win rate, profit factor, days held…; the search matches a statistic's name, category, description and related terms. When nothing matches, the dialog says Nothing matches "[search]". Try a shorter search.
For this scenario, add four:
- Premium capture rate as a Tile — the headline number for the Monday question.
- Performance by symbol as a Table — XYZ against everything else, with P/L, trade count, win rate and return on capital deployed.
- Expiration risk — symbols against upcoming weeks, shaded by the amount coming due.
- Average DTE at open as a Tile — a check that entry timing has not drifted.
A newly added widget goes into the first free space and puts the board into edit mode. You can add the same statistic more than once, which is worth doing when you want, say, Performance by strategy as both a chart and a table.
4. Arrange and size
Select Arrange to show each widget's edit bar and resize handle. Drag the labeled edit bar to move a widget and the lower-right handle to resize it; both snap to grid cells. For keyboard control, focus the move label or the resize handle and use the arrow keys, one grid cell per press.
The desktop board has 12 columns. Headline statistic tiles are at least 2 columns by 3 rows and no more than 4 rows tall. Charts generally need at least 3 columns by 8 rows, and position and transaction tables at least 4 columns by 8 rows. A widget can be at most 12 columns wide and 40 rows tall, and a board can hold up to 40 widgets. At capacity the add dialog says Your board is full. Remove a widget before adding another.
When widgets overlap after a move or resize, the one you changed keeps its slot and the others move down. Empty rows above the board are trimmed. Use the remove button in a widget's edit bar to delete a widget — removal is immediate and does not ask for confirmation. Select Done when you finish.
5. Let it save
Turning the board on or off, adding or removing a widget, changing widget options, moving a widget and resizing a widget all update the saved layout. Changes save automatically after a short pause, and the board shows Saving while work is pending. Leaving the board during that pause still sends the latest pending layout. If saving fails the page reports Couldn't save your dashboard with the available error message.
Turning Customizable dashboard off returns you to the classic Dashboard and does not erase your widgets; turning it on again restores the saved board.
How to read the results
With Last 12 months selected, the four starter tiles read $5,120, $4,650, 79.2% and 4.0.
Total P/L of $5,120 is realized P/L for the period plus current estimated P/L for still-open positions included by the period calculation. The $470 unrealized slice rests on delayed quotes, so it is an estimate that moves as price data updates. It does not mean $5,120 has reached the account.
Win rate of 79.2% says 19 of 24 closed trades were winners. It says nothing about size. Read it beside Profit factor: 4.0 means gross winning P/L was four times the absolute size of gross losing P/L for trades closed in the period. Because the average winner ($326.32) and average loser ($310.00) are close, the profit factor here is carried almost entirely by the win count. One $3,000 loss next quarter would change the picture without changing the strategy.
Premium capture rate of 75% means closed credit trades kept three-quarters of the credit they opened with. It does not include debit trades, and it is not a measure of return on capital. It is the cleanest answer to "did I buy back too early or too late?" — a number near 100% suggests trades were held close to expiration; a much lower one suggests closing early, which may be deliberate.
Performance by symbol shows XYZ at $2,980 realized across 11 trades. The return on capital deployed column divides realized P/L by the larger of the credit received or debit paid for each included position — 300 ÷ 430 = 69.8% for the example put. That denominator is the premium, not the $4,000 of cash that secured the put. Read it as premium efficiency, not as account return.
Expiration risk shows the XYZ covered call coming due in two weeks even though it was opened 40 days ago and falls outside a Last 30 days period. That is the current-exposure book doing its job. Period widgets honor the date filter; current-exposure and current-account-state widgets show the book as it stands now across the selected account or All Accounts scope. If you want the Portfolio heat map to follow the period instead, change its own scope from Open now to Closed in period.
The Positions opened table lists positions whose entry is inside the selected period, using the same columns as the classic Dashboard. Selecting a position row opens its position details, which is how you check whether a surprising figure traces back to one mis-grouped trade.
Limits and assumptions
All statistics derived from imported positions and transactions are estimates. A missing opening trade, an unrecorded assignment or an odd contract multiplier changes grouping, and grouping changes every trade-count and P/L figure above.
Quotes are delayed. Prices as of identifies the latest available price data, so treat any valuation of an open position — including the unrealized slice of Total P/L — as an estimate rather than an executable price.
The board date filter is not a universal historical "as of" control. Current-exposure widgets ignore it by design, and current balance or leverage widgets describe the latest account state. Expect Expiration risk, Cash balance, Current LTV, Income goal and Retirement readiness not to tie out against period totals.
The Positions opened, Positions closed and Transactions widgets display 100 rows per table page. Positions closed is intentionally empty on All Time; it asks you to pick a period.
Commissions & fees depends on the fields your broker export supplies, and a broker may already net those costs into trade amounts, so do not subtract the widget total from P/L a second time. Market-drop and margin-cushion results, including If the market drops and Safety cushion, are scenarios rather than broker maintenance calculations. Any tax-related figures are estimates from your imported transactions, not a substitute for your broker's 1099-B.
On a small screen, widgets stack full width in your saved reading order — top to bottom, then left to right from the desktop layout — with height capped at 14 grid rows and tall tables scrolling inside their widget. You can remove widgets on mobile in edit mode but cannot drag or resize them there.
Common mistakes
- Expecting Expiration risk to follow the period picker. Fix: read it as the current-exposure book, and switch the Portfolio heat map to Closed in period when you want period scope.
- Subtracting the Commissions & fees total from P/L. Fix: check whether your broker already netted those costs into the trade amounts before doing any arithmetic.
- Treating Positions closed as broken on All Time. Fix: pick a specific time period; that widget's All Time input is intentionally empty.
- Reading return on capital deployed as return on the cash securing a put. Fix: remember the denominator is the larger of credit received or debit paid — $430, not $4,000.
- Judging the book on win rate alone. Fix: place Win rate, Profit factor, Average winner and Average loser on the same row so size and frequency are read together.
- Deleting a widget expecting a confirmation prompt. Fix: removal is immediate, so re-add the statistic from the catalogue if you clicked by accident.
- Trying to lay the grid out on a phone. Fix: arrange on a larger screen; mobile stacks widgets in one column in your saved order.
Related guides and help pages
Related guides
- Trade Path: how far each closed trade ran for and against you
- Plan, Track, Optimize: a complete tour of MetisTrades
- Analyzing closed-trade performance: win rate, expectancy and profit factor
- Reading your dashboard statistics: what each headline number actually measures
- Comparing Results by Tag: Which of Your Setups Actually Pays
- Simulating the range of results ahead from your own closed trades