Trade Path: how far each closed trade ran for and against you
Realized P/L tells you what a trade booked, not what it was worth while it was open. Trade Path replays every closed option trade on end-of-day option quotes and measures capture, heat and what holding would have done.
What it does and when to use it
Your realized profit and loss (P/L) tells you what a trade booked when you closed it. It cannot tell you what the trade was worth on the days in between. A put you closed for a small gain may have been worth four times that a week earlier. A loss you took may have been the best decision in the trade.
Trade Path answers that second question. It replays every closed option position on real end-of-day option quotes, at the size you actually held each day, and records two numbers for each trade:
- Max gain seen (MFE, maximum favorable excursion) — the best end-of-day P/L the trade reached while it was open.
- Max drawdown seen (MAE, maximum adverse excursion) — the worst end-of-day P/L while it was open. The real value is kept, so a trade that never went red shows a positive "worst" point.
From those two points it derives the figures the tab is built around. Capture % is realized P/L divided by max gain seen, shown as a percentage only for trades that closed at a gain. Giveback is max gain seen minus realized. Heat is the max drawdown seen on trades that finished as winners — how much red you sat through for the money you kept. Held-to-expiration Δ is what holding every leg to expiration (settled at intrinsic value, the amount each option is in the money) would have made, minus what your exit made. For credit trades — positions opened for a net credit, where premium received exceeds premium paid — it also records the first day the path reached 25%, 50% and 75% of the opening credit.
Use it when you suspect a habit rather than a single bad trade: closing winners early, sitting through more drawdown than the premium justifies, or exiting on a scare that the next week reversed. Trade Path is a Pro feature, and the sub-tab never appears on a public share link. Without active Pro access the tab shows Trade Path is a Pro feature and an Upgrade to Pro button; the values are withheld on the server, so nothing is measured for signed-out users.
A worked scenario
The figures below come from a demo portfolio: the Income Account on All Time. The tab measured 42 of 46 closed trades. One could not be measured — an AMD put whose contract is not in the data vendor's history — and three do not reconcile with the journal. All three of those had a leg assigned: the journal books the premium, while the replay values the option at its in-the-money price, so the two disagree by more than fees and rounding. Those four trades are left out of every chart and every average.
Four of the measured trades carry the rest of this guide. All are cash-secured puts: a short put backed by enough cash to buy the shares if assigned.
| Trade | Entry → exit | Realized P/L | Max gain seen | Max drawdown seen | Held to expiration |
|---|---|---|---|---|---|
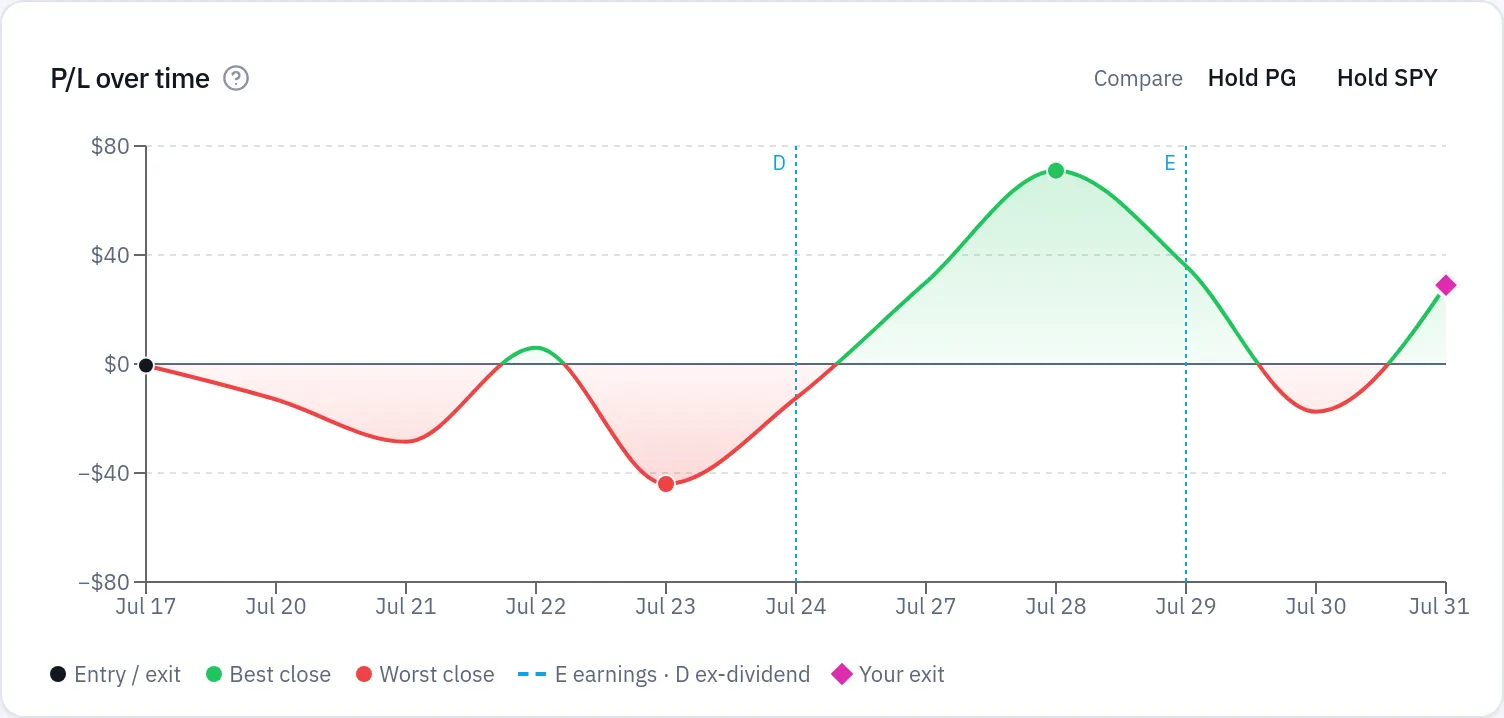
| A — 1 PG 142 put, exp Aug 14 2026 | Sold Jul 17 2026 at $1.6996 ($169.96 credit); bought back Jul 31 at $1.41 ($141.00) | +$28.96 | +$70.96 on Jul 28 | −$44.04 on Jul 23 | +$169.96 — holding would have made $141.00 more |
| B — 1 JNJ 245 put, exp Jul 31 2026 | Sold Jun 29 2026 at $3.6996 ($369.96 credit); bought back Jul 15 at $4.13 ($413.00) | −$43.04 | +$234.96 on Jul 7 | −$43.04 on Jul 15 (the exit day) | +$369.96 — holding would have made $413.00 more |
| C — 2 PG 157.5 puts, exp Mar 27 2026 | Sold Feb 23 2026 at $1.3096 ($261.92 credit); bought back Mar 11 at $5.28 each ($1,056.00) | −$794.08 | +$88.92 on Feb 27 | −$883.08 on Mar 6 | −$2,696.08 — your exit saved $1,902.00 |
| D — 1 SPY 742 put, exp Oct 2 2026 | Sold Sep 3 2026 at $2.8796 ($287.96 credit); bought back Sep 25 at $0.28 ($28.00) | +$259.96 | +$259.96 on Sep 25 (the exit day) | −$296.04 on Sep 10 | +$287.96 — holding would have made $28.00 more |
The arithmetic is the kind you can do on paper. Trade A sold one contract at $1.6996 a share: 1.6996 × 100 = $169.96 collected. Buying it back at $1.41 costs 1.41 × 100 = $141.00, so realized P/L is 169.96 − 141.00 = +$28.96. Its best daily close was +$70.96, so capture is 28.96 ÷ 70.96 = 40.8%, shown as 41%, and giveback is 70.96 − 28.96 = $42.00. Trade B's capture cannot be a percentage: it was up $234.96 at one close and booked −$43.04, so the cell reads Turned into a loss with a giveback of 234.96 − (−43.04) = $278.00.
Step by step in MetisTrades
1. Open the tab and set the scope
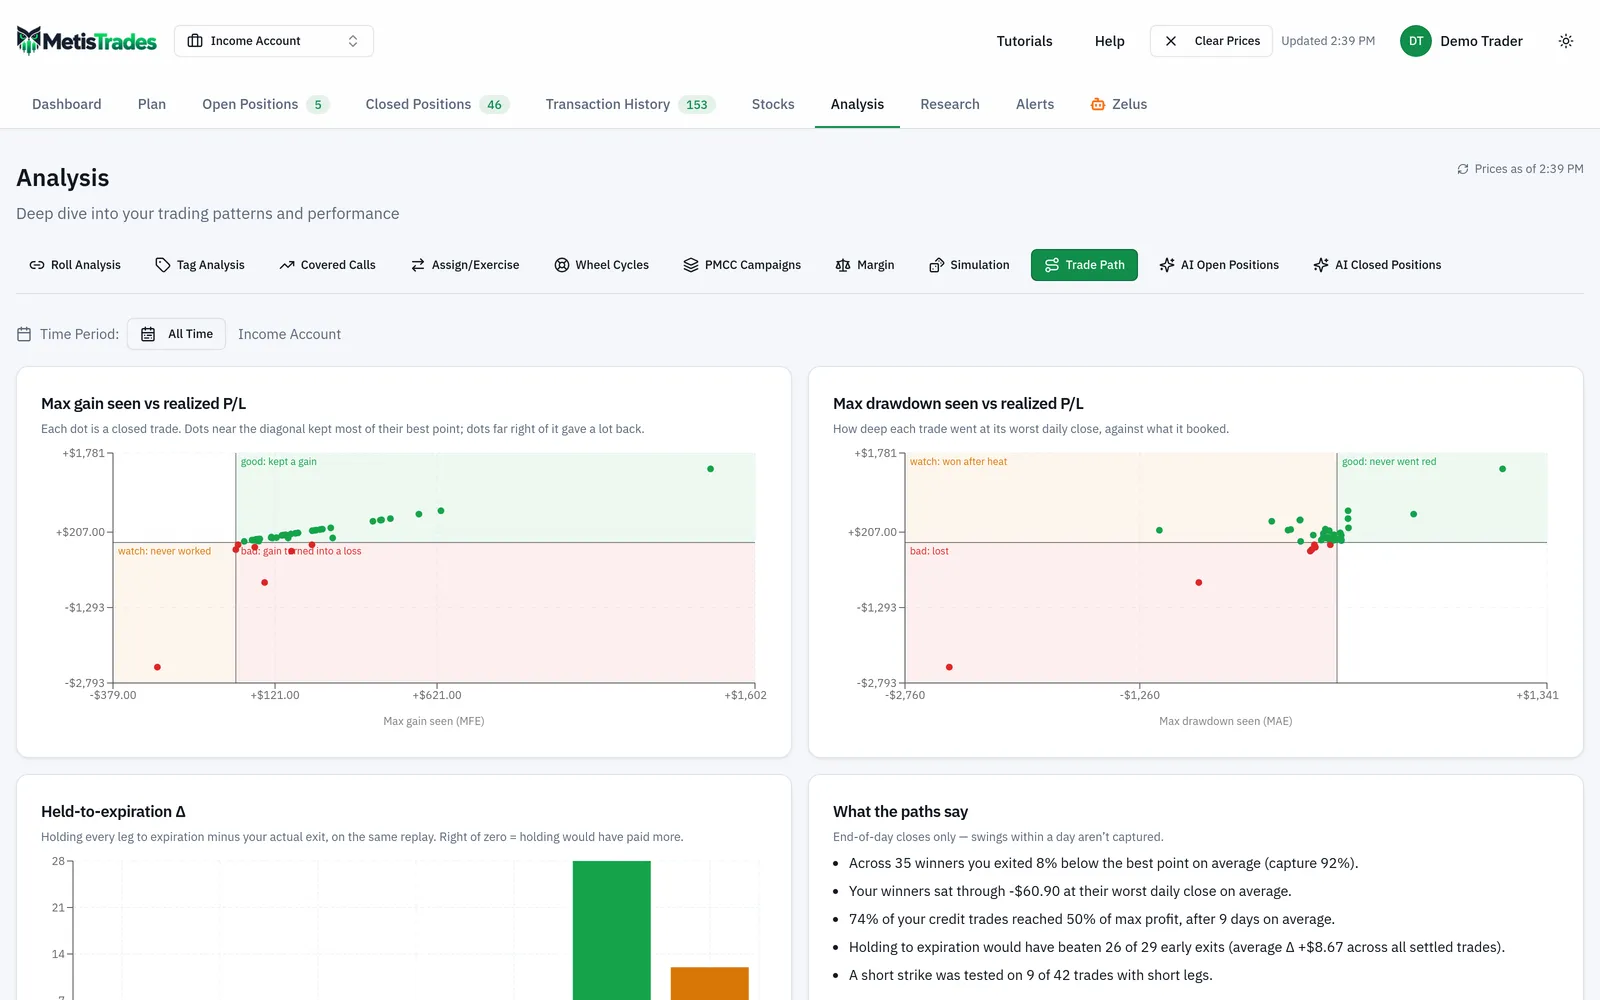
Go to Analysis → Trade Path. The period picker is the dashboard's, set to All Time by default, and it selects trades by their exit date, exactly as Closed Positions does. The account label follows the header's account scope, so a Pro user can look at one trading account or All Accounts. Look first at the row at the top of the page: the period picker and the account scope, with the measuring progress next to them while trades are being measured.
2. Let the measuring finish
While trades are being replayed, Measuring trades… N of M shows progress and results appear as they finish. Each trade's quotes are paid for once and saved, so a second visit is immediate. Measuring has its own daily allowance per user — separate from Trade Backtest batches — plus a shared daily ceiling; when either runs out, a note says the remaining trades continue tomorrow. In the worked scenario all 42 measurable trades finished in one visit.
3. Read the charts and the readouts
Work down the page: the two scatter charts, the Held-to-expiration Δ histogram, the What the paths say readouts, and the coverage footer. The next section goes through each of them with this account's numbers.
4. Put the same figures next to each trade on Closed Positions
Open Closed Positions and turn on Max gain seen, Max drawdown seen, Capture % and Held-to-expiration Δ in the column settings — they are Pro columns and hidden until you turn them on. Each is sortable. Sorting by Capture % ascending puts your worst-timed exits at the top; cells that read Turned into a loss, Closed flat or n/a sort below every percentage. Hover Max gain seen for the date it happened — Jul 28 for Trade A. The totals row shows the average of each column over measured trades, counting each position once.
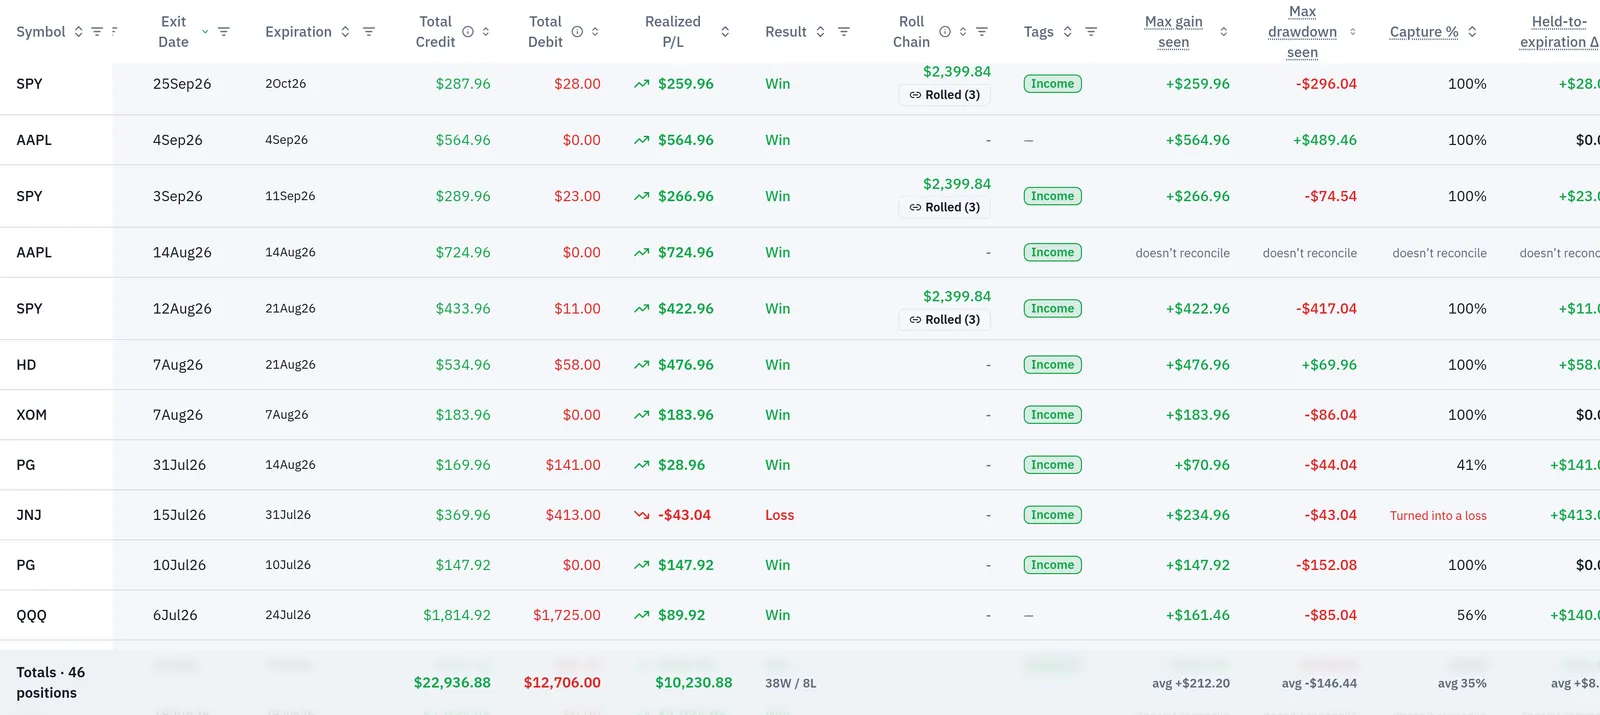
A cell can also read computing…, continues tomorrow, retrying later, not measurable, doesn't reconcile, or once fully closed for a part-close row of a position still open. Hover any of them for a short explanation. Opening the page as a Pro user starts measuring every closed trade that has no saved result yet, including trades added by an import or broker sync.
5. Open one trade's path
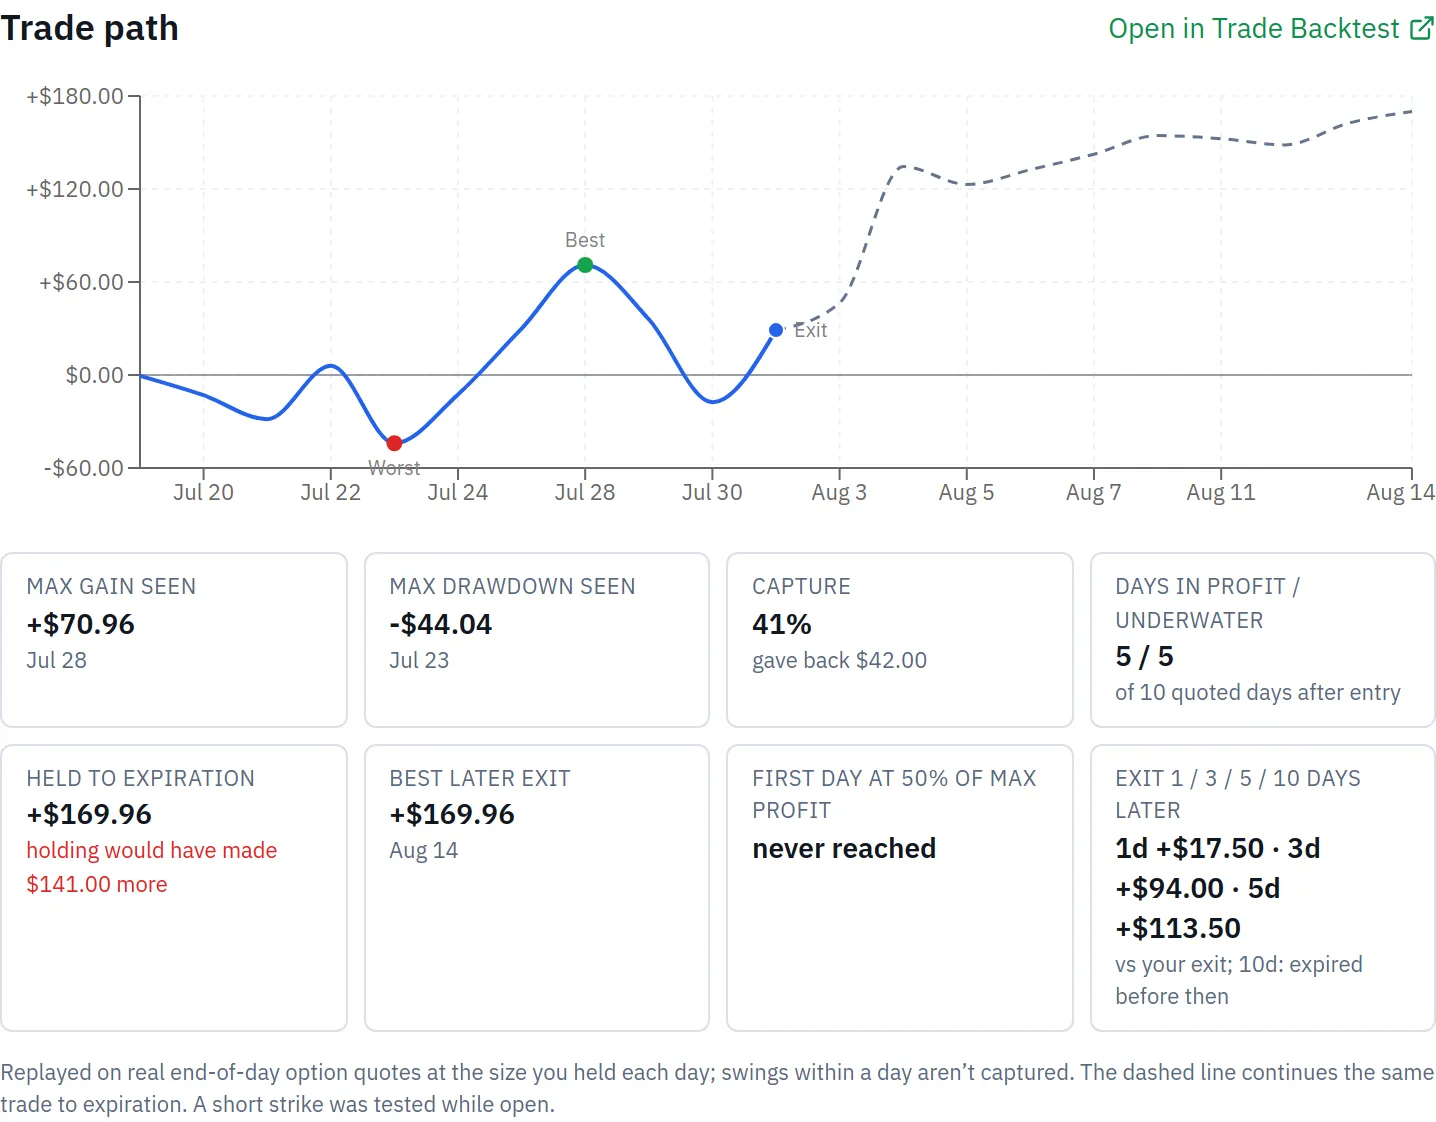
Select a row to open its position details and scroll to the Trade path section. Look at the daily P/L line from entry to your exit, with Best, Worst and Exit marked, and the dashed continuation from your exit to the last expiration — what the same position would have done if held. Below it sits the stat row: Max gain seen, Max drawdown seen, Capture, Days in profit / underwater, Held to expiration, Best later exit, First day at 50% of max profit, and Exit 1 / 3 / 5 / 10 days later.
6. Open the same trade in Trade Backtest
Select Open in Trade Backtest at the bottom of the section. It opens Trade Backtest with the identical replay — your real fills, part-closes and exit — where the P/L over time chart marks the best and worst closes with dots and your exit with a pink diamond. From there you can change the exit rules and ask what a 50% profit target or a different hold would have done.
7. Keep the summary figures in front of you
The Trade path group in the Customizable dashboard widget catalogue (Pro) offers Average capture %, Average giveback, Average heat on winners, Share of days in profit, Average held-to-expiration Δ, Early exits expiration would have beaten and Trades with a short strike tested. Each position counts once, and trades that cannot be measured, do not reconcile or are still being measured are left out and listed in the tile's coverage note.
8. Ask about the numbers
On Pro you can ask Zelus, or an AI you connect under Settings → AI Connections, questions such as "am I closing winners too early?", "which trades did I give back the most on?" or "would holding to expiration have paid more this year?". The answer uses the same trades, figures and wording as this tab for the scope and period you ask about, with a link to each trade's Trade Backtest replay. It reads only results already measured here; trades not measured yet are counted and named as such, and you open this tab or Closed Positions to measure them.
On a phone the charts and readouts stack in one column, in the same order.
How to read the results
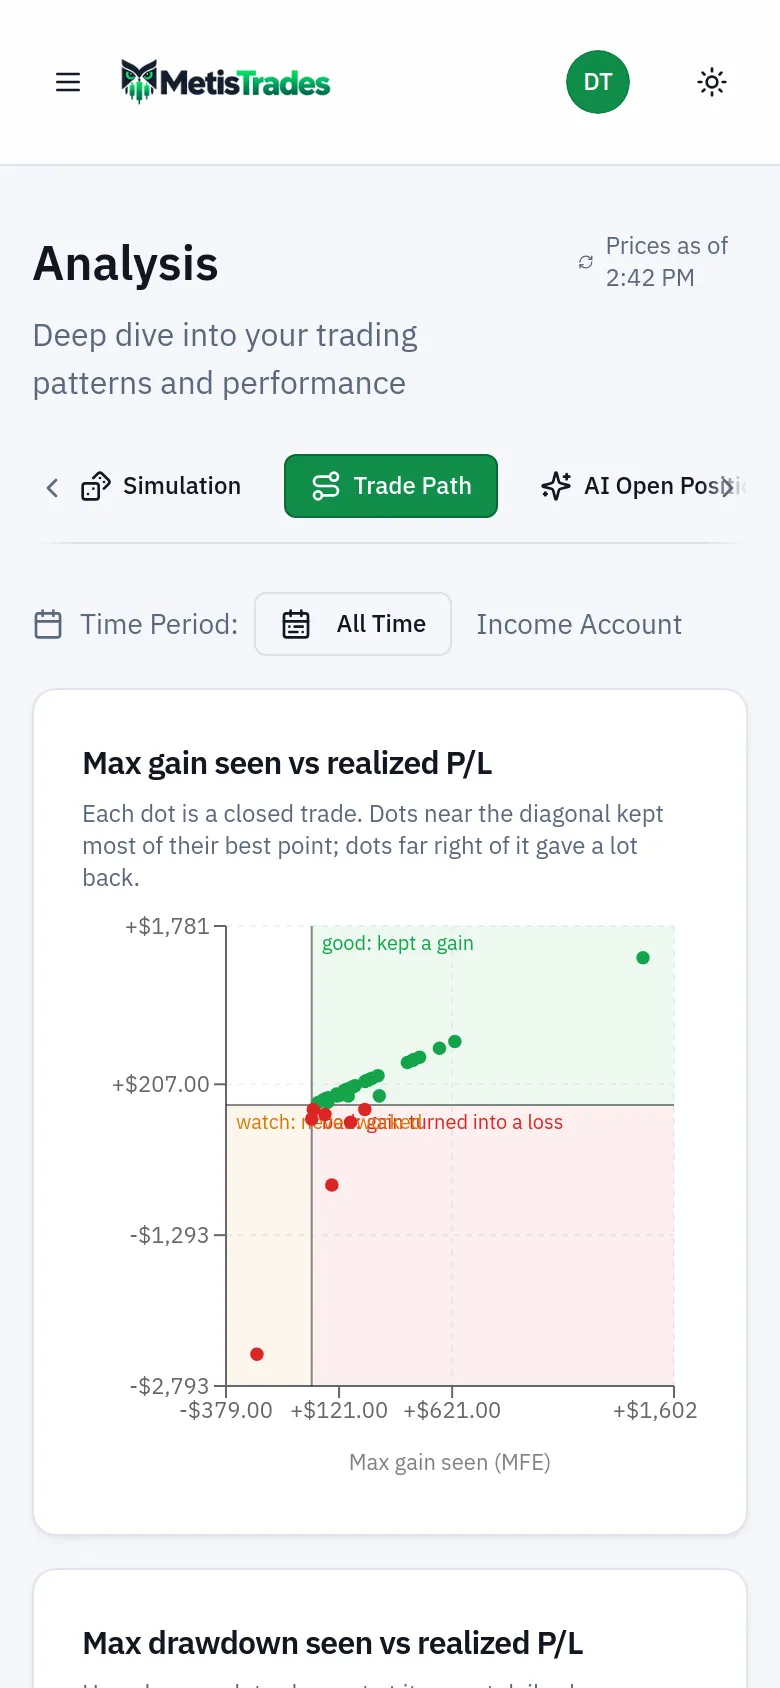
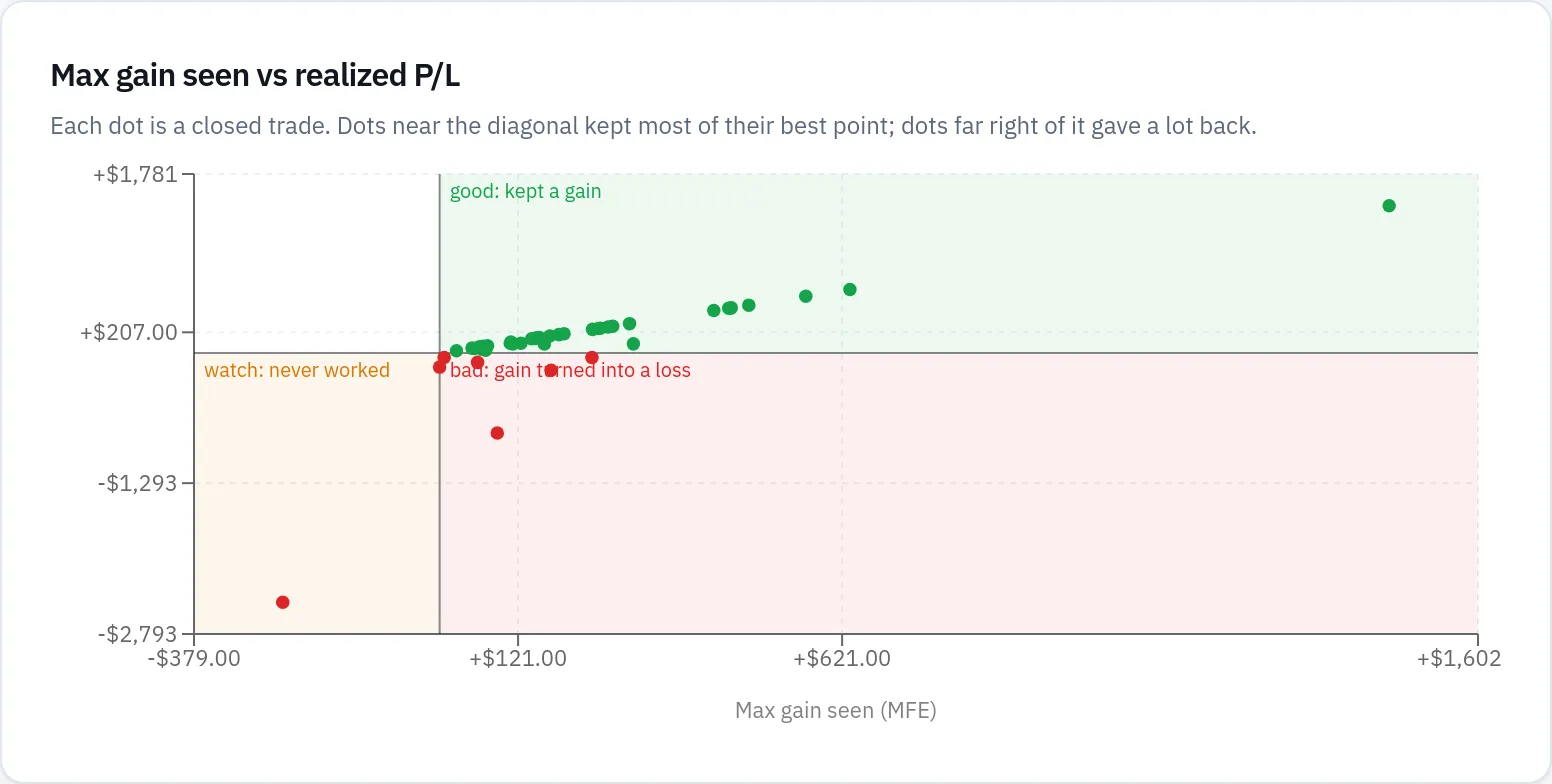
The first scatter chart plots max gain seen across and realized P/L up, one dot per measured trade. Its zones are good: kept a gain, bad: gain turned into a loss and watch: never worked. Dots close to the diagonal kept most of their best point. Trade D sits on the diagonal: its best close and its exit are the same day and the same number, +$259.96, so capture is 100% and giveback $0.00. Trade B sits in the red zone — up $234.96 on Jul 7, booked −$43.04. Click a dot to open that position.
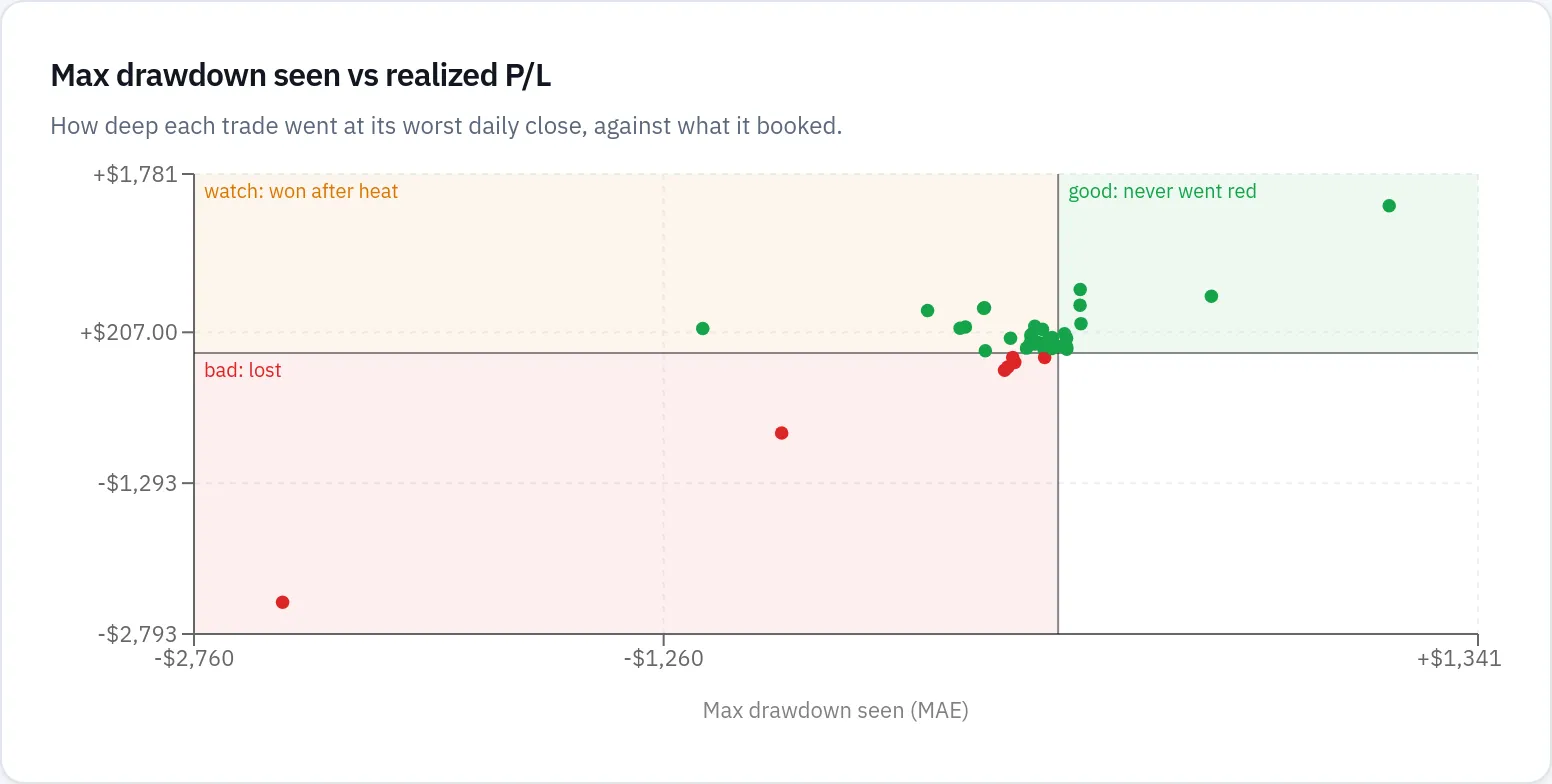
The second chart swaps the horizontal axis for max drawdown seen, with zones good: never went red, watch: won after heat and bad: lost. Trade D is the clearest "won after heat" case: it closed at −$296.04 on Sep 10 before finishing +$259.96. Trade A's worst close was −$44.04 on Jul 23, five days before its best close.
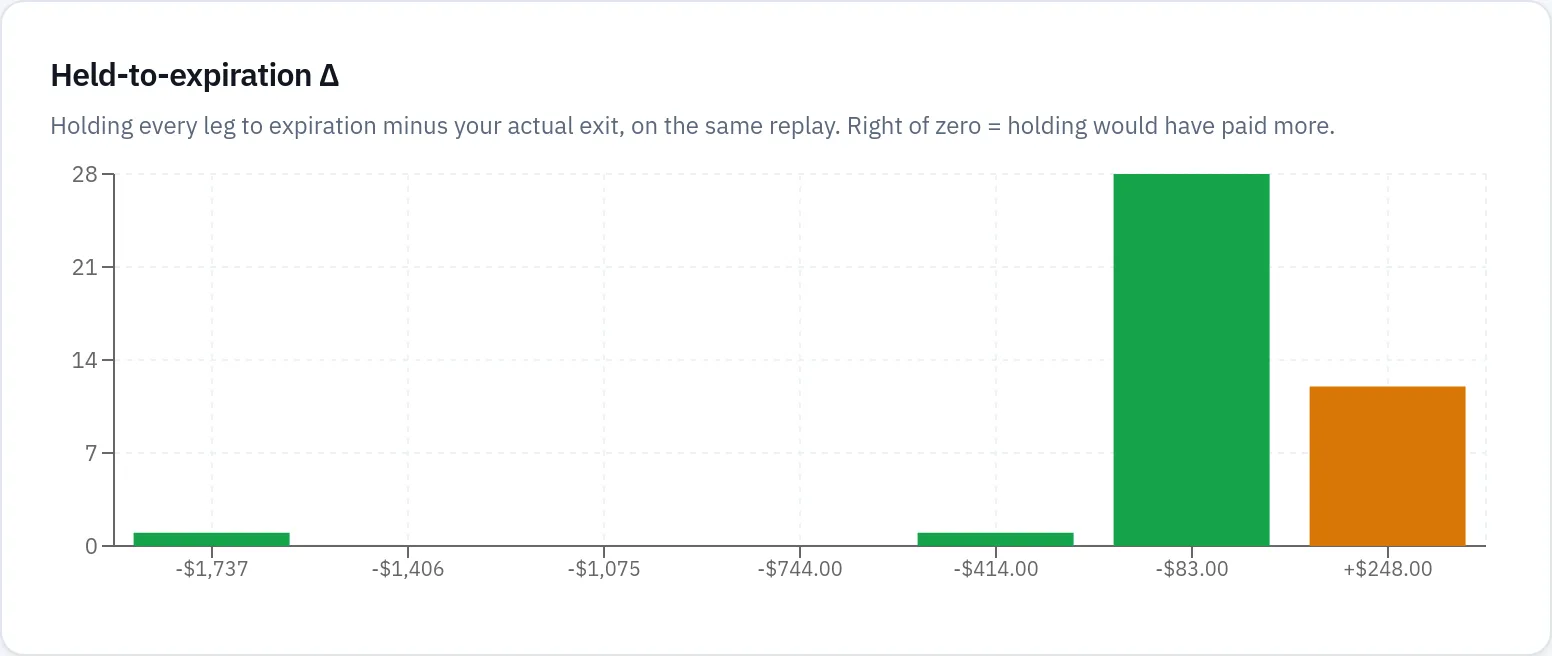
The histogram counts trades by held-to-expiration Δ, for trades whose last expiration has passed. Right of zero means holding would have paid more. Trade A sits at +$141.00 and Trade B at +$413.00. Trade C sits far to the left: holding would have ended at −$2,696.08 against a realized −$794.08, so the exit saved $1,902.00.
The readouts turn the measured set into sentences. For this account they say: "Across 35 winners you exited 8% below the best point on average (capture 92%)"; "Your winners sat through −$60.90 at their worst daily close on average"; "74% of your credit trades reached 50% of max profit, after 9 days on average"; "Holding to expiration would have beaten 26 of 29 early exits (average Δ +$8.67 across all settled trades)"; and "A short strike was tested on 9 of 42 trades with short legs".
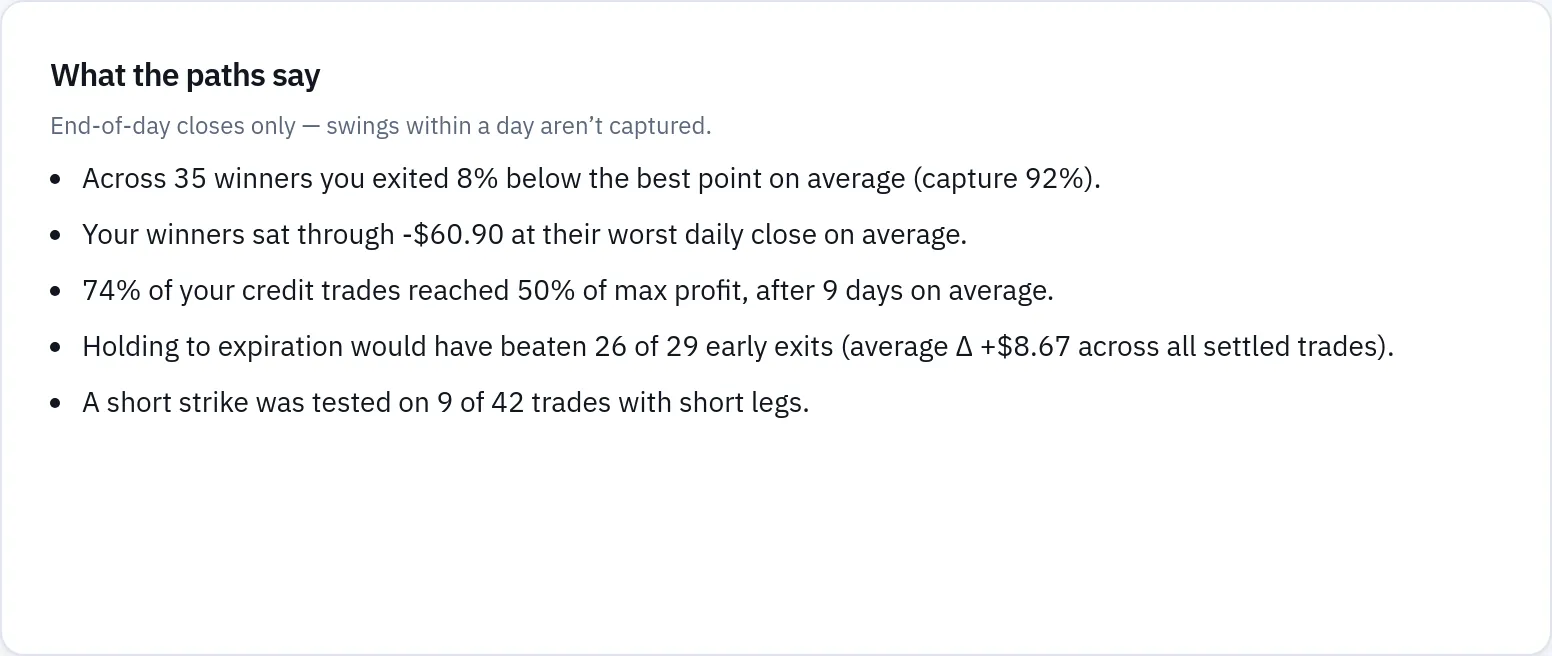
Read the held-to-expiration line carefully, because it is two different measurements in one sentence. The count — 26 of 29 — is early exits whose expiration has passed, and how many holding would have beaten. The +$8.67 in brackets is the average Δ over every settled trade, including those closed on expiration day. It is small because Trade C pulls it down hard: one exit that saved $1,902.00 offsets a great many that would have gained a hundred or two. "Holding usually beat my exit" and "holding would have made me more money overall" are not the same claim, and this account shows the first without the second.
Each trade's own stat row is where the habit becomes concrete. Trade A was in profit on 5 of the 10 quoted days after entry and underwater on 5; it never reached 50% of its max profit while open; its best later exit was +$169.96 at expiration on Aug 14; and waiting 1, 3 or 5 days past the actual exit would have been worth +$17.50, +$94.00 and +$113.50 more, with the 10-day point reading expired before then. A short strike was tested — a day's low crossed the 142 strike — which is a fair reason to have been nervous, and the figure is there so you can weigh the nerve against the money.
Trade B shows the opposite error. It reached 50% of max profit on Jul 7, 8 days after entry, and was not closed there; it then ran to its worst close of −$43.04 on the day it was closed. Days in profit / underwater reads 8 / 3 of 11 quoted days. Trade D shows a trade that did everything right by these measures: 100% capture, $0.00 given back, and only $28.00 of remaining premium left on the table.
What these numbers do not mean: a 41% capture is not a verdict that closing Trade A was wrong. The replay knows the outcome; you did not. Capture, giveback and held-to-expiration Δ describe what happened to prices after the fact, not a rule you could have followed in advance with the same result every time.
Limits and assumptions
- End-of-day only. Every point is a daily close. A trade that touched a bigger gain or loss inside a day shows only its closing values, so Trade A's real worst moment may have been deeper than −$44.04.
- One position at a time. A trade is one position as Closed Positions defines it, with all legs and part-closes together. Roll chains are not combined; each position in a chain is measured on its own.
- What is not replayed. Stock-only positions and futures options are not measured, and a stock leg inside an option position is left out of the replay. Positions opened before March 2022, same-day trades, positions with no recognisable contracts and contracts the vendor has no history for cannot be replayed — the AMD put in this account is the last case.
- Reconciliation. The replay's final P/L must match the journal's realized P/L within fees plus a small rounding allowance. The three assigned trades here do not, so they are shown but kept out of every average rather than silently included. A part-close is priced at that day's closing mid rather than your fill, which can also open a gap.
- What-ifs ignore early assignment. A held leg is valued at its daily close and settled at intrinsic value on its expiration, so "holding would have made $141.00 more" on Trade A assumes the short put was not assigned early.
- Gaps stay gaps. Days the vendor skipped can be filled from stored quotes; remaining gaps are never valued at $0. That is why the day counts read "of 10 quoted days" and "of 11 quoted days" rather than calendar days.
- Regime facts (VIX on the entry and exit days, entry-day relative volume) are saved with each trade but are blank when the daily candles were not available.
- Historical measurement, not prediction. None of these figures is advice or a forecast, and nothing here says a future trade will behave the same way. Options involve risk, including assignment and loss.
Common mistakes
- Treating the average Δ of +$8.67 as "holding barely helps". Read the count beside it — 26 of 29 — and look at the histogram's left tail before drawing a rule.
- Comparing averages across different coverage. The 4 unmeasured trades are excluded everywhere; do not reconcile the Trade Path averages against a 46-trade P/L total.
- Reading a "doesn't reconcile" trade as broken. Three here simply had a leg assigned. Open the position details to see the assignment, and expect the replay and journal to differ.
- Sorting Capture % and assuming the bottom rows are the worst exits. Turned into a loss, Closed flat and n/a sort below every percentage by design — check the cell label, not just the position.
- Taking max drawdown seen as the worst the trade ever got. It is the worst daily close only; intraday swings are not captured.
- Judging a single trade instead of the habit. Trade A and Trade C point in opposite directions; the readouts across 42 trades are the figure to act on.
- Expecting Zelus to fill in missing trades. It reads saved results only — open Trade Path or Closed Positions to measure the rest, and come back tomorrow if the allowance has run out.
Related guides and help pages
Related guides
- Plan, Track, Optimize: a complete tour of MetisTrades
- MFE and MAE explained: are you closing winners too early?
- Replaying one options trade with Trade Backtest
- Analyzing closed-trade performance: win rate, expectancy and profit factor
- Building a custom dashboard in MetisTrades
- Win Rate Is Not Enough: Expectancy and Profit Factor