Replaying one options trade with Trade Backtest
Trade Backtest replays a single options trade from a past entry date on end-of-day closes. This guide follows one SPY put spread from setup to result, then covers rolls, bulk runs and the limits of the answer.
What it does and when to use it
Trade Backtest answers one question: what would have happened if I had opened this exact trade on that day? You pick a symbol, a past entry date and up to eight option or stock legs, choose how long to hold and under what conditions you would have closed, and the page replays the position one trading session at a time using each day's closing prices.
That is a narrower question than it sounds, and the narrowness is the point. You are not testing a strategy. You are testing one trade, with its real strikes and real expirations, against the prices that actually printed.
A few terms, in case any of them are new. An option is a contract on 100 shares of an underlying stock or ETF (other multipliers exist, but Trade Backtest only handles standard 100-share contracts). A put gives its holder the right to sell at a fixed price, the strike, up to the expiration date. Selling a put and buying a lower-strike put with the same expiration is a put credit spread: you collect money up front, the lower put caps how much you can lose, and you keep the credit if the stock stays above the higher strike. Mid is the midpoint of the closing bid and ask, the default price Trade Backtest uses to fill a leg. A profit target closes the trade once open profit reaches a percentage of the credit; a stop loss closes it once the loss reaches a percentage of the credit. The risk basis is the maximum loss at entry (or a margin estimate when loss is unlimited), and return on risk is the final profit or loss divided by it.
Try the Trade Backtest Tool for free! (no sign-in)
When it helps
- Testing an exit rule you argue with yourself about. Would a 50% profit target have beaten holding to expiration on that trade? Run both and read the two results.
- Reviewing a trade you actually placed. The Backtest button on your own position loads its entry date, legs and your fill prices and runs them, so you can change one rule at a time and see what else would have happened.
- Checking a plan you never placed. What if I'd taken it? on Plan › Planned Trades opens this page with the plan's legs filled in.
- Seeing what the market thought at the time. The Odds at entry vs result card shows the chance of profit implied by the entry day's volatility next to what actually happened.
How it differs from the Strategy Backtester
Trade Backtest replays individual trades. Each run is one position with its own start and end, and when you run many at once the results are listed side by side rather than combined. The Strategy Backtester is the tool for a rule-based strategy tested over years of entries, with position limits and a portfolio equity curve. If your question is "how did this trade go," use Trade Backtest. If it is "how would this system have compounded," use the Strategy Backtester.
Who can run what
Trade Backtest is public: anyone can open it and run backtests without an account. How far back you can set the entry date depends on access. Signed-out visitors can pick entry dates up to 14 days back, counted in calendar days from the entry date to today. Everyone with Pro can pick any entry date back to March 1, 2022, which is where the data provider's options history starts; no one can start before that date. The exit can be any session after the entry, up to the latest close, so even on the 14-day limit a trade can run from the entry all the way to today.
The bulk modes — Optimize exits, Trade list and Entry dates — are Pro only, as is saving and comparing backtests. Without Pro you can open those tabs and see what they do, with a Sign in and Upgrade to Pro prompt where the controls would be.
A worked scenario
On Monday, August 5, 2024, SPY closed at $517.38. The question: if you had sold a put credit spread that afternoon, below the market, and managed it with a 50% profit target and a 200% stop loss, what would have happened?
The trade: sell 1 SPY 500 put and buy 1 SPY 495 put, both expiring September 20, 2024 — 46 days out. When the chain loaded for that entry date, the line beside the date showed the close and that 578 expirations were listed.
The Entry price field was left blank on both legs, so each one fills at that day's closing mid.
| Leg | Contract | Closing mid | Cash per share |
|---|---|---|---|
| Sell 1 | SPY 500 put, Sep 20, 2024 | $13.56 | +$13.56 |
| Buy 1 | SPY 495 put, Sep 20, 2024 | $12.49 | −$12.49 |
| Net | +$1.07 |
The arithmetic from there is the arithmetic you would do on paper:
- Net entry: $1.07 per share × 100 = $107 credit.
- Max profit: the credit, $107, if both puts expire worthless above $500.
- Max loss: the $5 gap between strikes × 100 = $500, less the $107 credit = $393. That figure is the risk basis.
- Breakeven at expiration: $500 − $1.07 = $498.93.
Exit rules for the run: Hold until Expiration, Profit target 50%, Stop loss 200%, Commission $0.00, fills left on Mid. A 50% target on a $107 credit means the trade closes the first session open profit reaches +$53.50. A 200% stop means it closes the first session open profit reaches −$214.
What happened: SPY rose the next day, slipped back on August 7, then climbed to $533.27 by August 12. The spread never came close to the stop, and open profit crossed the target at the close on Monday, August 12.
- Result: closed at the 50% profit target on day 7, August 12, 2024, for +$54.00.
- Return on risk: $54.00 ÷ $393 = +13.7%.
- Days held: 7.
- Best point: +$54.00 (Aug 12). Worst point: +$1.00 (Aug 7).
The obvious follow-up — what if you had simply held it? — is a second run with both exit fields cleared. Same legs, same entry: +$107, return on risk +27.2%, 46 days held, exit reason Expiration on September 20, 2024. Best point +$107, worst point +$1.00, max drawdown −$17.50, annualized +216%.
Twice the money for six and a half times the days in the trade. The rest of this guide follows both runs through the screens.
Step by step in MetisTrades
1. Open the page
Go to Top nav → Research → Trade Backtest (route /research/trade-backtest). Signed out, it appears in the nav as Trade Backtest. The address bar holds the whole setup — symbol, entry date, legs, entry price overrides and exit settings — so any backtest can be bookmarked or shared, and a link with a complete setup runs as soon as it opens.
Try the Trade Backtest Tool for free! (no sign-in)
2. Enter the symbol and the entry date
Type SPY in Symbol and press Enter (or click away) to load it. Changing the symbol later clears the legs, so set it first.
Then pick Entry date: August 5, 2024. Weekends and market holidays are greyed out, and the picker stops at the earliest date your access allows. Once the chain loads, the line beside the date shows that day's close and how many expirations were listed — here, $517.38 and 578 expirations. If you open an older shared link beyond your lookback, the page shows an inline Upgrade to Pro prompt instead of running.
3. Build the legs
Quick presets cover the common shapes: Long call, Long put, Call vertical, Put vertical, Iron condor, Covered call, Cash-secured put and Strangle (short). A preset picks an expiration about five weeks out and chooses strikes from that day's chain, by delta where the data has it. Put vertical gets you most of the way to this scenario in one click; adjust the strikes afterwards.
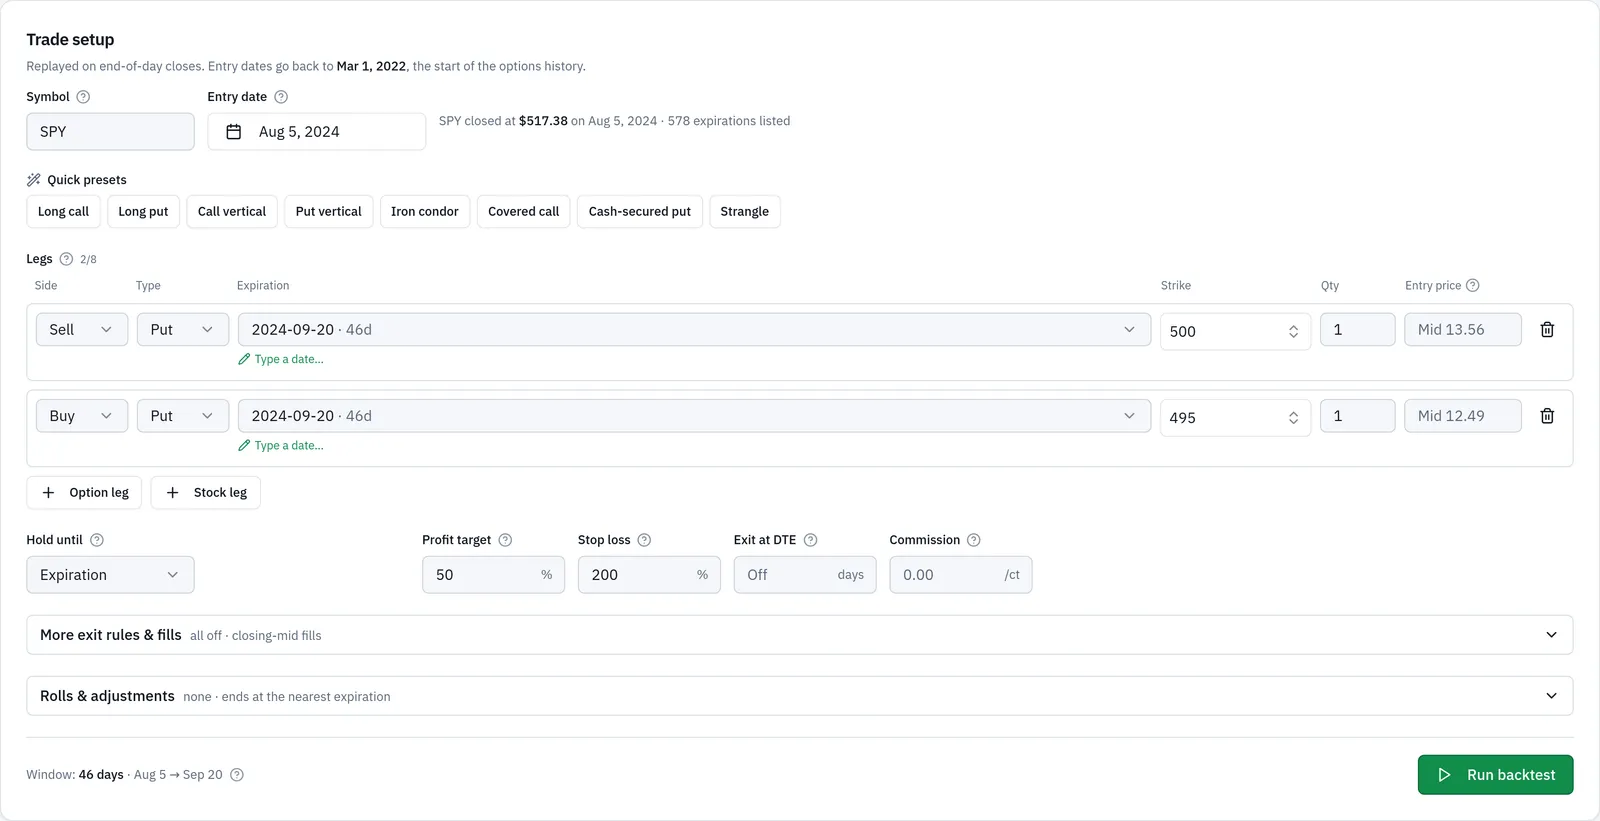
Each leg is Buy or Sell, and Call, Put or Stock. Option legs pick an expiration and a strike from the lists quoted on the entry date, and each list also lets you type a value. Quantity is contracts for options, shares for stock. For this trade: leg 1 Sell, Put, Sep 20 2024, strike 500, quantity 1; leg 2 Buy, Put, Sep 20 2024, strike 495, quantity 1.
Entry price is optional on every leg. Leave it blank to use that day's closing mid (or the close, for stock), or type the fill you actually got. A typed entry price overrides the fill model.
4. Set Hold until and the exit rules
Hold until has three settings: Expiration (the nearest option expiration), A date (any session after the entry, up to the latest close), or Latest close (the most recent session). This run uses Expiration.
Below it sit Profit target, Stop loss, Exit at DTE and Commission, all optional — leave a field blank to switch it off. The commission field is per contract. Enter 50 and 200 in the first two, leave Exit at DTE blank, and leave Commission at 0.00 for this run.
Here is the whole setup in one view. Look at the two legs with their blank entry price fields, the Hold until selector, and the four exit fields underneath.
5. Open More exit rules & fills if you need them
More exit rules & fills opens a section below the exit fields. Everything in it is off until you fill it in, and its heading says how many rules are on. The rules are:
- Trailing stop — closes once open P/L falls a set amount below its best close so far, as a % of the risk basis or a dollar amount. After arms it only once open P/L has first reached a chosen profit.
- Exit if price ≥ / ≤ — closes once the underlying closes at or above (or at or below) a price.
- Exit when price crosses a breakeven — closes once the underlying closes across one of the entry-day breakevens, moving away from where it was at entry.
- Short leg delta ≥ — closes once any short option's delta, ignoring sign, reaches the level, for example 0.30.
- Exit the session before earnings — closes on the last session before an earnings report trades: the day before a before-the-open report, the report day for an after-the-close one. A report with an unknown time is treated as before the open, and when earnings dates are not known for part of the trade the result says so rather than guessing.
The same section holds the Fills model: Mid (the closing bid/ask midpoint, the default), Natural (buy at the ask, sell at the bid) or Mid + slippage (the mid moved against you by a % of the bid/ask spread and/or a fixed $ per contract, where 50% of the spread is the natural price). The model applies to the entry and to every early exit. Options at expiration still settle at intrinsic value.
The window line at the bottom shows how many days the setup spans. Select Run backtest. Windows of 14 days or less can also be viewed hourly; hourly prices only reach back several months, so an older trade asked for hourly shows daily closes with a note saying so.
6. Add rolls and adjustments when the trade changed
Real trades move. A short put gets rolled down and out; a hedge is added; one leg comes off. Calendars, diagonals and poor man's covered calls need to keep going after the short leg expires so a new one can be sold. Rolls & adjustments, below More exit rules & fills, replays that. Each Adjustment row takes a date (a session after the entry), an action and the leg it applies to: Roll, Add a leg, Close or Change quantity. Legs are numbered as in the setup, an added leg takes the next number, and a rolled leg keeps its number.
A poor man's covered call shows the shape well. This one bought 1 SPY 440 call expiring March 21, 2025 and sold 1 SPY 545 call expiring July 19, 2024 on June 3, 2024, with Hold until: A date set to October 11, 2024. The short call was rolled three times. Look at the dated rows and the strike and expiration each roll moved to.
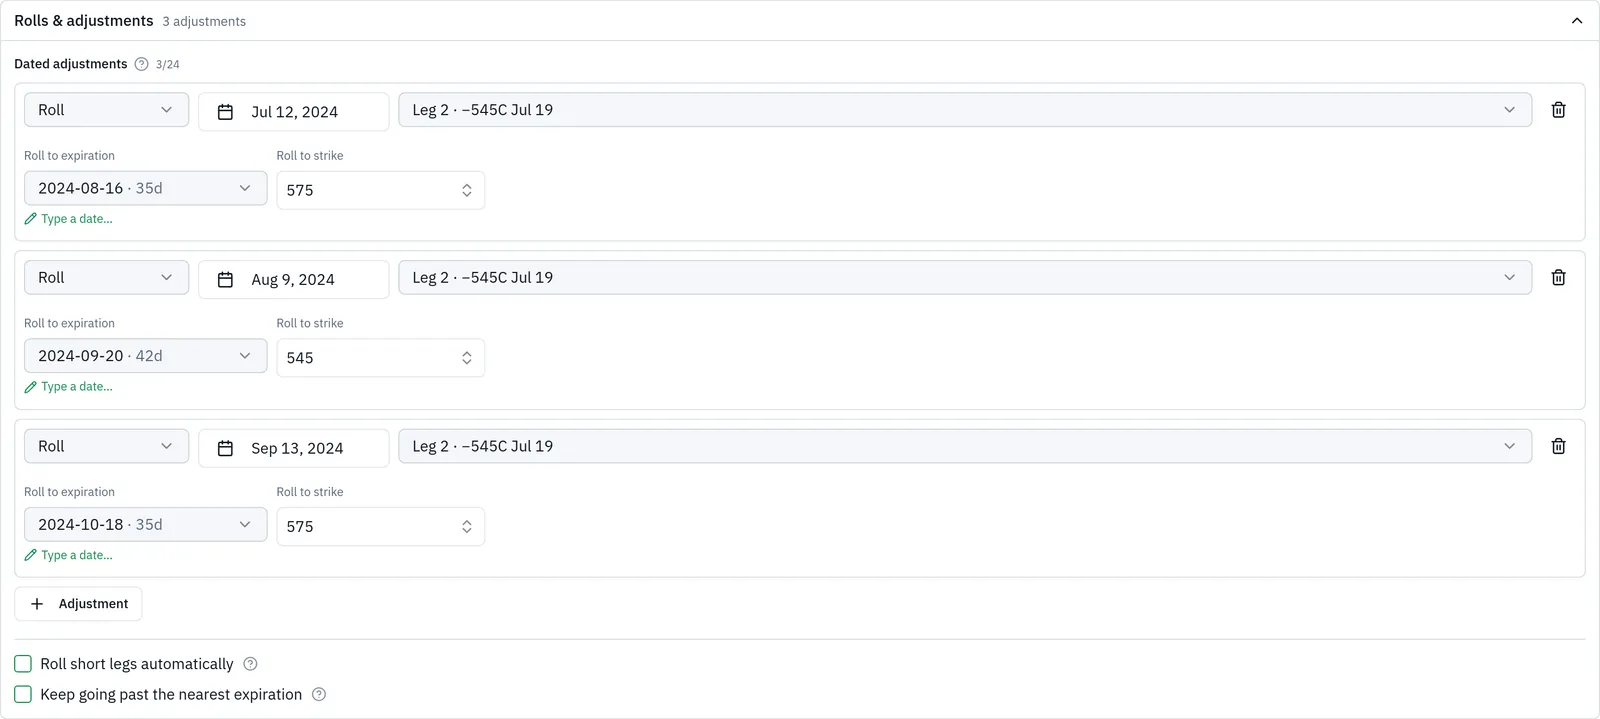
The rolls were July 12, 2024 to the August 16, 2024 575 call; August 9, 2024 to the September 20, 2024 545 call; and September 13, 2024 to the October 18, 2024 575 call. The replay returned +$1,771, a return on risk of +14.1% over 130 days held, with a worst point of −$2,012 and a max drawdown of −$3,886.
Two automatic options sit in the same section. Roll short legs automatically rolls any short option once it is At DTE calendar days or fewer from expiration (or on its expiration day), to the listed expiration nearest Roll out to days away, at the strike whose delta is nearest Target delta (blank means the leg's own delta at entry). "Roll the short put at 21 DTE to about 45 days" is At DTE 21, Roll out to 45. The data provider's list of expirations isn't dated, so the one nearest Roll out to can be one that wasn't trading yet on the roll date, which is common with SPY's daily expirations. When it had no quotes that day, the roll tries up to 3 others, weekly (Friday) expirations first, within 16 days of the target (or half the target if that's more). The result's notes say which expiration it rolled to and which ones had no quotes; the leg is held to expiration only when none of them had quotes. Each extra expiration tried costs one more lookup, and if the run's set-aside lookups run out, rolling stops with a note and later short legs are left to expire. Keep going past the nearest expiration settles expired legs at intrinsic value and runs the trade on with the rest.
Every adjustment is filled at that session's close with the trade's fill model and pays the commission; nothing is filled intraday. The new contract must have been listed and quoted that day — if it was not, the run is refused before it starts with the reason, and it is never filled at zero. Profit target and stop loss keep the amounts they had at entry, and return on risk uses the largest risk the position carried, with the Risk basis tile naming which change set it. With the automatic roll, Hold until Expiration means the long leg's expiration, so a trade with no long option leg needs A date or Latest close.
7. Backtest a position you actually hold
You do not have to retype your own trades. In the position details panel, Backtest sits next to Analyze. It opens Trade Backtest in a new tab with that position's entry date, legs and fill prices filled in, and runs it straight away.
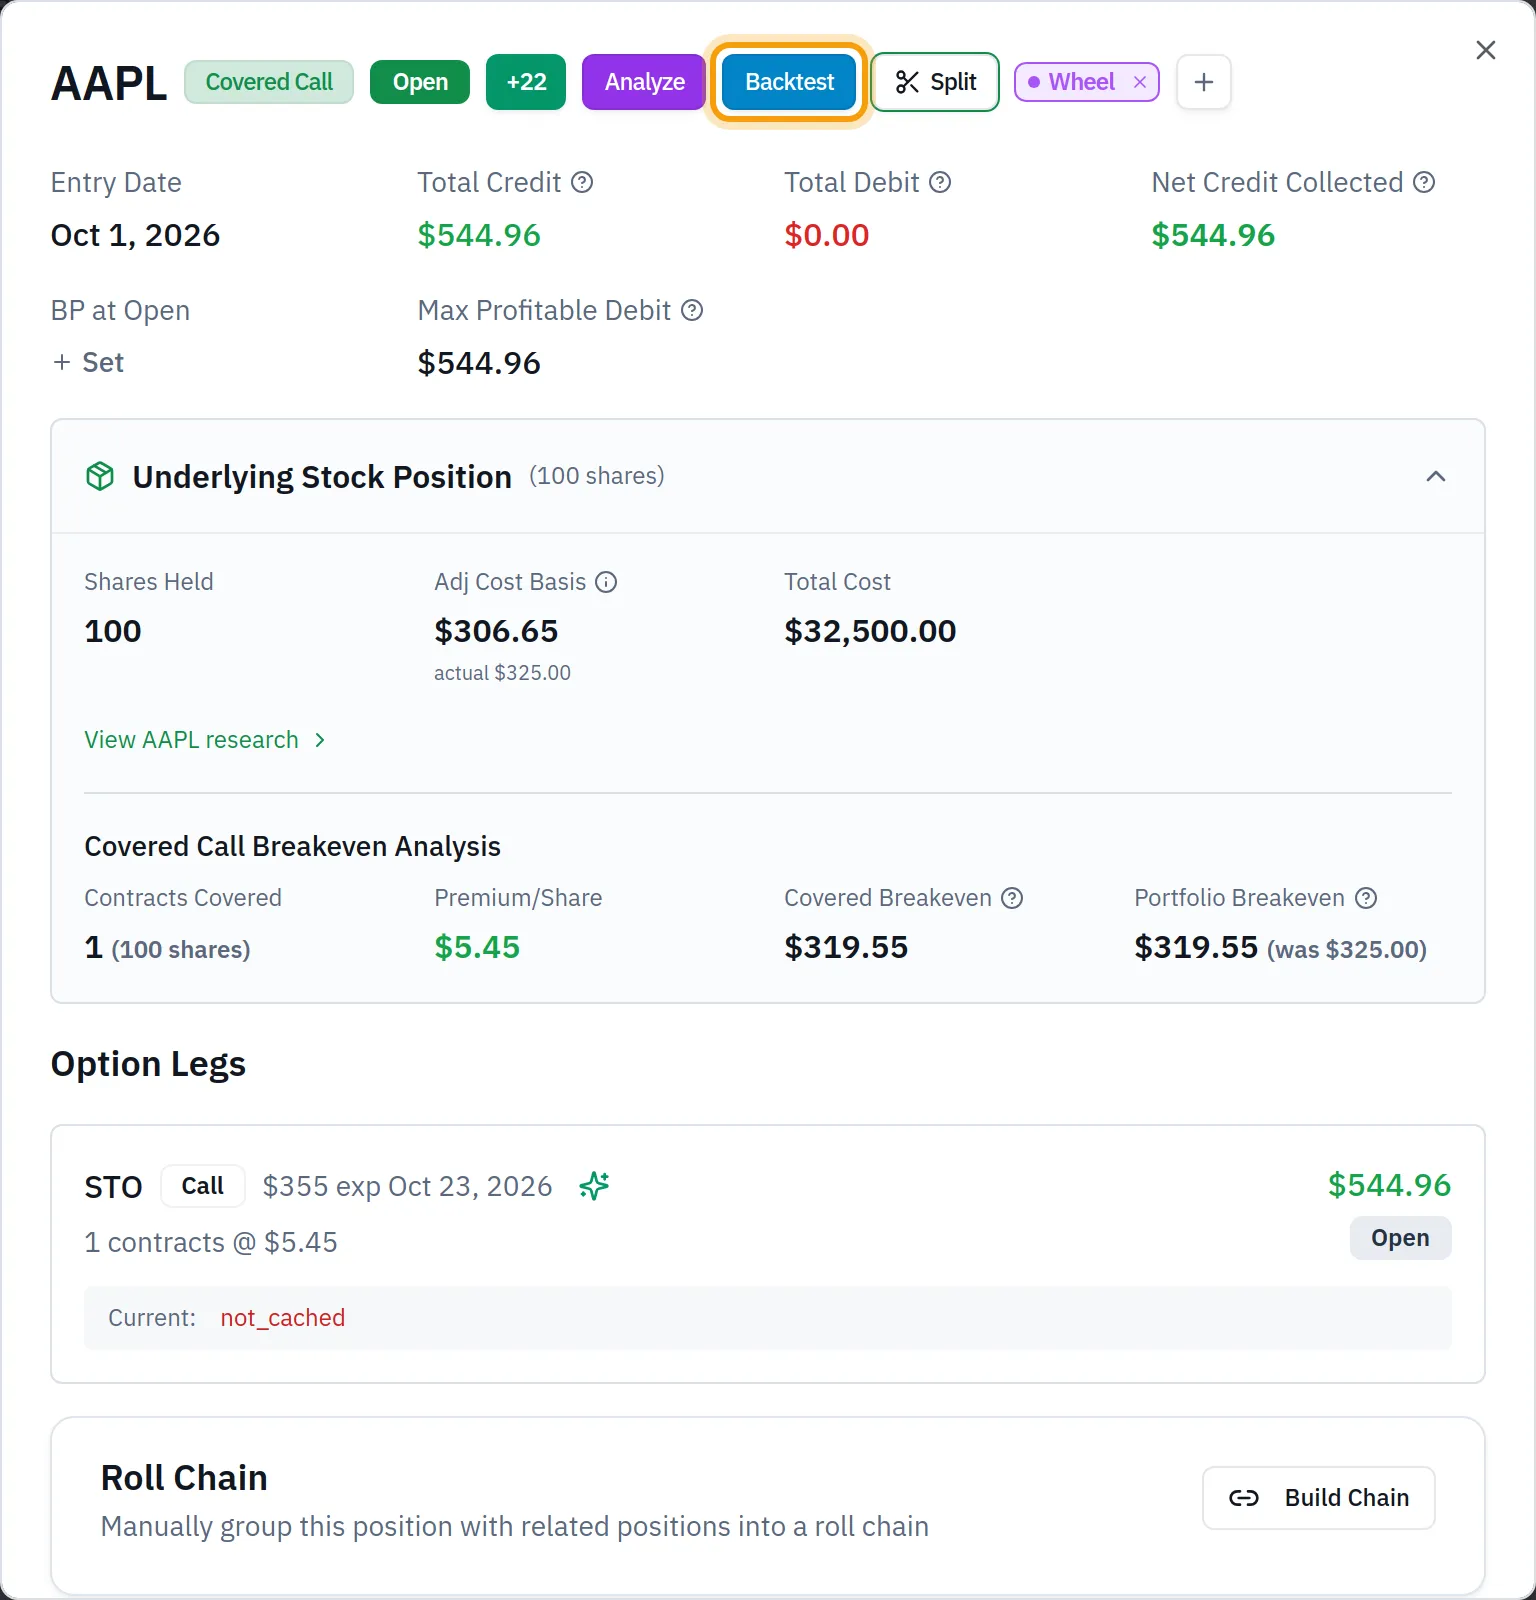
The same button appears on Open Positions, Closed Positions and the dashboard. Open Positions can show a Backtest column (turn it on in the column settings), and the dashboard's open and closed position tables have a Backtest icon on each row.
Signed in, Load from my positions above the trade setup does the same thing from a list. It shows the open and closed positions in the account you have selected, with symbol, strategy, opened and closed dates and P/L. Search by symbol or strategy, and switch between Open and Closed.
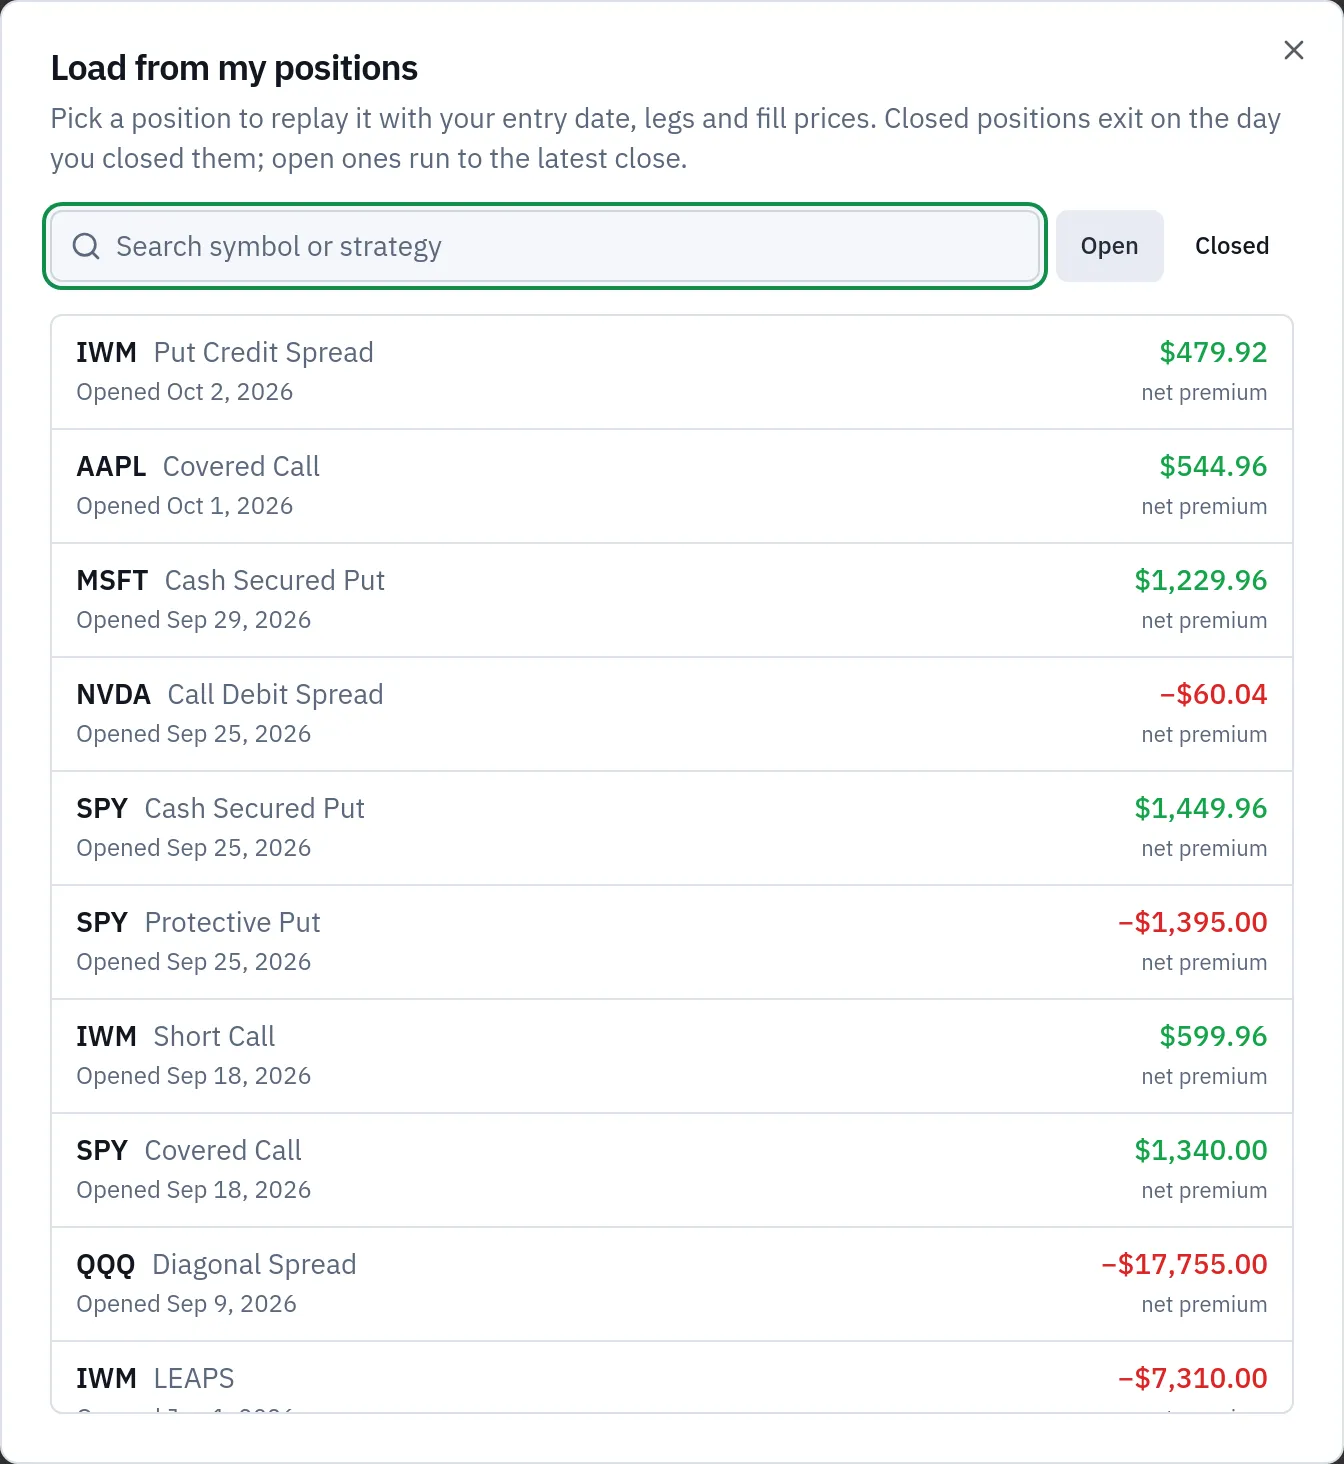
What gets filled in: the symbol and the day you opened the position; each option leg you opened that day with your actual fill price; and, for covered calls and protective puts, the stock leg too, at 100 shares per contract, bought at the entry day's close. A closed position exits on the day you closed it, so the first run shows your real trade. An open position runs to the latest close. Legs you added on a later day load as Add leg adjustments at that day's closing mid, legs you closed early load as Close adjustments, and part-closes load as Quantity changes.
A card above the setup names where the trade came from and your actual P/L (for an open position, the net premium so far), and lists anything approximated or left out. For a closed position, the P/L over time and price charts also mark Your exit with a pink diamond on the day you closed: on the P/L chart at your actual P/L (hover that day to see it next to the backtest's P/L, which can differ because of fill prices and commissions), and on the price chart at the underlying's close. What if I'd held to expiration? on the card sets Hold until to Expiration and reruns with your legs, fills and earlier adjustments, so the line carries on past your exit. If the backtest ends before the day you closed, for example because a tighter target is hit first, there is no diamond and a line under the chart gives your close date and P/L. Open positions don't get the diamond. Some positions cannot be backtested and show a greyed-out button with the reason: opened before March 1, 2022; futures options, mini options or any contract that is not 100 shares; stock-only; more than 8 legs on the first day; or opened today, or opened and closed the same day. Only the selected position's own legs load — a roll into a new position is not followed, so backtest each one or add the roll yourself.
8. Replay a plan you never placed
On Plan › Planned Trades, watching and archived rows have a What if I'd taken it? action, the clock icon, in Actions. It opens Trade Backtest with the plan's symbol and draft legs filled in, greyed out until the plan has draft legs. The entry date starts at the beginning of the plan's date window when that date has passed, otherwise the day you saved the plan, moved to the next trading session if it lands on a weekend or holiday. Each leg's entry price is the price you set on the plan, and Hold until is Latest close, or the expiration once it has passed. A card above the setup explains those defaults, and nothing runs until you select Run. The result is saved on the plan's row as an If taken chip, for example "If taken: +$340 · Oct 16".
9. Run many backtests at once
The toggle at the top right switches between Single trade, Optimize exits, Trade list and Entry dates. All three bulk modes run on the server with a progress bar; Cancel stops the batch and keeps the finished rows, and you can close the page and come back — a finished batch is still there. Your recent batches, up to 30, are listed under each mode.
Optimize exits keeps one trade and sweeps the rules. Build the trade as usual; the profit target, stop loss and exit-at-DTE fields are replaced by a card where you type lists of values separated by commas, plus a fourth list for trailing stops. Every combination of the lists is one variation, up to 200, with up to 20 values per list. The run loads the trade's price history once and replays it with each set of rules, so a sweep of 200 costs about the same data as a single backtest. Adjustments stay fixed.
Two more things can be swept below the exit rules. Sweep a strike takes one option leg and a list of target deltas (for example 0.16, 0.20, 0.25, 0.30; 16 also means 0.16) or of % away from the stock's entry close. For each value it picks the nearest strike listed on that leg's expiration in the entry date's chain, and the other legs keep their distance, so a $5-wide put spread stays $5 wide. Expirations and quantities stay as built, your built strike always runs as a reference row, and a value with no listed contract near it shows No matching contract. Compare fill models ticks any of Mid, Natural and Slippage and costs no extra data. The variation count is strikes × exit-rule combinations × fill models, still at most 200. Each new strike is a different contract with its own price history, so a strike sweep uses more of the daily allowance; the card shows the most lookups it can use. The grid then has pickers for strike and fill, and the table can be filtered or grouped by them. A strike sweep can't be combined with dated adjustments, since those name fixed strikes.
This sweep is a different trade, picked because the stop mattered: a SPY 553/548 put spread (sell the 553 put, buy the 548 put, expiring August 16, 2024) entered July 12, 2024, swept across targets of 25, 50 and 75% and stops of 50, 100, 200 and 300%. Read the grid left to right by target, and note how the colour changes.

Every 25% target cell came out at +$26.50. The 50% and 75% target rows are identical by stop: −$67.00 at the 50% stop, −$114 at 100%, −$205 at 200% and −$309 at 300%. On this trade the quick 25% target was the only winner, and widening the stop only made the loss bigger.
Trade list runs up to 50 different trades, each with its own symbol, entry date, legs and exit rules. In this mode the builder's Run button becomes Add to list. You can also Paste CSV or Upload CSV, one trade per line, and CSV template downloads the columns with examples. Legs are written like S_P_2025-04-04_560_1 (Sell, Put, expiration, strike, quantity) or B_STK_100 for stock. Lines that cannot be read are listed by line number and the rest are added. Add planned trades pulls trades from Plan › Planned Trades with a suggested entry date. Choose Each trade's own exit rules, or Same exit rules for every trade to apply one set to the list.
Entry dates tests one setup on many past dates. The builder is replaced by a card where each leg has a target Days out and a Strike by rule — Delta, % from stock, or Width from a leg — plus a schedule: On chosen weekdays, Every Nth session, Monthly on a day, or On dates I type. One batch runs at most 60 dates.
Each leg uses the expiration nearest its Days out that was quoted on the entry date. The data provider's list of expirations isn't dated, so the nearest one is sometimes an expiration that wasn't trading yet, often a SPY daily about five weeks out. The row then uses a nearby expiration that was quoted, weekly (Friday) expirations first, and says so under Contracts picked, for example "5/26 wasn't quoted on Apr 20; used 5/29 (39 days)". Legs with the same days out always share one expiration, and a calendar's far leg stays after its near leg. A row is refused only when none of the expirations tried had quotes, and the reason lists them.
To compare strikes across the same dates, type several values in one leg's Delta or % from stock box, separated by commas, for example 16, 25, 30. Every date then runs once per value, up to 5 values and 150 runs (dates × values) per batch, and a width leg measured from it keeps its width. The results add a By strike value table with win rate, average P/L, average win and loss, profit factor, entries finished and dates where nothing matched, with the best value on each line marked. It isn't a significance test: with few entries, one or two trades can change the order.
This batch is one SPY put-spread setup — sell the put nearest 0.30 delta about 35 days out, buy the put $5 below it — opened 35 days before each monthly expiration through 2024, with a 50% target, a 200% stop, hold to expiration and end-of-day closes. Look at the summary line first, then the bars, then the contracts column.
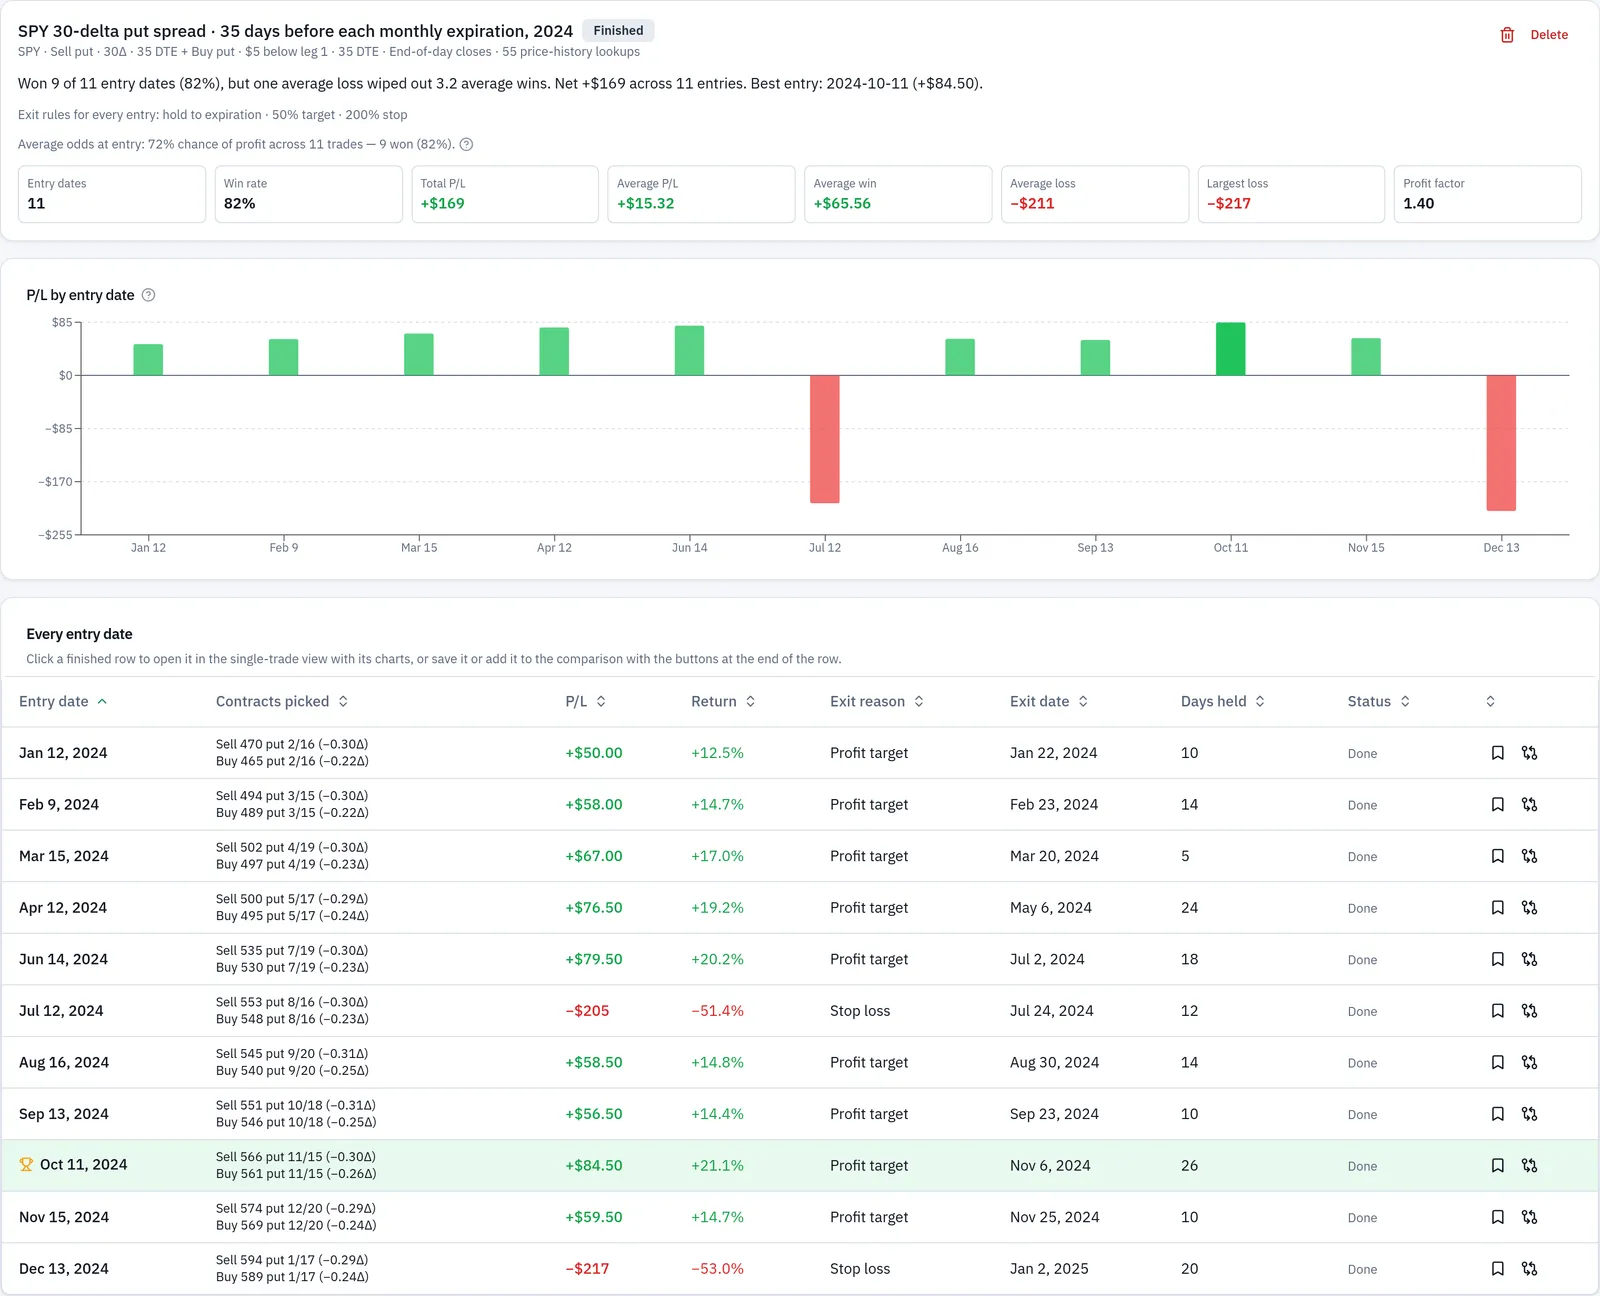
Eleven entry dates ran (the Fridays five weeks before each monthly expiration; May was left out). Nine won, a win rate of 82%. Total P/L +$169, average P/L +$15.32, average win +$65.56, average loss −$211, largest loss −$217, profit factor 1.40. The plain-English summary line reads that one average loss wiped out 3.2 average wins. Below it: average odds at entry of 72% chance of profit across the 11 trades, against 9 that won (82%). The two losers were July 12, 2024 (−$205, stop loss) and December 13, 2024 (−$217, stop loss); the best entry was October 11, 2024 at +$84.50.
All three modes show the same summary: number of trades, Win rate, Total P/L (or Best P/L for a sweep), Average P/L, Average win, Average loss, Largest loss and Profit factor. Each row carries its own outcome — Done, Refused with a reason, Data unavailable, or Cancelled — and one bad row never stops the rest. Run the unfinished rows retries the last two.
Bulk backtests draw on a daily allowance: up to 400 price histories per account per day, Eastern time. The server counts what a batch would need before it starts and refuses the whole batch if it would go over, without running anything. History already loaded recently is reused and does not count. For entry dates, each date's expiration and chain lookups count too — one iron condor entry uses about 7, so 60 of them (about 420) goes over the limit; split it across two days. Compared strike values share each date's lookups, but each value's contracts count. Two kinds of lookup are checked as the batch runs instead of all up front: a strike sweep's contracts, and an extra expiration tried because the nearest wasn't quoted (the entry-dates card shows these as "up to N more"). A row that would go over is skipped with a note to run it again tomorrow, and the other rows still finish. The recent-batches card shows how much of today's allowance is used, and one batch runs at a time per account.
10. Save, compare, or ask Zelus
With Pro, Save next to Copy link keeps a result under Saved backtests with a name (filled in for you, for example "SPY put spread · Aug 5, 2024") and optional notes. Saving reruns the setup once on the server and keeps that result, so it takes a few seconds. Finished rows in the bulk modes have their own save button. You can keep up to 300. Open loads a saved setup into the builder and reruns it; if the rerun's P/L, return on risk, exit reason or exit date differs, a note shows the old and new values, and the saved numbers stay as they were. Saved backtests cannot be shared with other people — use Copy link for that.
You can also ask Zelus, the Pro account assistant, to run the same backtests in plain words: "backtest selling the SPY 560/555 put spread on Aug 5, 2024 with a 50% profit target", or a sweep (including a strike sweep, "try the 0.16, 0.20 and 0.30 delta put on that", or a fill-model comparison), a list, an entry-date schedule with compared deltas, or a roll. It uses the same engine, so its numbers match the page. A single trade, a sweep of up to 12 combinations, a list of up to 5 trades, or up to 5 entry-date runs (dates × compared values) run right away; bigger runs are shown on an approval card with the row count and the share of your daily allowance, and run only when you select Apply.
How to read the results
Start at the top. The headline gives the final P/L in dollars and as a return on risk, the exit reason, and a one-line summary, with Return on risk, Exit, Days held, Best point and Worst point underneath.

For the SPY spread: +$54.00, +13.7% return on risk, closed at the 50% profit target on day 7. Days held 7 counts calendar days from August 5 to August 12; the trade was open over five trading sessions after the entry — August 6, 7, 8, 9 and 12. Best point +$54.00 and worst point +$1.00 are the highest and lowest open P/L on any close while the trade was on, which tells you something the final number does not: this position never showed a loss at any close. That is a feature of this particular week, not of put spreads.
Copy link beside the headline copies the address of the backtest so someone else can open it.
P/L over time, with Compare
The first chart plots open P/L at each close, green above zero and red below, with dots for the entry, exit, best and worst closes, and dashed lines at the profit target and the stop. Compare adds lines for putting the same amount — the risk basis — into the underlying or into SPY.
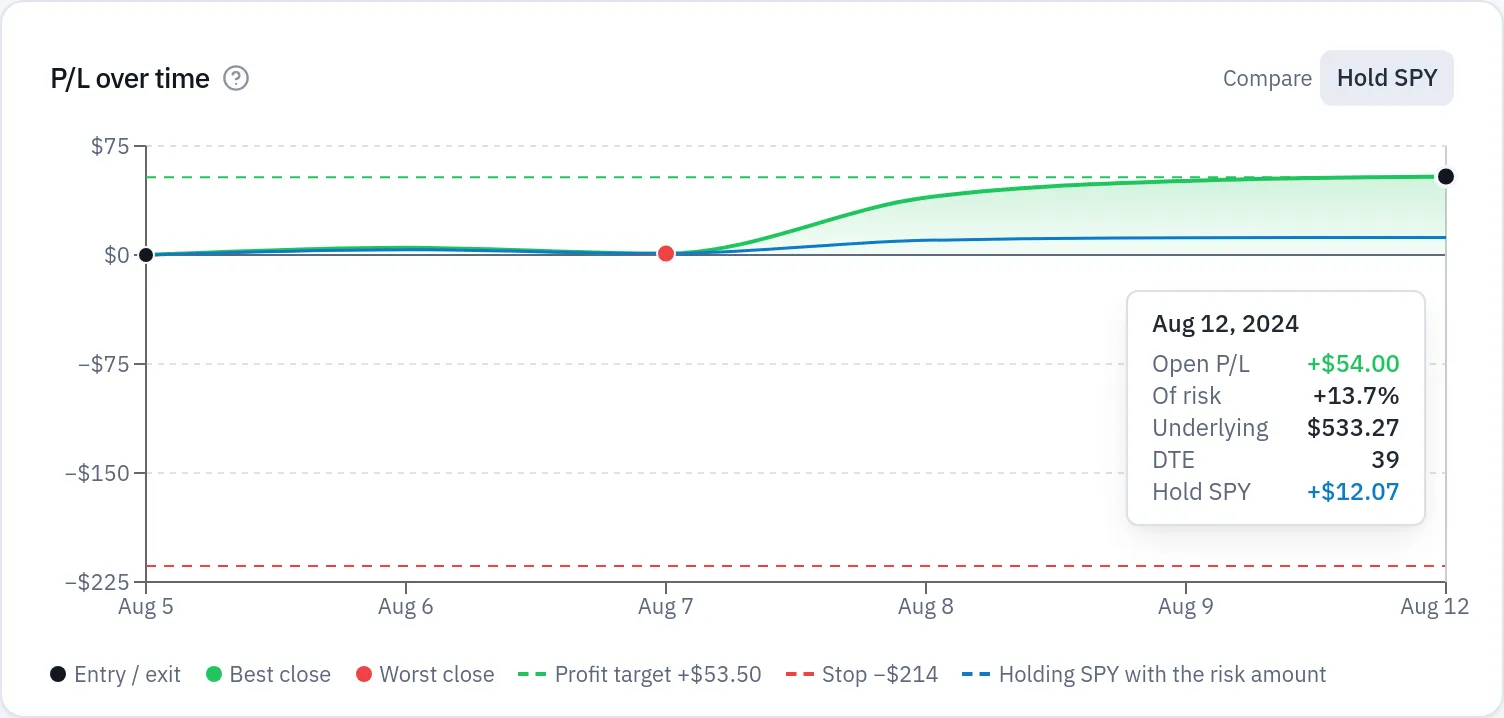
Because the underlying here is SPY, the two hold lines are the same and shown once. On August 12, holding SPY with the $393 risk amount was worth +$12.07 against the spread's +$54.00. That comparison buys at the entry close and sells at the exit close, and it leaves out dividends and commissions, so holding a dividend-paying stock looks slightly worse than it was. It is a yardstick for the same money over the same days, not a claim that one approach is better.
The dashed target line sits at +$53.50 and the stop at −$214, which makes the shape of the week obvious: the curve dipped toward +$1.00 on August 7, then ran up through the target three sessions later. On an adjusted trade, each adjustment day is marked with a dashed purple line (R roll, A add, C close, Q quantity) you can hover to read.
The symbol price chart
Below it, the underlying's daily close is drawn with each strike, the breakevens, and the shaded price zone where the position profits at expiration.
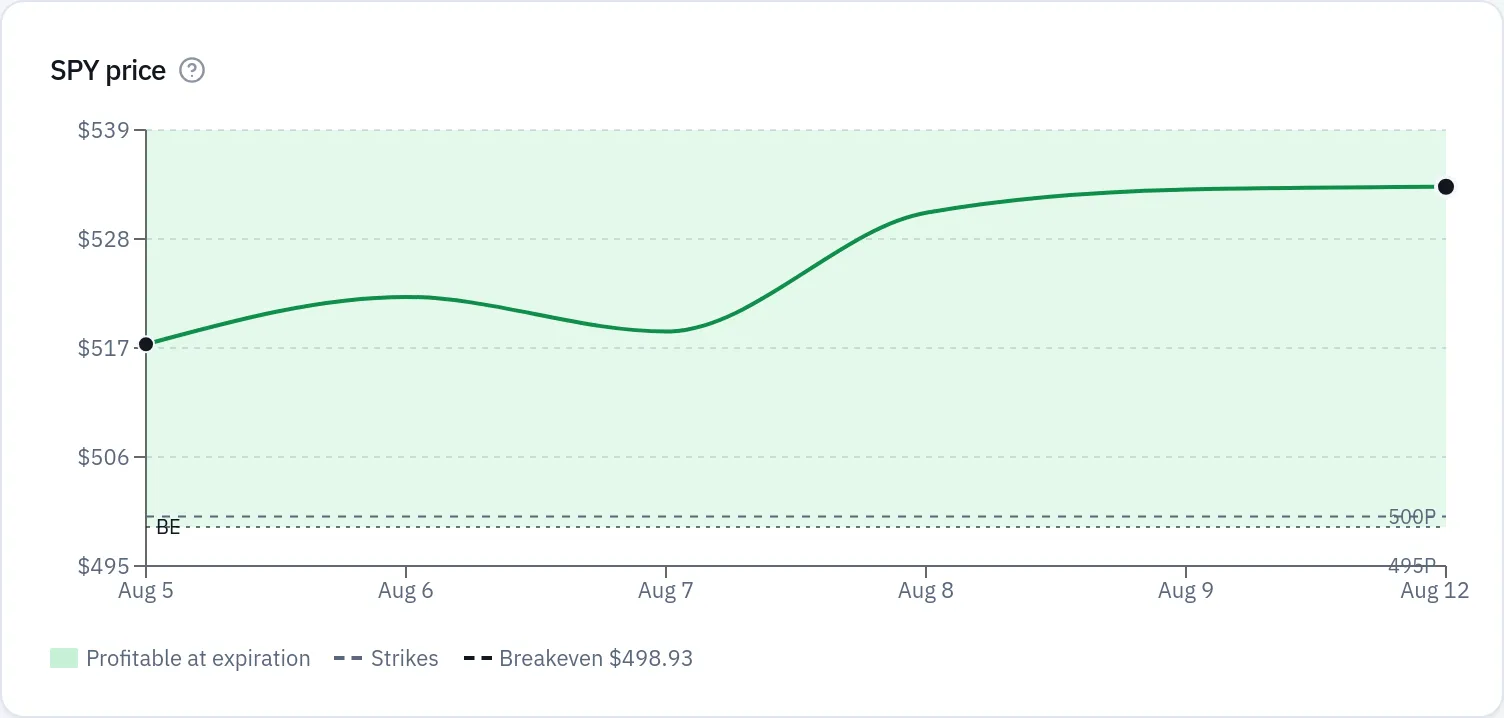
For this trade the shaded zone starts at $498.93 and runs upward, with the 500 and 495 strikes marked below the price line. SPY closed between $517.38 (the entry day) and $533.27 while the trade was on, so no close came within $17 of the 500 short strike. The chart is where you see how much room the trade actually had, which the P/L chart hides. A breakeven far outside the plotted prices is listed in the key and marked "off chart" at the top or bottom edge rather than drawn, so it does not flatten the price line.
The metrics grid
Twelve tiles, each with a "?" that explains it.

For the target run:
- Net entry $107 (credit), Max profit $107, Max loss $393, Risk basis $393.
- Annualized +716% — the return on risk scaled to a year. Seven days is a very short base to scale from, so read it as arithmetic, not as a rate you could repeat.
- Breakevens $498.93.
- Best exit +$54.00 (Aug 12, 2024) — the best close the trade ever reached, here the same day the target fired.
- Max drawdown −$4.00 (Aug 6 → Aug 7).
- Days up / down 5 / 0.
- Underlying move +$15.89, from $517.38 to $533.27, +3.1%.
- IV change −8.2 points, from 31.7% to 23.5%.
- Commissions $0.00, because the field was left at zero.
The IV tile is the most instructive one here. Implied volatility is the level of future movement the market is pricing into an option. It was unusually high on August 5 and fell hard over the following week. A short premium position benefits when that happens, so part of the +$54.00 came from the volatility collapse rather than from the direction of the move. The Where the P/L came from panel splits exactly that out.
Odds at entry vs result
This card puts what the entry day's implied volatility said next to what actually happened.
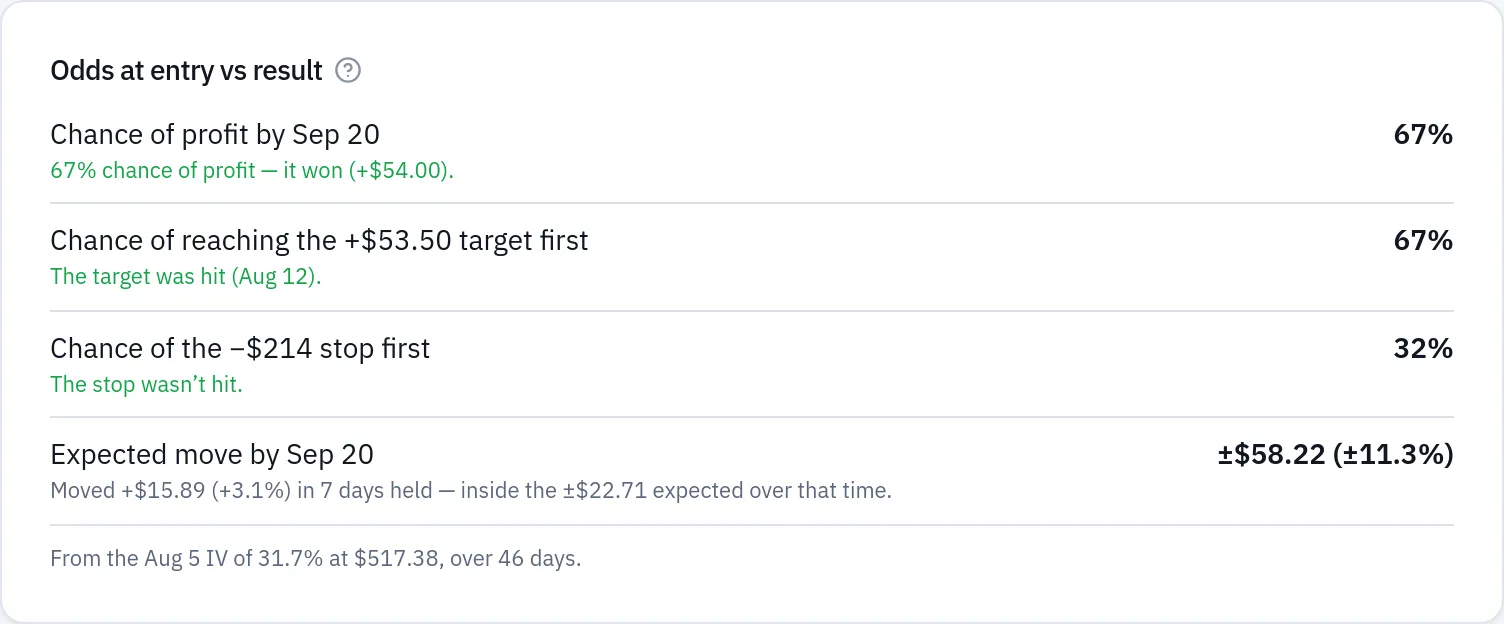
From the August 5 IV of 31.7% at $517.38, over 46 days: the chance of profit by September 20 was 67% — and the trade won, +$54.00. The chance of reaching the +$53.50 target before the stop was 67%, and it was hit on August 12. The chance of the −$214 stop coming first was 32%, and it was not hit. The expected move, one standard deviation, was ±$58.22 (±11.3%) by September 20; the actual move was +$15.89 (+3.1%) over the 7 days held, inside the ±$22.71 expected across that shorter span.
Read these as a description of what the market priced on the entry day, not as a forecast and not as a score for the trade. The model uses one implied volatility for the whole position (each leg's entry IV weighted by contracts), moves the underlying as a random walk, reprices the legs each day, and closes on the profit target, stop loss or DTE exit the first day one is reached. The other exit rules and any adjustments are not part of the odds, and the card notes when they apply.
The rest of the panels
Each leg shows every leg on its own, as P/L $ or as its per-share Price. For this spread, the short 500 put carried the gain and the long 495 put gave some of it back as its own value decayed — worth seeing, because it explains why the spread's profit grew more slowly than the short put alone.
Payoff at expiration plots P/L across underlying prices at the nearest expiration, with a dot where the trade actually closed. The dot sits well above the $500 strike and below the $107 ceiling, which is the picture of a target exit: profitable, but not the full credit. For an adjusted trade this line shows the position as it was opened.
Implied volatility charts each option leg's IV at the close. Greeks charts position Delta, Theta and Vega over time, each switchable.
Where the P/L came from splits the result into underlying move, time decay, IV change, commissions and everything else. It is estimated day by day from the previous close's Greeks: underlying move from delta and gamma, time decay from theta, IV change from vega. Other covers what the Greeks do not explain — large moves, fill versus mark, gap days. Treat the split as an attribution, not an audit.
The fills table lists each leg's entry and exit price, where each price came from, IV at entry and exit, and the outcome: closed, assigned, exercised or expired worthless. For an adjusted trade, each contract held gets its own row with the dates it was held, and every adjustment gets a row with what happened, the premium received or paid, and its costs. With natural or slippage fills, the table shows each mid beside the fill and a Fill cost tile appears.
Day by day is behind Show sessions: a table of every session, and selecting a row shows each leg's bid, ask, value, IV and delta that day. This is where you check whether a close that looks odd on the chart was a real move or a gap day — a session where a leg or the underlying had no complete end-of-day quote. Gap days are left blank and show as breaks in the charts, never as zero, and exit rules skip them.
Earnings, dividends and the early-assignment warning
Earnings reports and ex-dividend dates inside the trade are marked on both charts (E for earnings, D for ex-dividend) and in the day-by-day table. An earnings marker sits on the first session that traded on the report. If the earnings or dividend dates could not be loaded, a note above the charts says so — no markers then means "unknown", not "none".
A separate warning appears when you were short a call that closed in the money the session before an ex-dividend date with less time value left than the dividend: the call would likely have been exercised that night so the holder gets the dividend. It is a warning only. The backtest does not model early assignment and keeps the position open, so the P/L after that date needs reading with care.
Comparing two runs
Saved backtests can be compared two or three at a time, by ticking them in Saved backtests, or with Add to comparison on a current result or the compare button on a finished batch row. Here are the two SPY runs from the worked scenario: the one closed at the 50% target and the one held to expiration.
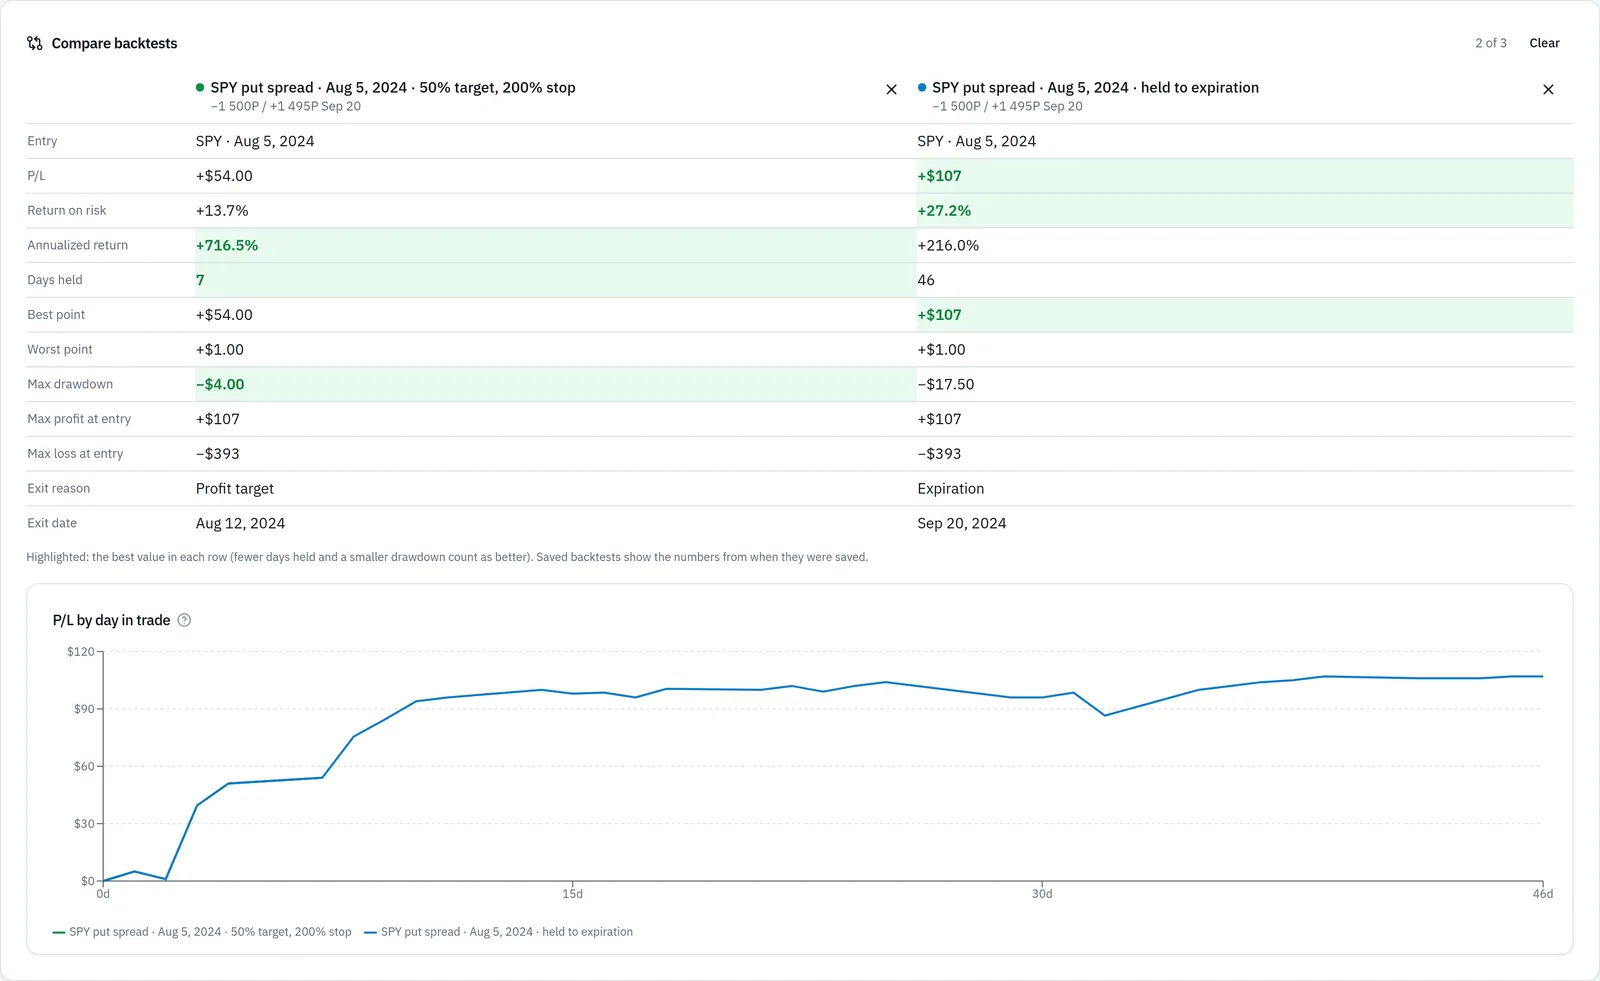
The comparison highlights the best value in each row, with fewer days held and a smaller drawdown counting as better. The target version wins on annualized return (+716.5%), days held (7) and max drawdown (−$4.00). The held version wins on P/L (+$107), return on risk (+27.2%) and best point (+$107). Max profit at entry (+$107) and max loss at entry (−$393) are the same for both, so nothing is highlighted on those rows. The chart plots P/L by calendar day in trade, so trades opened on different dates start together at day 0 — here the two curves run together until the target closes the first one on day 7, after which only the held version continues.
What this comparison does not settle is which rule is better. It is one trade in one week. It tells you what the 50% target cost you on this trade, and what the extra 39 days bought.
Common mistakes
- Treating one trade's answer as a rule. The SPY run says a 50% target cost $53 on that trade in that week; it says nothing about 50% targets in general. Fix: use Entry dates or the Strategy Backtester before you change how you manage every trade.
- Reading the annualized figure as a rate you could earn. +716% is +13.7% over 7 days scaled to a year. Fix: compare trades on return on risk and days held, and use annualized only as a rough speed check between two runs of similar length.
- Leaving Commission at zero and then comparing with your broker statement. The replay charged nothing on the entry, the exit and every adjustment. Fix: type the per-contract amount your broker charges before you line a backtest up against your own fills.
- Assuming a stop would have filled at the level you set. Rules are checked on closes only. Fix: open Day by day and look at the session that triggered the exit to see how far past the level the close actually was.
- Ignoring the early-assignment warning on a short call. The replay keeps the position open even when the warning fires. Fix: when you see it, treat the P/L after that date as a what-if and check the ex-dividend date against what your broker would have done.
- Taking the odds card as a verdict on the trade. A 67% chance of profit and a win in the same card is not evidence the model was right once, let alone generally. Fix: read it alongside max loss, the worst point and the drawdown, not instead of them.
- Backtesting one leg of a roll and calling it the whole trade. Loading a position does not follow a roll into the next position. Fix: backtest each segment separately, or rebuild the sequence under Rolls & adjustments so the whole life of the trade runs in one replay.
Related guides and help pages
Try the Trade Backtest Tool for free! (no sign-in)
Related guides
- Plan, Track, Optimize: a complete tour of MetisTrades
- Trade Path: how far each closed trade ran for and against you
- Keeping Track of Open Positions: Legs, Days to Expiry and Mark-to-Market P/L
- Contract size and the 100-share multiplier
- The Greeks in practice: delta, theta, vega and gamma
- What Happens at Expiration: Worthless, Assigned, Exercised or Closed